The debate around the Government’s personal income tax cuts is heating up, with further announcements expected in tomorrow’s Budget.
Many of the core arguments appear contradictory: most of the tax cuts benefit high-income earners, yet some people argue that high-income earners will end up paying a higher share of tax. Some argue the tax cuts are needed to support the economic recovery, while others argue they won’t be effective or could even hinder the recovery.
This piece explains the main points of contention and why sensible people can come to such different conclusions.
What could happen
Tomorrow’s tax cuts will be the government’s third attempt at a tax plan in as many years. The current plan has three stages:
- Stage 1 has already begun and delivers temporary tax cuts to low-and-middle-income earners until mid 2022, via a Low and Middle Income Tax Offset (LMITO).
- Stage 2 starts in July 2022, following directly on from Stage 1. It makes the Stage 1 benefits permanent and extends them to high-income earners too.
- Stage 3 commences in July 2024 and makes further permanent changes to the tax rules, including abolishing the 37 cent bracket, and reducing the 32.5 per cent tax rate to 30 per cent.
These three stages are already legislated – so will come into effect as per this timeline unless Parliament passes new legislation.
The first point of debate is whether the tax cuts should be fast-tracked. The Prime Minister and Treasurer have all but confirmed they will be, which means Stage 2 or even Stage 3 could start next financial year or could even be back-dated to the current financial year.
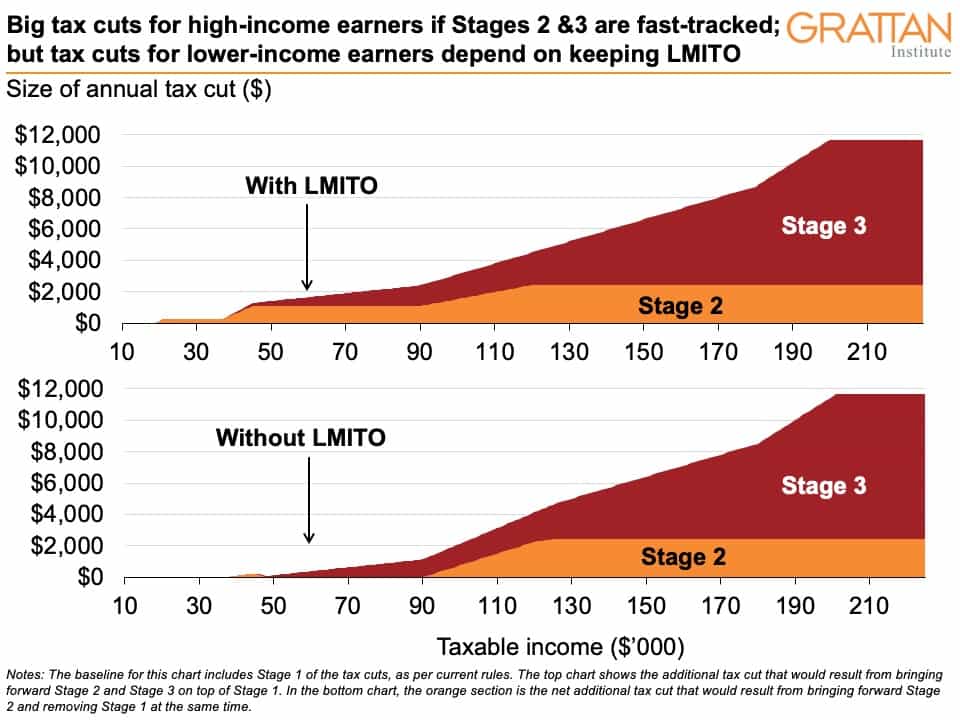
If Stages 2 and 3 are brought forward, and Stage 1 is kept, most workers will receive a tax cut. But Stages 1 and 2 were not originally designed to run in parallel. Stage 1’s LMITO is scheduled to expire in July 2022, with Stage 2 designed as its replacement. If Stage 2 is fast-tracked, it is unclear whether the LMITO will end immediately, be scrapped in 2022 as currently legislated, or whether it will now become a permanent feature of the tax system. As Chart 1 shows, this makes a big difference to what kind of tax cut is on offer for low- and middle-income earners – but either way there’s a big tax cut for higher-income earners.
Do tax cuts make for good stimulus?
Economists widely agree that while tax cuts do provide stimulus, there are many better stimulus options available. Whether tax cuts provide ‘good’ stimulus depends on how low the bar is.
Tax cuts generally don’t provide as much economic kick as others forms of government stimulus, because some of the money leaks to savings. This is even more true in the current environment of heightened uncertainty, and because these tax cuts will largely benefit higher-income earners, who are more likely to save than lower-income earners.
In a recent Economic Society poll of the stimulus options preferred by 49 leading economists, only 20 per cent put income tax cuts in their top four.
The stimulus bar may be fairly low right now. Grattan Institute estimates that $100-to-120 billion in extra fiscal stimulus is required in the next couple of years to get unemployment down quickly and avoid a long recession. This means that even if these tax cuts are not the best option available, they could form part of a broad suite of options that collectively deliver sufficient stimulus.
But the danger is the scale of the cuts might leave the government less willing to spend big on other choices – such as social housing, permanently boosting JobSeeker, and investing in government services such as aged care, mental health, and childcare services – that would be most effective at creating jobs.
Who benefits from the tax cuts?
Even though the tax cuts can provide stimulus, many still object to them on fairness grounds, arguing that they disproportionately favour the well-off and will reduce the scope for the government to fund necessary increases in services in the future. But others claim that the cuts are merely ‘a radical plan to stay the same’ and that the share of tax paid by high-income earners actually falls. So, what’s really going on?
There is no question that fast-tracking Stages 2 and 3 delivers the biggest dollar cuts to high-income earners. The average tax cut next year for someone earning more than $180,000 would be more than $11,000. By contrast, someone on median income of about $48,000 could expect a tax cut of just over $1,000 if LMITO is kept and only about $100 otherwise.
But in a progressive tax system any tax cut will deliver a bigger dollar cut to people on higher incomes.
Another measure of the ‘fairness’ of the cuts is the change in share of tax paid by different groups.
Figures produced by Deloitte Access Economics suggest that the top 5 per cent of income earners will pay a slightly higher share of tax in 2025, even with the tax cuts, than they did in 2018-19. However, Deloitte estimates the share paid by the top 10 per cent and top 20 per cent will be lower.
Deloitte compares the full tax plan to no tax plan (unwinding existing tax cuts under Stage 1). This might have been an appropriate comparison when the tax package was first debated, but it doesn’t pinpoint the effect of possible changes in this Budget.
As Table 1 shows, our estimates of the share of tax paid by high-income groups in 2025 under the Stage 2 and Stage 3 tax cuts compared to today show that the top 5 per cent, 10 per cent, and 20 per cent will all pay a lower share of tax if the tax plan goes ahead.
Table 1: Stage 3 reduces the share of tax paid by the top 5%, 10%, and 20% compared to today
| Share of total tax for groups of tax-filers | FY21 | FY25 Stage 2 only | FY25 full plan |
| Top 5% | 38.5% | 37.8% | 37.5% |
| Top 10% | 52.0% | 50.7% | 50.0% |
| Top 20% | 69.5% | 68.0% | 67.3% |
Table notes: The 2024-25 scenarios do not include LMITO because LMITO is currently scheduled to expire in 2022-23. Top 1% not shown because results are unreliable in a 2% sample file.
A better way to look at who benefits from the cuts is to look at how it changes average tax rates across the income distribution.

Chart 2 shows that compared to today (black line), Stages 2 and 3 would reduce average tax rates mainly for higher-income earners. But keeping LMITO (dotted lines) means that tax rates come down for low-and-middle-income earners as well.
Tax-filers around the 90th percentile (that is, people earning about $120,000 year) would get the biggest reductions in their average tax rates – from 29 per cent to 25 per cent – if Stages 2 and 3 are brought forward. By contrast someone on $50,000 could expect a 2 percentage point fall in their average tax rate if LMITO is kept – and only about 0.2 percentage points less without LMITO.
The key thing to look for regarding tax cuts in tomorrow’s Budget is whether LMITO is continued, and for how long. Those decisions will have the biggest impact on both the fairness of the tax system and the effectiveness of these tax cuts as stimulus.
Understanding the impact of tax cuts on the progressivity of the system is complex. Budget Papers have historically focussed on the dollar tax cuts and the impact on share of tax paid for high-income groups. But it’s worth remembering these provide only part of the picture. Looking at average tax rates across the distribution, or progressivity indexes such as the Reynolds-Smolensky Index, give a much better picture of how tax cuts change the system. But we will probably have to wait beyond budget night to see them.