Every year the Budget brings with it talk of tax cuts and giveaways for middle Australia. Based on pre-Budget speculation, this year’s Budget will be no exception.
But who actually makes up middle Australia? And who will benefit from the tax cuts and other goodies announced on Budget night?
Debates about the distributional impacts of tax policies are inevitably complex and there are plenty of pitfalls for the uninitiated.
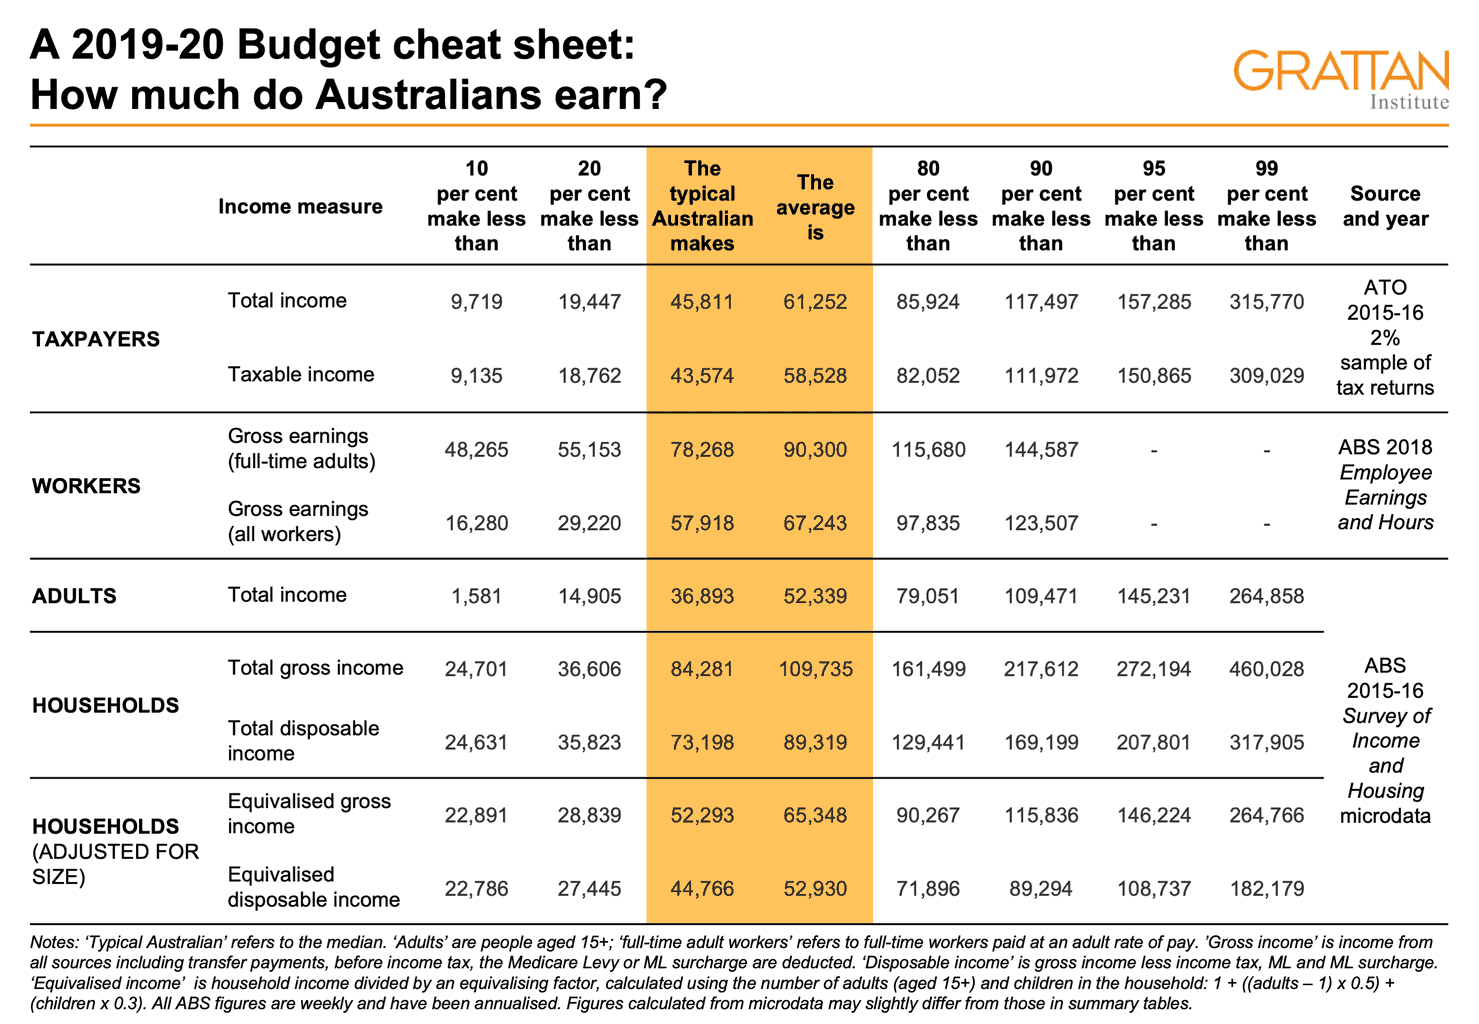
‘Average’ (or mean) earnings are often used as shorthand for what the typical Australian earns. But the average can be misleading. More than three-quarters of Australian workers earn less than the average full-time wage of $90,300. The typical Australian worker earns just $57,918. Most Australians earn less than the average hourly wage, and many employees only work part-time.
The typical worker earns $57,918. But more than a third of Australian adults aren’t in paid work, so the earnings of workers aren’t a good guide to the incomes of all people. The typical adult’s income is only $36,893, according to the ABS.
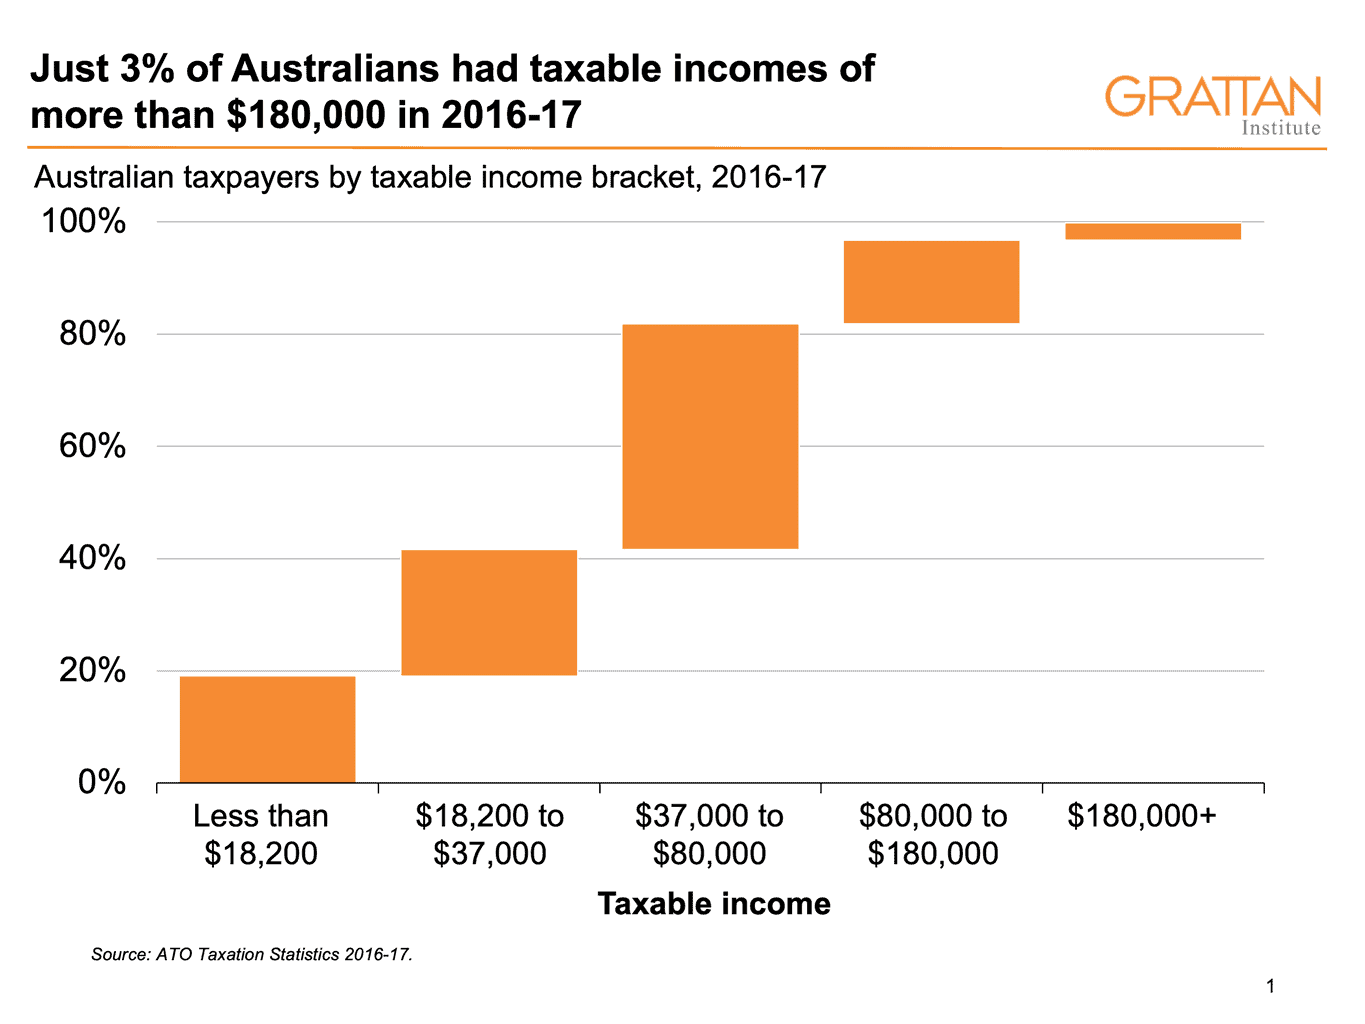
The tax system also frames how we think about the distribution of income. The top marginal tax rate of 45 cents in the dollar kicks in on taxable incomes above $180,000 a year. Journalists often use this threshold as shorthand for ‘high income’. But it may surprise you to know that just 3.1 per cent of Australian taxpayers had taxable incomes that high in 2016-17, the latest year for which figures are available. Only another 14.9 per cent had taxable incomes exceeding $80,000 a year. So a taxpayer with an income of $80,000 a year is therefore in the top 20 per cent of Australians.
Grattan Institute’s 2019-20 Budget cheat sheet on what Australians actually earn
To help cut through the confusion, we’ve pulled together this handy cheat sheet showing what Australians actually earn each year.
[Click here to download the cheat sheet as a PDF]
There are various types of income, measured in different ways. The right one to use depends on the purpose.
Talking tax
When talking taxes it’s typically best to use ATO data on incomes, as reported in personal income tax returns. Taxable income reported by the ATO refers to the incomes we actually paid tax on after taking out deductions for work-related expenses and donations to charities.
But using taxable income can sometimes go awry because of the idiosyncrasies in our tax system, as seen in recent debate over who would be affected by the ALP’s negative gearing and franking credits policies.
Negative gearing allows investors to deduct losses on their rental priorities against their wage and salary income, suppressing their taxable incomes. Therefore relying on the taxable incomes of those affected by the ALP’s proposed changes, without deducting rental losses, is misleading. People can have a high total income, but a low taxable income, if they deduct a lot of money through negative gearing or other means.
And taxable income ignores the largest source of income for many wealthier retirees: tax-free superannuation. This has led to claims that most people affected by the ALP’s franking credits changes are low-income earners. Their taxable incomes may be low, but their total incomes are not. Most of those affected are retirees too wealthy to receive any Age Pension.
But tax data isn’t the best source for understanding what Australians actually earn, because many Australians, such as pensioners and other income-support recipients, don’t need to file personal income tax returns. Their incomes are simply too low.
What about wages?
When people look around for an earnings figure representing a typical person, they often quote average full-time earnings. But, as we’ve seen, this figure is not a good guide to the typical person’s income. The typical full-time worker earns less than the average, not all workers work full-time, and not all people are in paid work.
What about households?
The most comprehensive source of data on the distribution of Australians’ incomes is the ABS Survey of Income and Housing. It provides a representative snapshot of the incomes of all Australians, including those not in paid work. The ABS publishes data on gross (pre-tax) and disposable (post-tax) individual and household incomes.
An individual’s income might not be a good guide to their economic circumstances – think of a low-income person who lives with a high-income spouse. Household income, too, can lead us astray – $100,000 goes a lot further in a two-person household than in a six-person household, for example.
This is why the figures used most often in calculations of inequality are based on household incomes, adjusted for household size. The ABS adjusts household income using an ‘equivalence scale’. The logic is simple: as a household grows in number it is assumed that some resources such as the kitchen will be shared, and so bigger households can get by with less money to spend per person. Incomes are reduced by dividing by an ‘equivalisation factor’, which is a measure of how many adults and children are in the household.
So here’s the bottom line: the typical Australian household reported a disposable income of $89,319 in 2015-16, but that figure falls to $52,930 after adjusting for household size.
Note: The ATO publicly released the 2016-17 tax statistics on 29 March. Grattan Institute has not yet received the file containing a 2% sample of tax returns for 2016-17. When we receive this data, we will update this post.