Summary
For more than a century, gas has been deeply enmeshed in the Australian economy. It heats our homes and cooks our food, generates electricity, fuels industry, and brings in export income.
But in the past decade, this has started to change. As Australian households and businesses search for cheaper, cleaner, and more efficient fuels, they are using less gas.
Governments have largely ignored this decline, and have failed to plan for it. As a result, new problems are emerging: electricity networks are under strain, backup generation for the power system is not being built fast enough, gas bills are rising, and manufacturers are closing.
And yet, the use of gas will need to decline even faster to meet emissions-reduction targets. The energy transition is also a transition for gas – from a widespread fuel to one that occupies some vital but small niches in a mostly-electrified economy.
Without action, gas use will continue to decline, but the process will be costly, chaotic, and inequitable. Governments must take control to both accelerate and manage the gas transition.
First, governments should implement policies to methodically and predictably reduce gas use across the economy. This includes setting phase-out dates for the use of gas in households, using the Safeguard Mechanism to encourage industrial decarbonisation, and reforming the electricity market to properly price both the emissions costs and the reliability value of gas. Policies to fix forecast gas shortages should put demand reduction ahead of increased supply.
Each sector will move at a different pace, depending on its options. Even in a mostly-electric economy, there will still be some residual demand for gas. To meet this demand, Australia will need supplies of renewable gases such as biomethane and hydrogen. Governments should drive their development with targeted grants, finance, and a demand-side obligation.
A declining gas market will need to be managed very differently, to avoid sky-rocketing prices for consumers and stranded assets for gas network owners. Governments should reform pipeline regulation to facilitate progressive decommissioning.
The role of gas-powered electricity generation is also changing. It is running less often, but is increasingly valuable as a backup during rare renewable energy droughts. The federal and state governments should use upcoming reforms to the wholesale electricity market to remove financing barriers for new gas-powered generators.
Less demand for gas means more demand for electricity. Without integrated planning, consumers and taxpayers are exposed to the risk of over-investing in gas and under-investing in electricity infrastructure. Gas and electricity system planning should be integrated to keep infrastructure costs low, and ensure the electricity network can handle increased demand from gas-to-electric switching.
While LNG producers are riding high at the moment, they face a future of being high-cost producers in a shrinking market as other countries move to reduce their reliance on high-cost and imported energy sources. For as long as the LNG industry lasts in Australia, governments should ensure it pays its share of tax, cleans up after itself, and keeps its emissions under control.
Australia is at a critical juncture in energy policy. The decisions made now around gas will have lasting ramifications. The gas transition will not get easier or cheaper if we wait. The choice is between chaotic and inequitable, or steady and fair. It’s time to move.
Recommendations
Recommendation1
Reduce demand for gas across the economy, with targeted policies across households, industry, and power generation, including phase-out dates for residential gas use.
Recommendation 2
Accelerate growth of the biomethane and green hydrogen sectors with better targeted industry policy and a new national scheme to drive demand for renewable gases.
Recommendation 3
Reform regulation and planning of gas distribution networks to enable and encourage the safe, progressive decommissioning of the network as households electrify. Share the costs between consumers, industry, and government through a grand bargain.
Recommendation 4
Get market settings right to ensure there is sufficient gas-powered generation in the National Electricity Market.
Recommendation 5
Better integrate gas and electricity planning to enable a least-cost transition away from gas by expanding the Integrated System Plan to include gas, and integrating the build-out of electricity networks with the phase-out of gas distribution networks.
Recommendation 6
Prioritise demand-side measures to address future gas supply gaps by expanding the Australian Energy Market Operator’s ability to identify and use demand-reduction tools.
Recommendation 7
Manage the LNG sector more actively to maximise its benefit to Australia. Prepare for a post-LNG economy by reforming gas taxes, requiring emissions cuts from LNG, and using industry policy to replace the economic contribution of LNG.
1 It’s time to get out of gas
Australia has used gas since the 19th century, when towns gas first lit our streets. Large-scale use of natural gas took off in the late 1960s on the east coast, and the 1970s on the west coast. Australia is also one of the world’s largest exporters of gas.
Gas production and use makes a material contribution to Australia’s greenhouse gas emissions, around 20 per cent.1DCCEEW (2026), DISR (2024). In this report, we use the term ‘gas’ to describe fossil methane, also called natural gas. There are two routes to reduce these. The first is to stop using gas by switching to electric alternatives. The second is to continue to use gas, but abate the emissions by switching to renewable gas, using carbon capture and storage (CCS) to prevent emissions, or removing those emissions from the atmosphere at a later date.
Current policies are sending us down the second route without considering the consequences. The federal government’s Future Gas Strategy implies we can reach net zero while keeping gas production and usage high beyond 2050. But this would require impracticably large volumes of renewable gases, wide deployment of CCS, and large volumes of carbon removals.
These solutions are unlikely to be available in the volumes required at prices people are willing to pay. Renewable gas is a nascent industry in Australia, and while it has potential to grow, it has limits that mean it is unlikely to supply volumes equivalent to (fossil) gas today. Carbon capture can only deal with a small subset of emissions from gas production. Carbon removals are scarce, competition for them will be fierce, and there are persistent concerns with their reliability.
It is almost certain that gas use will need to decline substantially to hit net zero.
1.1 Producing and using gas generates emissions
Gas results in emissions in two ways:
- Producing gas (getting it out of the ground and processing it) generates both carbon dioxide and methane emissions.2Methane is a potent greenhouse gas, with 28 times the global warming effect of carbon dioxide per tonne measured on a 100-year timescale: DCCEEW (2025a). When methane is extracted, some escapes through seals and pipes directly to the atmosphere. Sometimes, it is intentionally ‘vented’ for operational reasons, and sometimes producers burn it (‘flaring’) to convert it into the less potent carbon dioxide. Underground gas reservoirs usually contain a mix of carbon dioxide and methane. The carbon dioxide is removed and released into the atmosphere as pollution: Clean Energy Regulator (2024).
- Using gas (burning it in factories, power plants, and houses) generates carbon dioxide.
A small portion of production-related emissions are related to gas for domestic use. But because most gas produced in Australia is for export, about 40 per cent of Australia’s total gas-related emissions come from producing gas that is then exported.3The emissions from burning Australian gas that is exported are not counted in Australia’s emissions – they are counted in the countries where they are burned.
And while Australia’s overall emissions are declining, the relative contribution of emissions from gas is rising: the share of gas-related emissions rose from 14 per cent of overall emissions in 2012 to 23 per cent in 2022.4DCCEEW (2026).
1.2 There are two routes to abating gas emissions – the electrification route and the gas route
There are two routes to abate the emissions from gas. The first, and simplest, is to stop using gas altogether by switching to electricity. This is already technically possible for many, but not all, users. The second route is to continue to use gas, and deal with the emissions another way:
- Switch to renewable gases, which do not emit greenhouse gases when produced or used (see Box 1).
- Use fossil gas, capture the emissions at the source, and permanently store them underground, using CCS.
- Burn fossil gas, emit greenhouse gases, and remove these emissions from the atmosphere later.5In this report we use the term ‘removals’ rather than offsets to reflect that most offsets used today remove atmospheric carbon; and that to achieve net-zero emissions, all offsets must reflect carbon removals rather than avoided emissions.
Achieving net zero from gas requires balancing four questions:
- What can be electrified, by when, and at what cost?
- How much renewable gas will be available and at what cost?
- How much can carbon capture feasibly reduce emissions?
- How much can we rely on carbon removal to offset any remaining emissions?
The infrastructure, regulation, and market design required to meet Australia’s energy needs look very different depending on the answers.
The shape of the economy in 2050 depends on the capacity of the three options to deliver abatement, and their relative attractiveness compared to electrification.
1.3 Australia’s current policy of high gas use forever is a risky approach to decarbonisation
The federal government’s Future Gas Strategy forecasts that gas production and consumption will stay high indefinitely. This is a high-risk strategy because it relies heavily on renewable gas, carbon capture, and carbon removals, to meet Australia’s emissions targets. While each will play a role, they can’t sustain gas use at forecast levels.
Based on current forecasts, gas use will stay high long into the future
Australia is currently planning for billions in gas infrastructure because the Future Gas Strategy assumes very high gas use out to 2050 and beyond. The Australian Energy Market Operator’s latest 20-year forecasts are for domestic gas demand to decline by just 23 per cent by 2045 (see Figure 1.1 on the following page).
On the east coast, domestic demand is forecast to drop more than 40 per cent, mostly driven by an 80 per cent decline in gas use in buildings (residential and commercial). Demand for gas in industry declines 26 per cent, and demand for gas used in gas-powered electricity generation declines just 1 per cent.6All figures compare 2045 to 2026. AEMO (2026a).
A market with demand dropping 40 per cent over 20 years is in fairly rapid decline. Still, a market consuming 300 petajoules of gas in 2045 will face huge challenges in hitting net zero just five years later.
On the west coast, the challenge is even more daunting. AEMO is forecasting gas demand will only marginally decrease, by 4 per cent to 381 petajoules, by 2045. Gas-powered electricity generation is forecast to decline by about a fifth, and household gas use by a half. But industrial gas demand is forecast to increase by 8 per cent over the next 20 years.7AEMO (2025a).
Demand for Australian liquefied natural gas (LNG) exports is forecast to decline faster than domestic demand, but the LNG sector is still forecast to be four times the size of the domestic gas sector by 2045.8Future LNG demand is difficult to predict. AEMO and federal government forecasts of future LNG demand declines are based on existing LNG contracts expiring, declining global LNG demand, and Australia being edged out by cheaper competitors. These trends are discussed further in Chapter 7.
Australia currently exports about 4,500 petajoules of LNG per year. Gas demand for that purpose is forecast to decline by about 40 per cent to 2,800 petajoules by 2045.9Most of this forecast decline comes from WA exporters. Legacy gas fields on the North West Shelf have been declining, to the point that Woodside retired a 2.5 megatonne train at the facility in 2025: Woodside (2025). New supply may be delivered from development of the Browse basin, but this project remains economically uncertain. The forecast of 2,800 petajoules assumes a constant amount of LNG exports from the NT in line with recent export figures, as no reliable independent forecasts are publicly available. Existing LNG demand is slightly overestimated through the combination of Australian Energy Statistics for NT with GSOO data for LNG production.
Figure 1.1: Demand for gas is forecast to remain high into the 2040s
PJ of gas demand
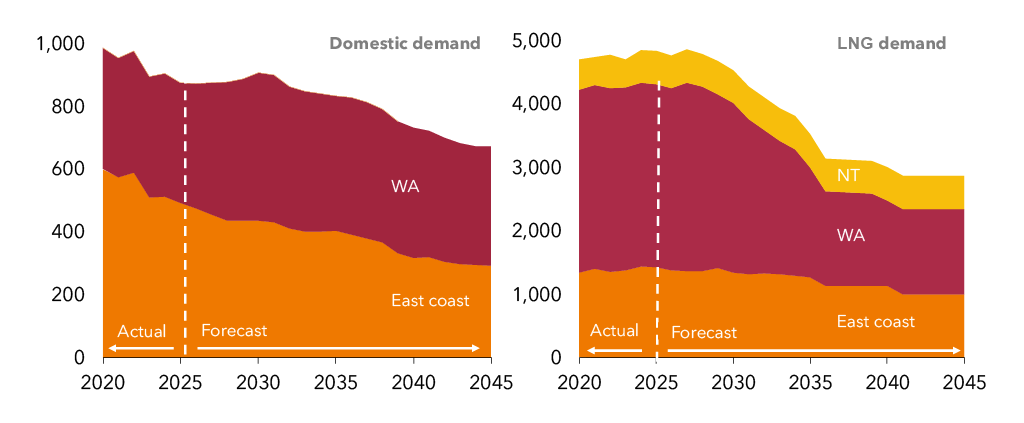
Notes: PJ = petajoules. East coast estimates are compiled from the 2026 Gas Statement of Opportunities and west coast estimates from the 2025 WA Gas Statement of Opportunities. NT LNG estimates are forecast as flat, based on current data in the Australian Energy Statistics. A full explanation of volume and emissions forecasts is in Appendix A.
Sources: AEMO (2025a), AEMO (2026a), DCCEEW (2025b).
High gas use means heavy reliance on implausible abatement options
High gas use means hitting net zero would require large amounts of renewable gases, CCS, and carbon removals.
Analysis of the federal government’s emissions projections suggests Australia’s gas-related emissions will decline from 90 million tonnes today to 64 million tonnes by 2050 (see Figure 1.2).10See Appendix A for how this projection was calculated.
But any remaining emissions from gas in 2050 would all need to be offset through carbon removals.
On these projections, Australia will have too many emissions from gas in 2050 to hit net zero. The largest plausible role that renewable gases, CCS, and carbon removals might play is still not enough to enable the use of large volumes of gas. In the remainder of this chapter, we outline what role each of those options could realistically play.
Figure 1.2: Renewable gases and CCS can only solve a small share of gas emissions, and relying on carbon removals to tackle the rest is risky
Projection of gas-related emissions and estimated role of abatement options under current policies, MtCO2-e
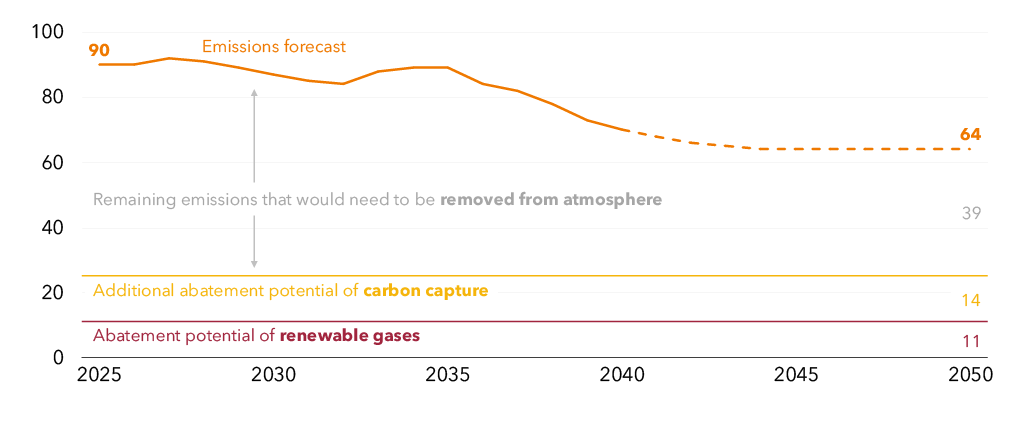
Note: MtCO2-e = millions of tons of carbon dioxide equivalent emissions, and includes other emissions (such as methane) converted to carbon dioxide-equivalent amounts.
Sources: Grattan analysis of DCCEEW (2026), DISR (2024), AEMO (2026a), and AEMO (2025a).
Box 1: Renewable gases
Hydrogen is a critical input into a range of commodities including fertilisers, explosives, and chemicals such as methanol. Hydrogen can be made through a range of methods:
– Grey hydrogen is made by reacting methane gas with steam. This produces carbon emissions. Almost all hydrogen made in the world today is grey.
– Brown hydrogen is made by gasifying coal, which again produces carbon emissions.
– Green hydrogen can be made by running an electrical current through water. When using zero-emissions electricity, this method is zero emissions and is considered a renewable gas. This requires large volumes of renewable electricity delivered to the electrolyser site, alongside a reliable supply of purified water.
The hydrogen is then compressed and stored, or converted for transport and end use.
Green hydrogen could be used, with retrofitting, as an alternative to fossil methane for industrial gas users that require gas as a feedstock or a heat source. It could be used to replace methane in gas-powered generation – the Kurri Kurri and Tallawarra B power stations in NSW are theoretically capable of running on 15 per cent and 100 per cent green hydrogen, respectively. But neither station has any plans to start using hydrogen.
Biomethane is chemically identical to fossil methane, but is produced from biological sources such as food waste. Most biomethane is produced using anaerobic digesters, sealed tanks where organic matter breaks down without oxygen to form biogas, which is then ‘upgraded’ to biomethane by removing the carbon dioxide.
Burning biomethane, like burning fossil methane, produces carbon dioxide. But biomethane is considered renewable because it releases carbon into the atmosphere that was already in the active carbon cycle – that is, it was absorbed by plants and animals as they grew and would have been returned to the atmosphere through decomposition.
This is distinct from fossil methane, which releases carbon into the atmosphere that had been locked away for millions of years.
Not everyone agrees that biomethane can be considered ‘zero emissions’ or ‘renewable’. Burning organic matter releases carbon much faster than organic decomposition would. Methane can leak from anaerobic digesters. And if land is converted from being an active carbon sink to growing crops that are used for biomethane production, then biomethane production is not zero emissions.
However, biomethane can be produced with near-zero emissions, and so this report considers it a renewable gas and a potential pathway to decarbonising in some use cases.
1.4 Renewable gases will play a role, but it is likely to be small
Some gas-related emissions can be avoided by using more renewable gases – either hydrogen or biomethane – both of which can be produced with zero or near-zero emissions (see Box 1).11BioLPG is a third renewable gas that may play a role. Historically, Liquefied Petroleum Gas (LPG) is used mostly in residential gas bottles and some industrial applications. BioLPG is chemically identical to LPG, but is made from biological sources. This report focuses on hydrogen and biomethane because they will likely play much larger roles than bioLPG. Australia currently consumes about 43 PJ of LPG per year compared to nearly 900 PJ of natural gas: Elgas (2026).
But the resources and costs required to produce large volumes of hydrogen and biomethane are major barriers that constrain the role they can play in replacing fossil gas.
And hydrogen and biomethane present (different) logistical and infrastructure challenges which would need to be overcome to reach a scale where they could be substitutes for large quantities of fossil gas.
In a net-zero economy, both will be required in some quantities. But in practice, neither is likely to be available in the quantities required to replace a meaningful portion of fossil gas consumption, especially when there are cheaper and more efficient substitutes available via electrification.
Hydrogen is energy intensive, expensive and hard to transport
Producing sufficient hydrogen to substitute for natural gas would require substantial electricity generation capacity, electricity grid capacity, and water treatment.
Emissions forecasts in the federal government’s electricity and energy sector plan already assume production of 4 million tonnes of green hydrogen per year by 2050, but most of this is for export-oriented production of green iron and ammonia. Just 1 million tonnes, equivalent to 120 petajoules, is earmarked for ‘domestic decarbonisation’ – the chunk that could be used to help existing fossil gas users abate their emissions.12These figures cover all of Australia, not just the National Electricity Market.
Producing 1 million tonnes of hydrogen requires 48 terawatt-hours of electricity – equivalent to the combined annual output of the Yallourn, Eraring, Loy Yang A, and Loy Yang B coal-fired power stations.13Assuming 70 per cent capacity factor of the coal plants and assuming 70 per cent energy efficiency of hydrogen production as a likely current average of the range of efficiencies from electrolysis: Aminaho et al (2025), Boretti (2024), Jia et al (2025), Le et al (2023). Producing 4 million tonnes of hydrogen would require 31 gigawatts of new electricity generation capacity, nearly 40 per cent of current capacity in the National Electricity Market.14The current installed generation capacity in the NEM is 81 gigawatts: Open Electricity (2026).
Because it requires so much electricity to produce, green hydrogen is expensive. Current estimates are that hydrogen costs about $7.50 per kilogram, about five times the cost of natural gas.15Cost estimate for green hydrogen is based on a composite of public estimates of green hydrogen costs in Australia. See: DCCEEW (2024), GHD (2023), Fortescue (2024).
The physical challenges of moving hydrogen are well-understood. Compared to natural gas, hydrogen is lighter, smaller, ignites easier, burns faster, and holds less energy per unit of volume. Because it behaves so differently to natural gas, without equipment upgrades, it cannot be transported or burned in equipment designed for methane.
As a result, hydrogen use is likely to be concentrated in a small number of large industrial sites with built-for-purpose facilities. So, it is likely to play an important role in decarbonising some uses of natural gas (and coal) that do not have viable alternatives. But because of the challenges of producing it at scale, methane-to-hydrogen switching is not going to be a viable decarbonisation option for most gas users.
Substituting 1 million tonnes of hydrogen (120 petajoules) for fossil methane would meet about 20 per cent of the remaining gas demand in 2045, and reduce emissions by just 6 million tonnes per year. At present Australia produces about 0.1 petajoules of green hydrogen annually. Planning for an industry of 120 petajoules is already extremely ambitious; the capacity to do more seems out of reach.
Cheap feedstocks are scarce, so biomethane is likely to be expensive
Estimates of Australia’s potential to produce biomethane vary widely. One estimate suggested recoverable biomethane stocks could be hundreds of petajoules, able to displace 44 per cent of Australian fossil gas demand.16Yarnold et al (2025).
But the current forecasts being used by AEMO suggest that only about 90 petajoules of biomethane could be supplied at a price competitive to fossil gas, even as far out as 2050 (Figure 1.3).
Figure 1.3: Small volumes of cheap biomethane are available, but producing it at scale would require using expensive feedstocks
Estimated costs and volumes of biomethane for different feedstocks in 2050, $/GJ
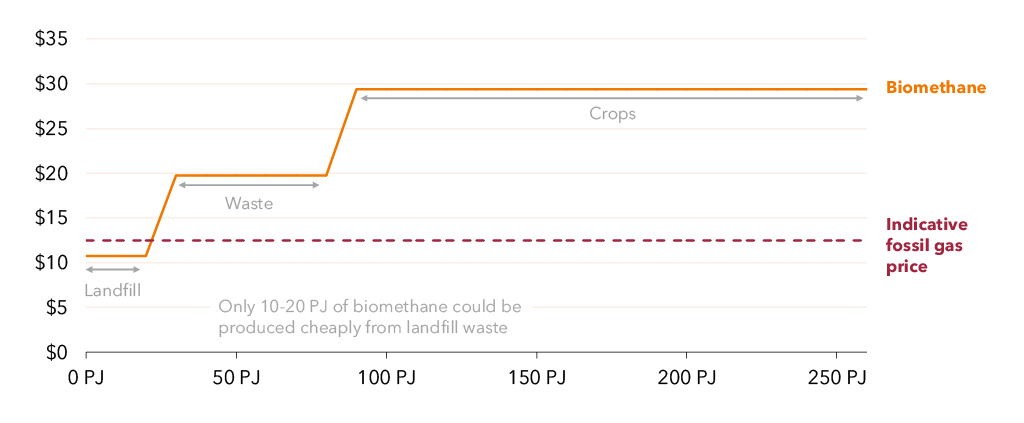
Notes: GJ = gigajoules. PJ = petajoules. Costs are forecast production costs in 2050, shown in today’s dollars. Indicative fossil gas price based on average domestic prices used in the ISP. Potential availability and prices of gases will change over the forecast period; estimates are best-efforts, based on best available current information.
Source: Grattan analysis of AEMO (2025b).
There are three main sources of biomethane feedstock, each with a different production cost. The cheapest feedstocks are in scarce supply, and the abundant feedstocks are the most expensive. So the more biomethane that is produced, the more expensive it becomes:17ACIL Allen (2025).
- Producing biomethane by capturing and upgrading landfill gas can be done cheaply, at about $11 a gigajoule, but there is not much of it, around 10-20 petajoules per year.
- Producing biomethane from waste could produce another 70-80 petajoules per year, at about $20 a gigajoule. This is about 40 per cent above east coast gas prices for the past 12 months, and at this price, many gas users would be unable to afford the gas.
- Producing biomethane from crop residue could produce hundreds of petajoules per year, but at nearly $30 a gigajoule, it would be prohibitively expensive for most gas users.18Other sources have similar estimates. RACE for 2030 estimates about 400 PJ of total feedstock (compared to 290 PJ from ACIL Allen) and 50 PJ of landfill and waste feedstock (compared to 90 PJ from ACIL Allen): Blunomy (2025), Kaparaju (2023), AEMO (2025b).
Feedstocks for biomethane are generally different to the feedstocks suited to other biofuels, such as sustainable aviation fuels or biodiesel, but some feedstocks can be used to produce multiple biofuels, and feedstock competition is likely to increase as production methods improve and cheap feedstocks are exhausted.19Currently there is little feedstock competition between biomethane and other biofuels: feedstocks such as sewage waste, food waste, and animal manure are currently better suited to biomethane, whereas oils, fats, and woody waste are better suited to liquid fuels. The greater the production of either fuel, the more likely competition is to arise between uses of feedstocks as more expensive routes for production are used, with less optimal feedstocks employed. Developments in technical processes for fuel manufacturing may introduce new competition or complementarity between uses of feedstocks over time.
Aviation, long-distance trucking, and diesel power generation will all rely on these fuels for their path to net zero. They are likely to be more willing to pay for access to scarce feedstocks than many gas users that have electrification alternatives. So competition for feedstocks is likely to tilt supply towards low-carbon liquid fuels rather than biomethane.
Biomethane has unique logistical challenges
Because it is produced by processing organic matter, the production of biomethane is tied to the availability and location of suitable feedstock streams. Digesters must be located close to the sewage treatment centres, farms, or other sources of feedstock that they use to produce biomethane. Facilities fuelled by agricultural residues also face seasonal constraints to their feedstock supply.
Biomethane production differs from fossil gas because it is made from many small, scattered waste sources rather than a few large gas fields.
Fossil gas supply chains are built around moving large, steady volumes through shared infrastructure. Biomethane production is typically smaller-scale and local, transporting batches of biomethane volumes with seasonally variable output, reflecting where organic wastes are generated.
Moving the gas is also harder. Injecting small volumes into the network still requires fixed capital costs for compression, monitoring, and metering equipment. Transmission pipelines are usually built for much larger volumes, and connection points may be far away. As a result, transporting biomethane can be disproportionately expensive, making local use more practical than piping it long distances.
So, similarly to hydrogen, biomethane is likely to be cost-effective in specific cases – gas-powered generation, industrial heat, or industrial feedstocks.
Without a major cost reduction, demand for biomethane is unlikely to exceed the 90 petajoules that could be produced annually for about $20 per gigajoule by 2050.20$20 per gigajoule is the price in 2050 in today’s dollars, assuming cost reductions from today. Leaving aside feedstock costs, the cost of biomethane technology is likely to decline over time, and the cost of biomethane may decline faster than projected as the sector improves feedstock coordination, develops a supply chain and shared infrastructure, and replicates successful business models. But biomethane production is a mature technology, so it is unlikely to see cost reductions from breakthrough innovation. Modelling commissioned by AEMO suggests biomethane costs may decline by a relatively modest $4 per gigajoule by 2050.21ACIL Allen (2025).
Ninety petajoules of biomethane would reduce emissions by about 5 million tonnes of carbon dioxide, and meet less than 15 per cent of forecast gas demand in 2045. Current production levels are essentially zero, and to scale up to produce 90 petajoules will require considerable industry development effort. This is discussed further in Chapter 3.
1.5 Carbon capture and storage can play only a limited role in reducing gas emissions
About half of gas-related emissions come from using (as opposed to producing) gas. Most of these emissions are combustion emissions – carbon dioxide given off when gas is burned. These emissions can theoretically be captured and stored.
But most sources of carbon dioxide emissions are too diffuse, or the sources are too small, to easily capture. For large single sources of combustion emissions, using CCS requires new energy- and capital-intensive steps that are unviable without a high carbon price, and uncompetitive with other solutions even with a high carbon price. Because of this, the role CCS can play in decarbonising gas is capped.22The exception is emissions from ammonia production: 40 per cent of these are concentrated and easily separable, and so could be captured: Chahrour and Wulf (2025). There are eight operating ammonia plants with CCS globally. Other CCS methods such as at gas power plants, or even capturing carbon dioxide directly from the air, are currently between 50 per cent and 1,200 per cent more expensive than CCS on natural gas processing: IEA (2020).
About half of emissions from gas production, 20 million tonnes, are combustion emissions, and as noted above, these are difficult to capture. The remaining 22 million tonnes are fugitive emissions – unintended releases of gas to the atmosphere.23DISR (2024). Of these fugitive emissions, eight million tonnes are methane that leaked through gaps in equipment, or are intentionally vented for operational reasons. These can and should be reduced through increased efficiency, but cannot be captured using carbon capture technology.
The rest is carbon dioxide. Some of that carbon dioxide is accidental leaks and venting which CCS cannot capture. The remaining portion is the venting of pure carbon dioxide gas that has been separated. The abatement potential of CCS is limited to this portion of gas emissions (see Figure 1.4).
Figure 1.4: Only a small share of gas-related emissions are currently able to be addressed with economical carbon capture and storage
Emissions from gas production and use, MtCO2-e
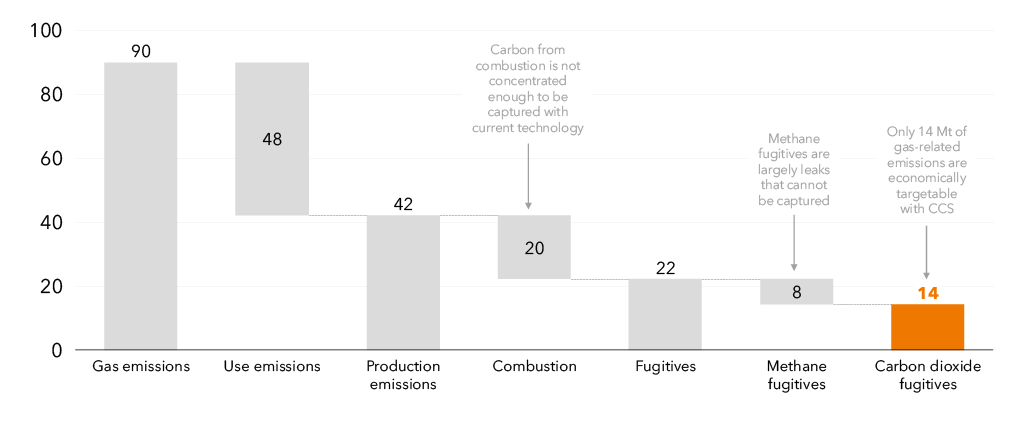
Notes: MtCO2-e = millions of tons of carbon dioxide equivalent emissions, and includes other emissions (such as methane) converted to carbon dioxide-equivalent amounts.
Source: Grattan analysis of DCCEEW (2026).
At most, CCS could technically abate 14 million tonnes – about 15 per cent of gas-related emissions.24In reality, only a portion of the 14 million tonnes of carbon dioxide fugitive emissions that are process offgas can be captured, whereas leaks cannot. For the purposes of our calculation we assumed the entire portion could be capturable offgas, because it is not possible to reliably break down these emissions into two categories. Our estimate is therefore a generous one. This is a generous estimate: it assumes that every gas processing facility in Australia has CCS operating with capture rates of 100 per cent.25The Gorgon CCS project off WA has capacity of 4 Mtpa but injected just 1.4 million tonnes in 2024; the Moomba CCS project in SA has capacity of 1.6 million tonnes per year but stored just 0.8 million tonnes last year: Morrison (2025). Given Australia has just two operational CCS projects with capture rates of about 40 per cent, the real volume of emissions that can be abated with CCS is likely to be much smaller.
1.6 There are hard limits on carbon removals
Carbon removals face several hard limits, so relying on them to abate millions of tonnes of emissions from using gas in 2050 is high risk. It would reduce the availability of carbon removals for other sectors, push up the cost of hitting net zero for everyone, or simply result in missing emissions targets.
While in the short term removals are better than no action to reduce emissions at all, in the long term their use must be limited to sectors that don’t have viable alternatives.
Removing carbon from the atmosphere takes a large amount of land
While there are lots of different ways of creating carbon offsets, removing carbon dioxide from the atmosphere through reforestation is currently the most used.26CER (2026a).
If Australia were to offset 64 million tonnes of carbon emissions every year (forecast emissions from residual gas use in 2050), we would need to plant and maintain about 16 million hectares of temperate forest – more than twice the size of Tasmania.27Calculation based on estimates from the Kyoto Protocol State of the World’s Forests: FAO (2001), ABARES (2025).
Planting trees is not the only way to remove carbon from the atmosphere – carbon can be stored in soils and kelp forests, and new technologies are emerging that may play an increased role such as direct air capture and mineralisation. But storing carbon in living ecosystems at scale is challenging, and neither mineralisation nor direct air capture have been proven to be commercially viable at scale even with high effective carbon prices. It is not tenable to base an emissions strategy solely on these.
Carbon removals will be scarce, and competition for them will be high
Gas is not the only sector Australia is trying to decarbonise. Many other sectors with high emissions have no clear abatement option other than carbon removals.
Farming cattle (55 million tonnes of emissions per year), flying planes (9 million tonnes), and making cement (5 million tonnes) are all major sources of emissions in Australia that will likely rely on carbon removals for some time.
Should Australia choose to open domestic carbon markets to overseas buyers, there will also be competition for Australian carbon removals from international customers with hard-to-abate emissions, including in emissions-intensive countries such as Japan, South Korea, and Taiwan. This would open up a potentially lucrative new export industry.28For example, the Australian Energy Market Commission assumes that the shadow cost of carbon offsets would be about $450 a tonne in 2050. If the market for offsets converged to this value, using carbon removals here would be equivalent to forgoing $22 billion in export income: Wood McKenzie (2025a), AEMC (2024).
And carbon removals are not entirely reliable
The reliability of carbon removals has been called into question many times, and reliability is likely to decrease in future.
Numerous studies have found mismatches between forecast and actual carbon offset capacity.29Macintosh et al (2024a), Macintosh et al (2024b), Probst et al (2024). And forestation-based offsets are increasingly vulnerable to climate-induced disruption, which may not be adequately priced in using current methodologies.30Dye et al (2024). Staking Australia’s emissions targets on methodologies with high degrees of uncertainty is high risk.
1.7 Gas use will need to decline substantially to hit net zero
Each of these abatement options – carbon capture and storage, renewable gases, and carbon removals – carries risks and challenges and can only abate small volumes.
Emissions from gas are 90 million tonnes today. At best, carbon capture and storage might abate 14 million tonnes, hydrogen another 6 million tonnes, and biomethane another 5 million tonnes. Relying on carbon removals to do the rest is not feasible; they will not be available in volumes or prices that make this possible.
In short, it is not viable to keep using gas in such high volumes and still expect to hit net zero. The most reliable way to decarbonise gas is to reduce gas consumption by electrifying all uses of gas that can be feasibly and commercially electrified and in the next chapter, we show how to do this.
In the rest of the report, we outline how to manage the decline of the gas market.
2 Safely and predictably reduce gas use
Gas use in Australia is already in decline. Domestic gas consumption has declined from 986 petajoules in 2020 to 876 in 2025, an 11 per cent drop in five years.
The decline is across sectors. Household gas use peaked in 2022 and has declined 16 per cent since. Industrial gas use has been in decline since the early 2000s as manufacturing has declined. And gas for power generation peaked in 2014 and has declined 11 per cent since.
But these declines have largely not been driven by emissions-reduction policy. And they are not fast enough to hit our emissions targets.
Reducing emissions from gas use will ultimately require households and businesses to change their appliances and machinery from gas to electric alternatives. To make sure the asset owner makes the ‘right’ decision, and chooses an asset that uses less or no gas, governments need to send consistent signals about goals and timeframes; and they need to put in place long-term support to overcome barriers to change.
To help households electrify, governments should set phase-out dates for residential gas use, and remove barriers to electrification.
To sharpen incentives to reduce industrial gas use, the federal government should tighten the Safeguard Mechanism. Beyond this, targeted industrial policy will be required to reduce technology and financial risk faced by firms making large capital investments.
In the electricity sector, a carbon constraint is needed to achieve an efficient deployment of gas power generation. Reforming the Safeguard Mechanism is the simplest way to do this.
Coordinated policy across sectors would provide more certainty about the pace and scale of gas reductions, and contribute to meeting emissions-reduction targets. Governments should waste no more time.
2.1 Households are moving away from gas
Across Australia, households have started moving away from using gas for heating, cooking, and hot water (see Figure 2.1).
Figure 2.1: Gas demand in Australia is declining across all sectors
PJ of gas use
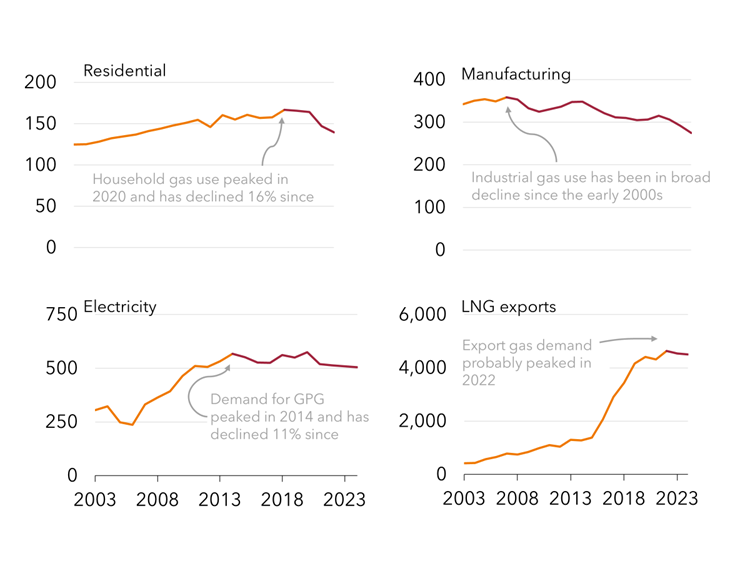
Notes: PJ = petajoules. GPG = gas-powered generation. Manufacturing gas use does not include all industrial use. Electricity demand is final gigawatt-hours converted back to petajoules. Full methodology explained in Appendix.
Sources: DCCEEW (2025b), AER (2025a).
In 2025, for the first time, the number of households consuming gas has declined (defined as customers with an active retail gas plan, see Figure 2.2). Residential gas demand has declined 12 per cent since 2019 on the east coast,31AEMO (2026a). and 27 per cent on the west coast.32AEMO (2025a).
Figure 2.2: The number of households consuming gas has declined for the first time
Total residential gas customers in Australia
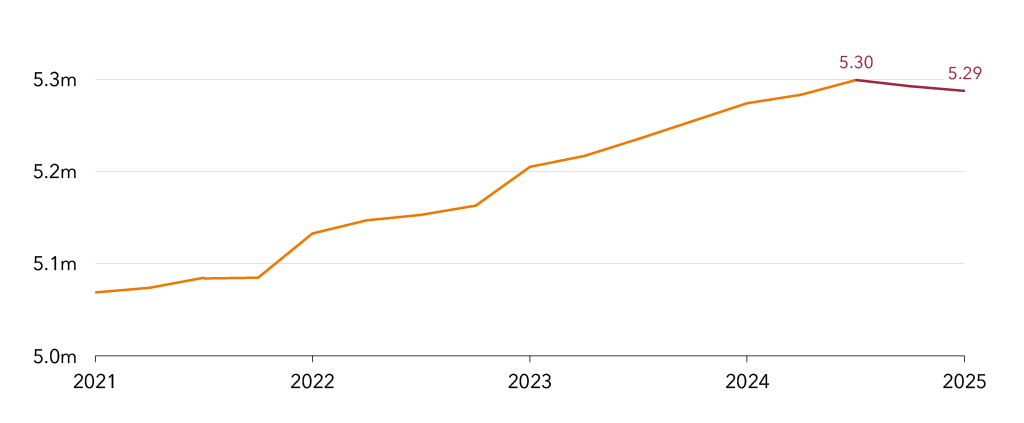
Note: Excludes the Northern Territory. This data refers to customers with retail gas plans. Separate network data on gas connections indicate numbers still rising, but the gas retail data provide a more accurate view of the number of customers actually consuming gas, as opposed to customers with dormant gas connections.
Sources: Grattan analysis of AER (2025a), Essential Services Commission (2026), and ERA WA (2025).
For most households in Australia, upgrading their cooking, water heating, and home heating from gas to efficient electric appliances saves money. These savings can be considerable, especially in colder states such as Victoria, where homes typically use a lot of gas (see Figure 2.3).
Figure 2.3: Most households will save money if they upgrade from gas to electric appliances
Potential range of household savings over 10 years, 2023 dollars
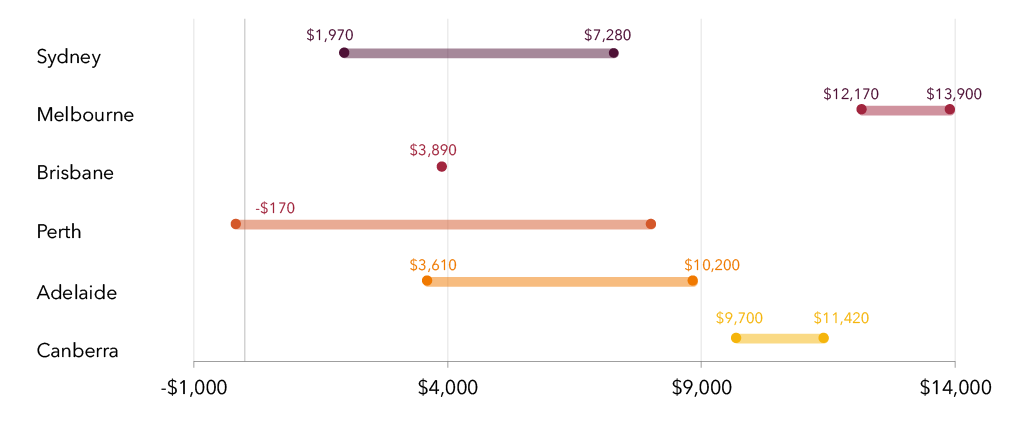
Notes: The leftmost dot reflects the savings over 10 years from electrifying hot water and cooking for a house without gas heating; the rightmost dot is the savings over 10 years from electrifying heating, hot water, and cooking. Includes the upfront cost of new appliances, assumed to be replaced when old ones break. See Appendix B of
T. Wood et al (2023a) for further detail.
Sources: Grattan analysis in T. Wood et al (ibid).
Modelling by the federal government found that by switching to electric cooking, space heating, and water heating, Australian households could save $1,040 per year (including upfront capital costs).33Treasury (2025). In our 2025 report Bills down, emissions down, Grattan’s analysis made a similar finding.34Reeve et al (2025).
But our analysis shows that more than half of households will face one or more barriers to upgrading their appliances to all-electric. For the one-third of households that rent, their appliances are their landlord’s choice, not theirs. For property owners who live in multi-unit buildings, there are issues around common property and building management. Then there are households on low incomes or who have few savings: these households will not have access to the upfront capital required to upgrade. And some older houses will require more significant rewiring to electrify.35T. Wood et al (2023a).
Government action is required in five areas to help households upgrade
For households to access the benefits of all-electric homes, governments need to take action in five areas:
- Policy: Set a date for an end to household gas use; map the pathway to that goal; and integrate planning for the switch from gas to electricity in energy system planning.36Residential gas makes up only a small portion of overall national emissions. However, phasing out gas in homes is a significant logistical exercise – it will take decades to replace millions of appliances. To electrify at lowest cost, those appliances should be replaced at end of life. For these reasons, the electrification of residential gas demand should start immediately.
- Regulation: Ban new gas connections; require decommissioning; and manage the network death spiral.37See Chapter 4.
- Equity: Remove gas appliances from public, social, and Indigenous housing; set minimum rental standards; and provide incentives to landlords ahead of these to replace gas appliances with electric ones.
- Consumers: Give consumers consistent and reliable information about how to make the change, and facilitate access to financial assistance for those who need it.
- Complementary measures: Invest in the additional skilled workers needed to deliver electrification, and regulate electric appliances to ensure the appliances perform well.
To date in Australia, progress on these actions has been patchy. Only the ACT has set a date for an end to household gas. Only the ACT and Victoria have gas roadmaps (the NSW government says it will produce a roadmap in late 2026). There has been some progress in integrating gas and electricity planning, but more work is needed.38This is discussed further in Chapter 6.
Victoria and the ACT have banned new gas connections, and in other states (except WA) the full cost of a new connection must be paid upfront.
The federal and state governments are working together to electrify public, social, and Indigenous housing, but so far only 100,000 of Australia’s 450,000 social houses have been targeted.39DCCEEW (2025c), AIHW (2025). Only Victoria has minimum rental standards that cover gas appliance replacement, and discounts to encourage landlords to electrify and improve energy efficiency in rental properties.
Victoria and the ACT have good information resources available for consumers; other states do not.40For example, Victoria’s State Electricity Commission has launched a one-stop-shop info hub and marketplace for appliances, installers, and government rebate applications. The federal government has tried to encourage private sector finance products to support home upgrades, but data on the rollout is not public. Some states have finance available.
Reverse-cycle air conditioners have been brought into the energy performance regulatory framework, and heat pumps should be included by 1 July 2027. Cooktops remain unregulated.
The federal and state governments should increase their efforts in all the above areas. In particular, states that have not set dates and created roadmaps should do so.
Leaving the transition unmanaged does not preserve consumer choice
While governments continue to avoid setting clear direction, households will keep making long-term decisions, such as replacing gas appliances or connecting to gas networks, without understanding the long-term cost implications or even the likelihood of their gas network being decommissioned.41ECA (2025a).
Avoiding the issue also fails to acknowledge that nearly half of consumers do not have a realistic choice to get off gas. It is these consumers who will be left with higher energy bills in the name of preserving choice for the few who have deliberately opted to remain on gas.
If governments are concerned about consumer choice, they should make the choice real. Consumers who really want to use gas, despite the poor economics, should be nudged towards using LPG. This would mean they take full responsibility for their choice, by handling their own supply instead of relying on a network where their choice is cross-subsidised by those who can least afford it. And consumers who face barriers to exercising the choice to electrify should have those barriers removed.
2.2 Industry is more complex than households
Gas is used in a wide range of industries in Australia: as a feedstock in chemical production for products such as fertiliser and explosives, and providing heat for everything from metals refining and manufacturing to food-processing and paper production.
Most gas used in the industrial and mining sectors is consumed in gas and LNG production, non-ferrous metals refining (particularly alumina refining), chemicals production, and cement production. Most of this gas is used for heat; the exception is the chemicals sector where some of the gas is used as a feedstock (see Figure 2.4).42Feedstock refers to raw materials used for industrial processes. When gas is used as a feedstock, it means it is used for its molecules to create other products, not burned for energy.
Figure 2.4: A few sectors account for the majority of industrial gas use
PJ of gas consumption by sub-sector, 2023-24
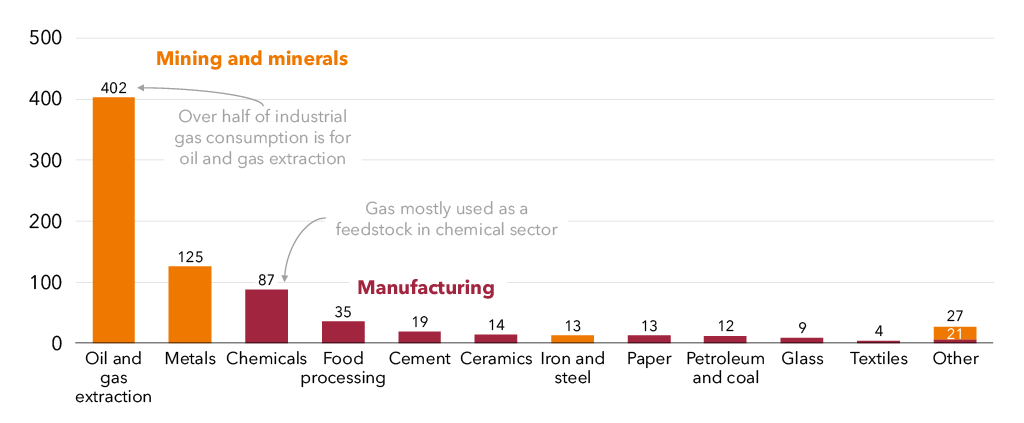
Notes: PJ = petajoules. Metals refers to metals other than iron and steel.
Sources: Grattan analysis of DCCEEW (2025b).
Industrial gas demand has been in broad decline since the early 2000s, dropping slightly faster than overall manufacturing energy usage.43DCCEEW (2025b).
This has largely been driven by a decline in manufacturing, from about 15 per cent of GDP in the 1970s to about 5 per cent today, as manufacturers close or move offshore for competitiveness reasons.44See, for example, Dyno Nobel (2021), Dyno Nobel (2025), Industrial Info Resources (2024), and S. Evans and Bleby (2025).
Gas substitutes vary across industries
Much of industrial gas consumption is used to generate low-temperature heat, which can be readily electrified. Up to 50 per cent of Australia’s current process heat market is less than 250°C, much of which is using gas. This suggests a sizeable potential for electrification of current processes.45Based on CSIRO’s analysis of the 2022-23 Australian Energy Statistics: CSIRO (2025).
For process heat below about 150°C — used in food processing, brewing, and light manufacturing — electric substitutes such as heat pumps and electric boilers are already available, and should become more competitive as capital costs fall, providing other barriers do not persist.46RACE for 2030 (2021).
Two other uses of gas are harder to abate – gas burned to generate high-temperature heat, and gas used as a chemical feedstock.
For higher-temperature (more than 250°C) processes in sectors such as cement and metals, electrification remains difficult, and a burnable fuel is usually required. But there are options: for example the AdBri Birkenhead cement plant in South Australia has been using progressively more waste-derived fuel over the past 23 years, replacing up to 50 per cent of gas use.47Boisvert (2026).
In the longer term, the substitute for gas for some users is likely to include biomethane or hydrogen. Much of the gas consumed in the chemicals sector is used for feedstock, not heat. Electrification cannot substitute for this directly; instead an alternative source of molecules is needed, and this is mostly likely to be low- or zero-emissions hydrogen.48Low-emissions hydrogen adds carbon capture and storage to traditional production. This removes about 60 per cent of the associated production emissions. Zero-emissions hydrogen uses 100 per cent renewable electricity to create hydrogen from water. Again, these substitutes are currently expensive to use, and not widely deployed.
There are one or two examples where industrial gas use may increase if gas substitutes for coal (see Box 2).
Box 2: Gas may still be a transition fuel for iron and steel
The large coal users in the industrial sector are the iron and steel, minerals processing, and cement sectors.aDCCEEW (2025b). One way to reduce, though not eliminate, emissions in these sectors is to use gas, instead of coal, for high-temperature heat.
Three factors will influence whether this happens: the relative price of coal versus gas (currently $5-$7/GJ for coal versus $13/GJ for gas); the cost of changing kilns and furnaces; and the availability and price of gas versus zero-carbon substitutes such as hydrogen or electro-smelting.bYCharts (2026) and AER (2025b).
If all Australian steel production switched from coal to gas, it would add to annual gas demand by 50 petajoules, and would approximately halve emissions at these facilities.cGrattan calculation based on Energy Transitions Commission (2023). Direct iron reduction using gas is more energy efficient than using coal.
Switching to using hydrogen has the same extra capital costs and operating costs, but higher fuel costs until hydrogen can match natural gas prices.
Iron and steel is one of the few areas where a coal-to-gas transition may still make sense, to allow time for zero-emissions alternatives to emerge. Switching from coal to gas in 2027 would only result in more emissions over 25 years than switching coal-to-hydrogen if hydrogen became available and competitive by 2038. This would require developing a hydrogen industry in 11 years that could supply 50 petajoules of hydrogen annually (500 times what is produced today) at a price substantially lower than it is today. This seems unlikely.
Reducing industrial gas use faster requires a comprehensive policy suite
As noted above, zero-emissions solutions for much of heavy industry are still developing to commercial scale. Industrial assets have long design lives – sometimes up to 40 or 50 years. The decision process to renew, refurbish, or retire an asset begins well before the end of its life, and future emissions get locked in at the design stage for a new or refurbished plant.49For example, in February 2021, BlueScope announced the beginning of a process to make decisions about a steel smelter which would reach the end of its design life somewhere between 2026 and 2030: Bluescope (2021).
At best, most Australian industrial facilities will have one chance to make a large investment that decarbonises their operations between now and 2050. If lower- or zero-emissions technology is not technically and commercially proven when asset renewal planning starts, a firm may choose not to replace the facility and it will close at the end of its life. If the firm does decide to replace it before zero-emissions technology is available, there is a risk it will do a like-for-like replacement of an old facility, or shift to a proven but still emissions-intensive process. None of these are an ideal outcome.
To prevent this, policies have to tackle two problems simultaneously:
- providing a stable long-term signal that emissions must be eliminated, creating technology pull; and
- providing short-to-medium-term assistance to share the risks of developing the solutions that will do so, creating technology push.
The federal government already has the building blocks for this push-and-pull approach, but it should use them more effectively.
The Safeguard Mechanism is not providing a strong enough signal
The Safeguard Mechanism (see Box 3) is the government’s policy to reduce emissions from the large industrial facilities over the long term.
But because it allows unlimited offsetting, and because the baseline decline rate is slow, the signal it sends is weak. At present, carbon credits cost about $36 per tonne of carbon dioxide50Demand Manager (2026). and facilities need only offset the equivalent of 14.4 per cent of their 2022 emissions.
This is an effective carbon price of about $5 per tonne of carbon dioxide. This is far too low to pull through solutions such as green steel or green ammonia, where the gap between traditional production and decarbonised production is more like $100 or more per tonne.51T. Wood et al (2023b).
The Safeguard Mechanism is due to be reviewed in 2026-27. The government should use this process to reform the Safeguard Mechanism to send a sharper signal to develop and deploy low- and zero-emissions industrial technology. This could involve limiting offsetting, increasing the rate of baseline decline, or both.
Box 3: How the Safeguard Mechanism works
The Safeguard was introduced by the Abbott government in 2015, and reformed by the Albanese government in 2022. It applies to any facility that emits more than 100,000 tonnes of carbon dioxide equivalent per year. This includes major industrial facilities, all LNG facilities, most coal mines, three airlines, and some rail freight companies.
Safeguard facilities are assigned a baseline level of emissions. If the facility emits above its baseline, it must surrender carbon credits to cover the difference.aThese can be Australian Carbon Credit Units (ACCUs) or credits purchased from other facilities that emit less than their baselines. If a facility emits below its baseline, it receives credits which it can then sell to other facilities, or save for the future. Facility baselines decline by 4.9 percentage points each year to 2030 and 3.285 percentage points after that.bIn 2024-25, 17 facilities had more generous decline rates of 1 percentage point per year, because they were trade-exposed.
There is no limit to the number of carbon credits that facilities can use to meet their obligations. Of the 207 facilities covered by the Safeguard, in the 2024-25 period, 143 facilities exceeded their baselines. This generated 13.7 million tonnes of carbon dioxide-equivalent above the allowed emissions, and therefore requiring an equivalent number of carbon credits to be surrendered.cCER (2025).
Targeted industry policy is also needed
As noted above, industrial facilities make large capital investments rarely. If new technology is still high-cost or risky at the renewal point, it will not be chosen over proven traditional approaches, even if the latter results in a long-term emissions liability.
For this reason, the government should establish financing facilities to risk-share with large industrial facilities at the point of machinery renewal, so that this renewal uses low-emissions technology.
Governments will need separate but complementary policies to address technology risk and financial risk.52Technology risk is uncertainty about whether a new technology will work. Financial risk is uncertainty about whether a technology can be commercially deployed. Technology risk is more suited to grant-style assistance, because removing technology risk creates positive spillovers (benefits extending beyond those who took the risk), and because the risk of failure is high. Addressing financial risk is more suited to a financial instrument, such as concessional loans.
The federal government already has a suite of policies aimed at industrial transformation including the National Reconstruction Fund, the Clean Energy Finance Corporation, the Powering the Regions Fund, the Net Zero Fund, Hydrogen Headstart and tax credits, the Green Iron Investment Fund, and the Future Made In Australia Innovation Fund. Much of this funding is sitting uncommitted. What is needed is not more money, but better co-ordination and targeting.
Much existing funding is targeted at sectors that need radical improvements in technology and economics to move away from gas. Substantial and long-term risk-sharing between the private sector and government is needed to help these sectors transform. But at present this support comes at the expense of other industries where technology is ready, but the economics are not – for example, the food and beverage and pulp and paper sectors, or alumina digestion.
Small emitters may need a different approach
There is also some gas use in facilities that are below the participation threshold for the Safeguard, such as food processing and paper manufacturing. This gas is mostly used for low-temperature heat, where electricity is a more realistic substitute.
These mid-tier firms are stuck with the worst of both worlds: they are large and complex enough to need bespoke solutions, but not big enough to have dedicated energy management expertise, fund their own R&D, or have easy access to capital.
Many of the ways in which these firms can electrify present risks on both capital costs and operating costs. But government support programs tend to be biased towards sharing capital cost risk, and towards larger projects that carry higher risks.
It may be administratively complex to expand the Safeguard to include smaller firms. Another option may be to use an upstream obligation to create the long-term signal to decarbonise without increasing the administrative burden. At the same time, these firms also need better access to risk-sharing assistance.
Designing detailed policies to reduce emissions, improve energy efficiency, and encourage electrification for smaller industrial emitters is beyond the scope of this report. But lack of policy in this sector is a persistent gap and one that should be filled.
2.3 Gas use for electricity is declining, but needs to be right-sized
Gas use in the electricity sector peaked in 2014, plateaued, and is now in decline. Most models of the future electricity system forecast that some gas will be used as back-up for a mostly-renewables system. But precisely how much gas-powered generation will be needed is difficult to forecast because there are so many uncertainties around future access to gas, emissions policy, and the attractiveness of alternatives.
Over the past nine years, the Australian Energy Market Operator’s forecasts of future gas demand for gas-powered generation have varied by up to 200 petajoules, though they are generally declining (see Figure 2.5). Last year’s forecast was that gas-powered generation would require nearly 200 petajoules in 2044, and this year that figure more than halved.
Figure 2.5: AEMO’s forecasts of future gas-powered generation vary widely
Successive yearly forecasts of east coast gas demand for electricity generation, PJ
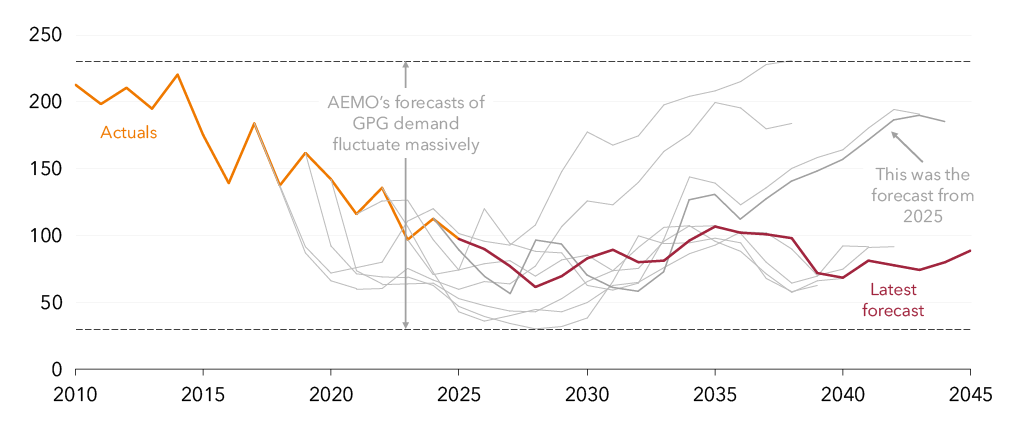
Notes: PJ = petajoules. AEMO = Australian Energy Market Operator. GPG = gas-powered generation. Forecasts are from base years of 2018 up to 2026.
Sources: Grattan analysis of AEMO Gas Statement of Opportunities, 2018 to 2026.
Until and unless other technologies can more affordably substitute its backstop function as a support during renewable droughts, gas-powered generation is likely to be essential to the safe running of the future power system. But getting the volume of gas-powered generation right depends on properly pricing the emissions impact of running gas-powered generation.
A carbon constraint in the electricity sector is essential to right-size gas-powered generation
To meet emissions-reduction targets, the electricity sector needs to reduce the amount of electricity coming from fossil fuels. Without a constraint on these emissions, coal generation will stay in the system for longer, renewables generation will be lower, and gas generation will be higher.
With a carbon constraint in place, renewables generation would grow faster, and gas output would be lower, because clean sources of dispatchable generation, such as pumped hydro and batteries, would take its place.
There are many ways that a constraint on carbon in the electricity sector could be designed. In our view, the most pragmatic option available to the federal government is to re-activate the Safeguard Mechanism to cover the electricity sector.53The Safeguard Mechanism already makes provision for the electricity sector, but this part of the legislation is currently inactive. We lay out the case for reactivating the Safeguard in more detail in Chapter 3 of Reeve et al (2025).
Our modelling shows that there would be less gas-powered generation in the National Electricity Market in coming decades under a reformed Safeguard Mechanism (Figure 2.6). Gas is still present, and playing the important role of backing up the system when renewables and storage are not sufficient. But, because it is paying for the climate damage caused by its emissions, its role is limited to the times when it is strictly necessary. With emissions properly priced, other sources of dispatchable generation, such as pumped hydro, deliver an increased share of generation.
Figure 2.6: Without a carbon constraint in the electricity sector, gas takes a much higher share of the market for dispatchable generation
Index of pumped hydro and gas-powered generation output, with and without an emissions constraint, 1 = 2025 output
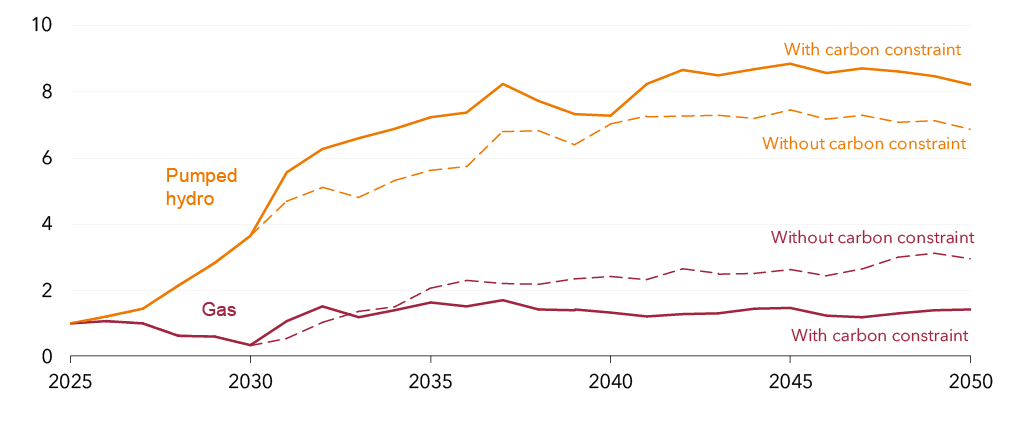
Notes: Carbon constraint applied from 2030, consistent with an emissions budget where Australia meets its 2030 and 2050 emissions-reduction targets, and meeting the reliability standard. For full details see Appendix B of Reeve et al (2025).
Sources: Jacobs for Grattan, Reeve et al (ibid).
Importantly, our analysis also shows that the overall system cost is lower with a constraint in place than without one.54Ibid.
Recommendation 1:
Reduce demand for gas across the economy, with targeted policies across households, industry, and power generation:
– Set dates to phase out residential gas use.
– Remove barriers that many households face to electrification.
– Reform the Safeguard Mechanism to sharpen incentives for large industrial users of gas to reduce emissions.
– Better target existing industrial policy to reduce technology risk and financial risk for large industrial emitters.
– Fill the policy gap for small industrial facilities.
– Reactivate the Safeguard Mechanism in the electricity sector to accelerate power system decarbonisation.
3 Expand the renewable gas sectors
Renewable gases will be critical decarbonisation routes for some users of gas who will find it difficult to electrify. But both types of renewable gas – biomethane and hydrogen – face barriers to being used at any meaningful scale. Governments must accelerate their deployment.
Green hydrogen has benefited from government support to develop small-scale electrolysers, but no one is buying the gas. There are very few users of hydrogen today, and none seem likely to switch to green hydrogen at scale without significant further government support.
Switching a customer from methane to hydrogen involves large capital costs. But without a large buyer, green hydrogen will not grow. The federal government should focus on unlocking the first wave of big green hydrogen buyers by targeting production-side support to existing users of grey hydrogen to lower the cost of switching.
Biomethane faces the opposite problem. Thousands of businesses use methane everyday, so the market is there. But biomethane has not enjoyed the same level of support as hydrogen to develop production facilities. The government should accelerate support for biomethane production to reduce costs and de-risk private investment.
Once both industries are operating at small scale, the government should use demand- and supply-side measures to accelerate them. Instead of Victoria and NSW introducing separate renewable gas targets in 2027 as planned, there should be a single national scheme to drive demand for renewable gases.
And the federal government should remove broader barriers to renewable gases. For hydrogen, this means a relentless focus on lowering the cost of electricity, the biggest driver of green hydrogen costs. And biomethane producers will need a clear feedstock strategy, and support to compete against incumbent gas companies.
3.1 Renewable gases are still fledgling in Australia
There are few producers and even fewer users of green hydrogen
There are just 13 operating electrolysers in Australia today, with a collective green hydrogen production capacity of about 1,000 tonnes per year, about 0.1 petajoules.55CSIRO (2026).
The existing electrolysers are mostly for niche uses such as transport, and are remote from the major sources of potential long-term hydrogen demand. A further 10 electrolysers under construction have a capacity of about 4,600 tonnes per year, another 0.6 petajoules.
This compares to the federal government’s target to produce 60 petajoules of hydrogen by 2030, and 1,800 petajoules by 2050.56Hydrogen targets are set in tonnes: 0.5 million tonnes for 2030 and 15 million tonnes for 2050. We convert tonnes to joules using a conversion factor of 120 megajoules per kilogram of hydrogen. To hit these targets, Australia would need to increase hydrogen production 86-fold in the next four years, and 2,600-fold by 2050 (Figure 3.1).
Figure 3.1: Australia is a long way off track for renewable gas production
Annual production of green hydrogen and biomethane, PJ
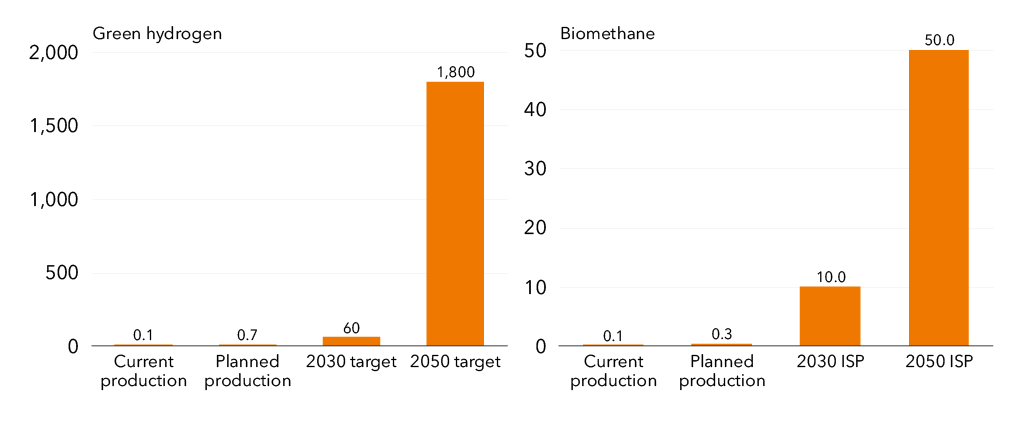
Notes: PJ = petajoules. ‘Planned production’ refers to electrolysers under development for hydrogen and the planned Delorean and Wasleys biomethane projects.
Sources: Current production is from CSIRO (2026). Green hydrogen targets are from DCCEEW (2022) and biomethane targets are from AEMO (2025b).
Biomethane is also a tiny sector, with just one producer
Biomethane is even smaller, with just one operational production facility – Jemena’s Malabar facility in NSW, which produces 95 terajoules (0.095 petajoules) per year.57Jemena (2026).
Australia today has about 250 anaerobic digesters, producing biogas from decomposing organic matter.58Biogas, a mixture of methane and carbon dioxide, is the gas produced from anaerobic digestion of organic matter. Biomethane is produced by ‘upgrading’ biogas (removing the carbon dioxide). These digesters produce about 20 petajoules of biogas each year, about 1.5 per cent of Australia’s gas demand.59IEA (2024a).
Malabar is the only one of these that upgrades its biogas into biomethane. This is despite the biomethane production process being a mature technology – Europe alone has more than 1,600 grid-connected biomethane digesters.60EBA (2025a).
A small pipeline of new biomethane projects is starting to emerge in Australia:
- The Delorean project in Adelaide will process food waste to inject up to 210 terajoules of biomethane a year into the gas network.
- The Wasleys piggery, also in Adelaide, will process pig effluent to inject up to 40 terajoules of biomethane a year into the gas network.
- A much larger facility, Kalfresh, is under construction in Queensland and will process agricultural waste to generate electricity in a gas peaking plant.
But these projects are mostly sub-scale demonstration plants, not yet the signs of an industry taking off, and well short of the volumes that would play a meaningful role in the energy transition.
This is concerning, because biomethane is likely to be an important route to decarbonising hard-to-electrify gas applications at least cost. The Integrated System Plan assumes the availability of about 10 petajoules of biomethane by 2030 (which would require Australian production volumes to increase more than 100 times in the next four years) and 50 petajoules of biomethane by 2050 (which would require production volumes to increase more than 500 times over 24 years).61See Figure 20 in AEMO 2025b.
The global biomethane market is growing fast – in the past three years, the US has expanded production capacity by an average of 16 per cent a year62Wood McKenzie (2025b). and the EU by an average of 20 per cent.63EBA (2025b). The Australian biomethane sector would need to grow much faster than this to play a meaningful role in the gas economy.
The long-term outlook for biomethane production potential in Australia is highly uncertain. A report for Energy Networks Australia estimated that Australia has the potential to produce 400 petajoules of biomethane each year.64Blunomy (2025). Yet global biomethane production volumes in 2023 were just 295 petajoules.652023 is the most recent data available at IEA (2025a). Two things are clear about Australia’s biomethane sector – first that a material volume of biomethane will be essential to achieving net zero at least cost, and second, that on current trends, Australia will not deliver biomethane in anywhere near the volumes required.
3.2 Industry policy should do four things to help these sectors grow
Australia grew the renewable electricity sector to the size it is today by using sequenced industry policy that provided different support as the sector grew:
- Technology-specific support, typically through grants to deploy first-of-a-kind demonstration projects.
- Supply-side support, to increase production to a minimum viable amount to support an industry. This was usually delivered as larger grants or loans through bodies such as the Clean Energy Finance Corporation.
- Demand-side support, in the form of a target and tradeable certificate schemes, with an obligation on large businesses to purchase certificates from producers.
- Further support if needed to maintain growth, such as an ongoing de-risking mechanism to unlock private sector investment (for example through contracts for difference), or the provision of common infrastructure.
Neither hydrogen nor biomethane has enjoyed this kind of systematic support. For hydrogen, government policy tried to leap to stage 4 (ongoing de-risking) while stages 1 and 2 were still playing out. For biomethane, government policy has generally been lacking across the board. For both gases, state-based renewable gas targets are now proposed to come in from 2027, which is too soon, because neither sector has reached minimum viable scale.
Industry policy for both gases needs a reset.
3.3 Hydrogen policy moved too fast for a nascent industry
Policies aimed at growing the green hydrogen sector have not been coordinated across the federal and state governments, and have so far been unsuccessful in stimulating the development of scaled electrolysis capable of producing green hydrogen in volumes and at prices that represent a viable decarbonisation pathway.
To date, the Australian Renewable Energy Agency has provided $361 million in grants to 69 projects related to hydrogen. This funding has overwhelmingly gone to small-scale hydrogen production projects.66ARENA (2026).
More recently, the federal government has announced two policies aimed at stimulating large-scale hydrogen production:
- Hydrogen Headstart – a $2.4 billion fund to provide revenue support to large hydrogen producers equivalent to the difference between the cost of production and the market price.
- The Hydrogen Production Tax Incentive – a refundable tax offset of $2 per kilogram of hydrogen.
To date, Hydrogen Headstart has announced funding for two projects, neither of which is yet operational. One is Orica’s Kooragang Island explosives factory in Newcastle, which currently consumes nearly 10 petajoules of grey hydrogen per year (see Figure 3.2). The electrolyser will produce 0.5 petajoules of green hydrogen per year, and represents the first case of grey-to-green hydrogen switching in Australia.67The second project, the Murchison Green Hydrogen Project in WA, is for export ammonia, so does not displace existing grey hydrogen consumption in Australia. The recipients of the second round of Hydrogen Headstart funding are set to be announced at the end of 2026, and the hydrogen tax incentive does not commence until 2027.68In the 2026 budget, the Federal government reduced the funding available under Round 2 of Hydrogen Headstart by $1 billion and pushed back its forecasts of expenditure under the tax credit to reflect the slower than anticipated growth in the hydrogen sector.
Figure 3.2: Currently just 10 facilities in Australia use hydrogen, all of it grey
Annual hydrogen consumption, 2022, PJ
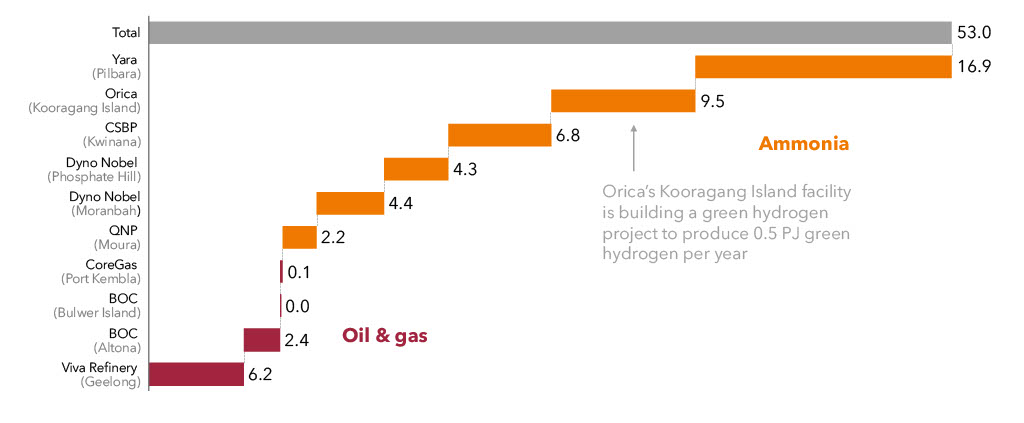
Notes: PJ = petajoules. Grey hydrogen refers to hydrogen produced from methane steam reforming. Estimates of hydrogen consumption at Ampol’s Lytton refinery are not available.
Source: Grattan analysis of DCCEEW (2022).
Despite the substantial commitment of funds, most have yet to be disbursed, and progress on large-scale hydrogen projects has largely stalled. A slew of major projects have been cancelled in recent years:
- In October 2024, Origin Energy withdrew from a partnership with Orica to build the country’s largest hydrogen production plant, in the Hunter Valley, citing the high cost of hydrogen.69Origin Energy (2024).
- In July 2024, Fortescue Future Industries cancelled its plan to build a hydrogen production plant at the site of AGL’s old Liddell coal mine in NSW, stating it was prioritising other hydrogen opportunities.70Murphy and Condon (2024).
- In May 2025, the South Australian government cancelled its plans to build a hydrogen electrolyser in Whyalla, citing delays in the local steelworks’ plans to use hydrogen for steel-making.71MacLennan (2025).
- In July 2025, Stanwell cancelled its plans to build the $12.5 billion CQ-H2 hydrogen production plant in Gladstone, Queensland, after the new state government withdrew funding for the project.72Hines (2025).
Production-side support should focus on existing users of grey hydrogen
There are two potential groups of buyers of green hydrogen: businesses that already use hydrogen, and businesses that would switch from methane. Each face different barriers.
Today, just 10 facilities in Australia use hydrogen, all of it grey and produced onsite, most of it used for ammonia production (see Figure 3.2). Collectively, they use 53 petajoules of hydrogen per year, about 440,000 tonnes – a similar volume to the federal government’s 2030 green hydrogen target (60 petajoules, 500,000 tonnes).73Two further facilities – the Kurri Kurri power station in the Hunter Valley and the Tallawarra B power station south of Sydney – are also hydrogen-ready (their equipment is capable of burning some share of hydrogen).
These businesses are the obvious place to look for early buyers of green hydrogen, because these facilities are already set up to use hydrogen. But to switch from producing grey to green hydrogen would still involve costly upgrades at each facility.
This is where production-side support should focus – switching these 10 existing hydrogen users to green by replacing their steam methane reformers with large electrolysers.
Currently, the cost of green hydrogen is about $63 per gigajoule versus approximately $12 per gigajoule for fossil methane.74Monaghan (2024). So production-side support should help to bridge that gap for these businesses. With a $50 per gigajoule cost gap, the two rounds of Hydrogen Headstart could unlock production of about 370,000 tonnes of hydrogen – enough to meet about 84 per cent of hydrogen demand for all current users of grey hydrogen in Australia for one year.75Based on $1.25 billion already allocated Hydrogen Headstart Round 1, and $1 billion allocated for Round 2.
At this scale, Headstart should support the small-scale facilities needed to scale up. Further rounds of Hydrogen Headstart may be required for larger entities later on, which could be funded by restructuring the Hydrogen Production Tax Incentive.76The hydrogen sector is not currently at sufficient scale to benefit from the tax credit. A tax credit benefits large, sophisticated businesses that are making profits.
Longer term, the federal government should ensure its broader industry policy settings support the use of hydrogen in industries where it is a viable replacement for coal and natural gas; such as iron-making and alumina refining.
This will require demand-side support, because the processes to refine ores will need to change to use hydrogen instead. These industries will also require much larger volumes – for example, maintaining current steel production using hydrogen would require around 50 petajoules of hydrogen annually. And they will also need integration with broader energy infrastructure development, because additional electricity will also be needed.
3.4 Biomethane needs production-side support to grow
Unlike green hydrogen, which is nascent globally, we have clear blueprints from overseas about how to scale up the use of biomethane. Several countries have successfully developed meaningful biomethane sectors through targeted policy. For example:
- Italy had essentially no biomethane industry in 2018. As of 2023, through feed-in tariffs and capital grants, it had about 133 biomethane plants, producing 28 petajoules a year, with substantial further growth planned by 2030.77Yarnold et al (2025).
- Denmark established a biomethane sector in 2014, and by 2024 produced about 27 petajoules per year, about 40 per cent of its total gas demand. Denmark deployed both production-side support (through feed-in tariffs) and demand-side support (through a biomethane blending obligation on gas providers).78ibid.
In Australia, though, early-stage technology support for biomethane has been almost non-existent. The Australian Renewable Energy Agency (ARENA) has supported just three biomethane projects with about $60 million in grants.79Malabar (Sydney), Delorean (Adelaide) and Wasleys (Adelaide). This should be accelerated: the federal government should ask ARENA and the Clean Energy Finance Corporation to drive development of demonstration and commercial pilot plants.
These investments should be expanded to cover more feedstocks, locations, and types of producers. The goal should be to establish replicable models for biomethane production.80There is no technology support needed on the demand side, because appliances and equipment that use fossil methane require no modifications to use biomethane.
The federal government should also ask Treasury to conduct a ‘sector assessment’ of biomethane to determine whether it should be designated as a strategic priority sector under the net zero stream of the Future Made in Australia (FMIA) framework. Under the FMIA framework, strategic priority sectors receive access to specific sources of public investment such as production tax credits, ARENA funding, and investments from Export Finance Australia.
To qualify under the net zero stream, biomethane would need to demonstrate a sustained comparative advantage for Australia in a net-zero global economy, and that public investment is required for the sector to grow. Currently, hydrogen is a strategic priority sector, but biomethane is not. Treasury should carefully assess whether biomethane meets these criteria.
3.5 Drive demand for renewable gases with targeted obligations
Targeted support to establish green hydrogen demand in existing users of grey hydrogen, and to develop a fleet of biomethane producers, is the first step to creating a bigger industry. Once the sector has a foothold, the federal government should accelerate its growth by stimulating demand through targeted renewable gas obligations on large gas users.
Australian governments have deep experience in using demand-side schemes as an instrument of industry policy. The Renewable Energy Target, for example, was pivotal in driving demand for large-scale renewable energy in the first two decades of the millennium, and the Small-Scale Renewable Energy Scheme has proven similarly effective in driving rooftop solar and more recently home batteries.
Two states have now announced their own schemes to drive demand for green hydrogen and biomethane:
- The NSW Renewable Fuel Scheme, which will begin on 1 January 2027, is a certificate scheme aimed at encouraging green hydrogen and biomethane development. It has an initial target of 0.18 petajoules of green hydrogen in 2027, rising to 8 petajoules of green hydrogen and biomethane by 2032. Gas retailers and large industrial users will be required to buy certificates equivalent to their share of the production target.
- The Victorian Renewable Gas Target, also slated to begin in 2027,81Despite being flagged to commence in 2027, the Victorian government has not yet provided a final design or draft legislation for the scheme, so the 2027 date may be delayed. is also a certificate scheme to drive green hydrogen and biomethane, specifically for gas-powered generation and industrial uses. It is likely to have a target of 1 petajoule by 2030 and 4.5 petajoules by 2035, which would be the equivalent of 6 per cent of Victorian industrial and gas-powered generation demand.
In August 2025, the Energy and Climate Change Ministerial Council committed to developing a national renewable gas policy. Clearly, having two separate schemes for the two largest state economies, and a national scheme, is not ideal.
The federal government should introduce a national demand-side obligation for renewable gases that is calibrated to drive separate growth rates for biomethane and hydrogen. The NSW and Victorian governments should fold their renewable gas targets into the national scheme. And if the federal government does not introduce its own, then NSW and Victoria should adopt a single framework so that obligation holders only have to comply with one obligation, not two.
Given the currently low volumes of biomethane and hydrogen production, demand-side obligations should initially be set low, increasing over time.
Box 4: How would a renewable gas obligation work?
A national renewable gas obligation should require large gas users to purchase Renewable Gas Guarantee of Origin (RGGO) certificates, issued to certify the emissions value of biomethane and hydrogen. Currently, RGGOs just support a voluntary market. The Malabar facility in NSW is the only facility in Australia receiving RGGOs for biomethane.
An obligation on large users of gas to buy RGGOs would drive up demand, and therefore prices, creating a bankable revenue stream for renewable gas producers, and accelerating the growth of the sector.
Three groups of gas users are obvious candidates to hold these obligations: LNG exporters, large industrial facilities such as fertiliser and explosives factories, and gas-powered generators for whom biomethane blending would be technically straightforward.
A small obligation spread across these users would be relatively easy to absorb, initially costing about $15 million per petajoule.aAssumes a biomethane cost of $25/GJ versus a natural gas price of $10/GJ. Spread across a number of large gas users, for a small number of petajoules, this would be an inconsequential cost to the obligation holders, but transformative for the biomethane sector.
The size of the obligation could be ratcheted up over time, and as biomethane costs decline, the incremental cost per gigajoule compared to natural gas would reduce.
A demand-side obligation based on purchasing RGGOs would provide the flexibility to obligation holders to either directly consume the biomethane or sell it to other gas users closer to where it is produced.
3.6 Governments should remove other barriers
Starting out small will also make it challenging for biomethane to participate in gas markets.
Trading gas in AEMO-administered markets such as the Wallumbilla hub in Queensland or spot markets in the capital cities involves fixed entry costs, minimum bid sizes, and sometimes complex settlements. AEMO runs a separate market for spare pipeline capacity, which again has separate processes and costs. Participating in a complex market designed for large players will not be easy for biomethane producers.
The federal government is preparing a suite of competition reforms to the gas market following a comprehensive review in 2025. In implementing these reforms, the government should consider how its planned reforms enable the participation of biomethane producers.
For biomethane to be injected into the pipeline network, producers need a connection agreement with the pipeline operator and must demonstrate they have met the Australian standard for biomethane. Producers may need to negotiate with multiple pipeline operators. And there is no legal right to connect to the gas network for biomethane producers. Energy Ministers should work on standardised connection agreements for biomethane producers to lower this barrier to entry.
Lastly, the government should give clear guidance on the availability of feedstocks. The federal government is preparing a National Biofuel Feedstock Strategy to coordinate the development of feedstock supplies across sectors. This strategy should clarify which feedstocks will be available for biomethane production, as opposed to alternative biofuels such as biodiesel, bioplastics, sustainable aviation fuels, etc.
The government should align this strategy with support for biomethane through the Australian Renewable Energy Agency, the Clean Energy Finance Corporation, the proposed demand-side obligation, and any other government support.
The biggest determinant of the cost of green hydrogen is the cost of the electricity used to produce it. Green hydrogen is unlikely to be viable at scale unless the cost of electricity declines substantially.
To lower the cost of power, governments should accelerate the deployment of renewables and electricity transmission, follow through on environmental approvals and planning reform, and drive more value from existing investments by increasing flexible demand.82T. Wood et al (2023b).
Recommendation 2:
Accelerate growth of the biomethane and green hydrogen sectors:
– Restructure financial support for hydrogen to focus more on smaller grants and loans. Funding could be repurposed from the hydrogen production tax incentive.
– Target initial green hydrogen deployment in sectors that have the lowest barriers to adoption to build scale.
– Increase support through the Australian Renewable Energy Agency and the Clean Energy Finance Corporation to biomethane producers.
– Require the federal Treasury to conduct a sector assessment of biomethane to determine if it should be designated a strategic priority sector under the Future Made in Australia framework.
– Replace the NSW and Victorian renewable gas targets with a single, national scheme to slowly increase demand for renewable gases by placing a small obligation on the largest users of gas.
– Use the ongoing federal Gas Market Review to ensure biomethane producers can participate on a level playing field in the gas market.
– Improve the economics of green hydrogen by relentlessly pursuing the efficient rollout of renewables and storage to drive down the cost of electricity.
4 Safely phase out gas distribution networks
As demand for gas falls, utilisation of gas pipelines will decline. Under the current rules that govern gas distribution networks, declining demand will push up prices for remaining customers, and leave large parts of the network stranded. Without action, gas distribution network companies are at risk of collapse.
Distribution network regulation was designed for a growing gas market. It must be reformed to accommodate a shrinking gas market.
Network owners should be required to develop transition plans outlining how they will manage their networks until residential gas is phased out. These plans should outline which parts of the network will still be required, and for how long. This will allow households and businesses to make informed decisions about when to switch their appliances.
To enable networks to be retired safely, the federal government should coordinate development of national decommissioning standards.
From now on, new expenditure on gas networks should be limited to winding down the networks or essential maintenance.
Remaining costs of the gas network should be shared between consumers, industry, and governments in a new grand bargain.
Consumers should be required to pay to leave the network. Network owners should be allowed to depreciate their assets within their remaining useful life, but only up to a point, with remaining network value written down and the costs shared between networks and governments.
And network owners should pay for decommissioning via industry levies, held in funds by state governments, and paid to network owners upon decommissioning. To stop network owners passing on costs to consumers, the levies should be excluded from the asset base.
4.1 How gas pipelines are regulated today
Gas pipelines deliver gas from where it is produced to where it is needed. Transmission pipelines are long-distance, high-pressure pipelines connecting gas fields to demand centres. Distribution networks are lower-pressure pipes distributing gas to customers in towns and cities.
There are 16,000km of transmission pipelines and many more kilometres of distribution networks in Australia. This chapter deals with distribution networks only, because they face different challenges than transmission pipelines from declining demand.
Distribution networks in Australia are privately owned. They are regulated by the Australian Energy Regulator on the east coast and the Economic Regulation Authority on the west coast.
Most distribution networks in Australia are subject to light-touch regulation; their operators must publish reference tariffs and terms and conditions on a public register, but they are not subject to price regulation and they do not have regulated returns.
But in cases where the regulator determines that the network owner has market power, it regulates the returns they are able to make and the prices they can charge. For these regulated networks, every five years, the regulator sets an Access Arrangement which determines the regulated asset base (the value of the capital stock on which the owner earns a return), and the allowed rate of return.
Network owners then determine their tariffs, and the prices they will charge customers, in order to recoup their allowed rate of return based on a given forecast of demand over the period. The cost that consumers pay for gas is the total allowable revenue divided by the forecast consumption of gas (see Box 5).
This chapter mostly focuses on the eight distribution networks that are regulated in this way, which include all the distribution networks in Sydney, Melbourne, Perth, and Adelaide. There are a further 36 distribution networks not subject to full regulation, which are mostly in small regional towns, but also the city of Brisbane.
Box 5: How network owners get paid
For each five-year period, network owners receive either a price cap or a revenue cap, or some hybrid of the two. The choice of cap determines whether they are taking on the risk that actual demand is different from forecast demand.
– Price caps set limits on the amount networks can charge customers. Price caps place demand risk on network owners. If demand is lower than forecast, the network owner earns less than forecast. If demand is higher than forecast, the network owner earns more than forecast.
– Revenue caps set limits on the amount network owners can earn. Revenue caps place demand risk on customers. If demand is lower than forecast, network owners earn the same revenue, which means customers end up paying more for their gas. If demand is higher than expected, customers pay less.
– Hybrid caps use a combination of price and revenue caps, sharing the demand risk between network owners and customers.
Historically, gas distribution networks in Australia have operated under price caps. So their revenues have changed based on demand: if actual demand falls below forecast demand, the network owner is exposed to the shortfall.aAER (2025c).
Recently, the Australian Energy Regulator has started to apply a hybrid approach to varying gas tariffs. It has done this to reduce the incentive under price caps for gas networks to increase their gas volumes. This also transfers some risk to consumers.
4.2 Under the current rules, when demand declines it creates problems for customers and networks
This regulatory framework for distribution networks was designed for a growing gas market, and works well when demand increases over time. But it does not work well when demand is declining. Declining demand exposes gas users to the risk of spiralling costs, and network owners to the risk of stranded assets.
Consumers face the risk of spiralling costs
Falling gas demand means that the fixed costs of the distribution network fall onto a smaller number of users, pushing up the cost of gas for remaining users. This price increase in turn makes continued gas use less attractive compared to electrification, prompting more gas users to exit the network. This is often referred to as a death spiral.
Network charges make up about 40 per cent of a customer’s gas bill, so increases in network costs have a material impact on gas bills.83AER (2025c).
Modelling by the energy regulator suggests declining demand could push up customer bills by 100 per cent by 2035, and 600 per cent by 2050.84This modelling was done for the Jemena network, but similar results would apply to other parts of the gas network: AER (ibid). Similar analysis commissioned by the Australian Energy Market Commission (AEMC) found that customer bills could rise from about $2,400 in 2025 to $4,600 by 2045, suggesting that the point at which gas bills prompt a death spiral is between $2,700 and $2,900 a year.85See AEMC (2026). There is no single dollar figure that prompts a general death spiral – different households will have different price sensitivity and motivations for switching. Estimates of the average Australian gas bill vary. As customers leave the network, the risk of remaining customers facing spiralling costs is becoming urgent.
Residential electrification will push up costs for industrial gas users too
Declining demand from residential customers will have a disproportionate impact on network revenues, because network owners receive disproportionate revenue from residential customers.
This is in large part because network owners historically charged industrial customers differently from residential ones – industrial customers historically paid for their connection costs upfront, so their yearly tariffs reflect only ongoing network-wide costs.
By contrast, residential customers historically did not pay for their connection costs upfront, so their network tariffs reflect the cost of their connection capital (recovered over time), in addition to their share of network-wide ongoing costs.86From 1 October 2026, residential customers will pay connection costs upfront in all jurisdictions except WA. As a result, network owners draw disproportionate revenue from their residential customer base.
For example, the Jemena network serves about 1.5 million residential customers, 34,000 commercial customers, and just 400 industrial customers. Despite being just 0.03 per cent of the customer base, these 400 industrial customers consume more than half of all gas.87Dynamic Analysis (2024).
However, residential and commercial customers pay about 85 per cent of Jemena’s annual revenue. If residential demand declines by 80 per cent by 2045 (AEMO’s base case forecast), Jemena could lose 35 per cent of its gas volumes, but nearly 70 per cent of its revenue.
That would shift those costs onto the remaining residential, commercial, and industrial customers. This is likely to significantly increase the cost of gas for the remaining industrial customers, to the point of it being unviable.88Ibid. Alternatively, if raising prices for industrial customers would simply drive facilities to close, network owners may choose to weather the losses, and accept that their businesses will decline.
Network owners face the risk of stranded assets
As customers electrify and demand for gas declines, network owners may not be able to recoup the full value of their investments. This also creates the risk that network owners fail to invest in maintaining the network for as long as it is needed, or suddenly shut down parts of the network, which in turn harms customers.
These dynamics reinforce each other – the death spiral. As demand starts to decline, in order to recoup their costs over a shorter timeframe and from fewer customers, network owners may start increasing the prices they charge customers. This further increases the cost of gas to remaining customers on the gas network, thereby increasing the incentive for customers to switch off gas.
The customers remaining on the network are likely to be those with the least capacity to pay or to electrify – that is, renters, low-income households, and industry that does not have the option to electrify.
An imminent death spiral may prompt a network owner to decommission part of their pipeline network earlier than expected. This is a problem both for the owner (because their assets have become stranded; they do not get to recoup their costs), and for customers who remain on the network (who may face sudden loss of their fuel source).
There are three examples of gas distribution networks closing in Australia due to declining demand:89All three of these networks were unregulated distribution networks. This means they did not have an obligation to continue their operations. The owners of regulated networks currently do not have the option to shut down because they are required to provide gas to customers.
- In 2023, the Esperance Gas Distribution Company decommissioned the natural gas network in Esperance, WA, affecting 400 homes and businesses. The closure was initially announced with 6 months’ notice, but the closure date was deferred by a further 12 months. The WA government provided $10.5 million in support to affected gas customers, about $26,000 per customer.90Mercer (2024).
- In August 2025, Solstice Energy announced it would decommission the compressed natural gas network serving 10 regional Victorian towns by the end of 2026, affecting 1,100 customers. The Victorian government provided special exemptions and discounts to affected customers through the existing Solar Homes and Victorian Home Energy Upgrades programs.91Stephens and McGuinness (2025).
- In January 2026, ATCO Australia announced it would decommission the LPG network in Albany, WA, starting in late 2026, affecting 8,000 homes and businesses. In May, ATCO announced it was delaying the start of the closure by six months at the request of the WA government. The WA government provided $10.8 million in support, about $1,350 per customer.92Cook et al (2026).
4.3 How to regulate gas networks in decline
The regulation of gas distribution networks needs to be rewritten for a declining market. To manage declining demand, the policy and regulatory regime should do four things: define who must do what to retire the gas distribution network; identify which parts of the network will be needed for how long; limit expenditure to only what is necessary while the network still exists; and fairly allocate the remaining costs of the network, including decommissioning.
Much of the responsibility for gas network phase out sits with state governments. But a consistent approach across states will be smoother and fairer. Both levels of government will need to coordinate closely through the Energy and Climate Change Ministerial Council (the ECMC) to get this done.
4.4 Define who must do what to retire the gas network
The concept of decommissioning a gas distribution network is not defined in the National Gas Law, or anywhere else.
ECMC should develop national standards for decommissioning the gas distribution network which outline:
- Which equipment can be left in the ground under which circumstances
- Site remediation requirements
- Customer safety standard
- Clear responsibilities on gas networks, versus other parties
Governments should also estimate the costs. Decommissioning the distribution network will be a huge task – permanently capping millions of gas connections, removing hundreds of thousands of kilometres of gas pipelines (or filling them in with cement), and undertaking remediation works.93In practice, there is likely to be a range of methods for safe decommissioning, and some infrastructure could be left in the ground. Governments and safety regulators should learn from the early examples of network closures to determine safe and least-cost methods for future decommissioning.
Progressively retiring sections of the network will require operators to maintain pressurisation in the remaining network, potentially requiring new investment. The ECMC should commission a study to estimate the reasonable costs of decommissioning each distribution network, and periodically update the study.
The ECMC should also reform rules that currently prevent network owners from decommissioning their networks. Currently, customers in most jurisdictions have a right to connect to the gas network and network owners have no rights to disconnect a customer except under strict conditions such as non-payment or safety. Therefore, network owners are prevented from disconnecting customers due to the decommissioning of the network for commercial reasons. These rules will need to change to allow networks to operate safely and owners to stay solvent throughout the progressive decommissioning of the network.94These rules only apply to regulated distribution pipelines. Owners of unregulated distribution networks are able to disconnect customers, hence the three examples of distribution network closures were all unregulated networks.
4.5 Identify how long each part of the network will be needed
Currently, the uncertainty over gas demand means neither network owners nor regulators can identify which parts of the network could be decommissioned on what timeline, and which parts will need continued investment to remain operational while they are still needed.
Under the current model of declining but uncertain demand, networks will probably still cease to operate, but it will be on an unpredictable timeline which will be expensive. Governments should reduce this uncertainty in two ways.
First, as we argued in Chapter 2, governments should set phase-out dates for residential gas use. This would remove substantial uncertainty over the timing of the phase-out of the gas distribution network (it would not remove it entirely, because parts of the network would be retired earlier).
Second, governments should ask the Australian Energy Market Operator (AEMO) to develop detailed central gas demand scenarios to inform network planning. The pace of decommissioning depends on the rate and location of demand decline. The current regulatory model, of each individual network owner developing their own demand projection and submitting it to the energy regulator for approval, no longer makes sense because, in a declining market, forecasts of demand will need to be consistent across the various policy mechanisms which depend on gas demand.
The Gas Statement of Opportunities (GSOO), the Integrated System Plan (ISP), the triggers for AEMO’s gas supply powers, and the requirements of the gas reservation will all depend on a forecast of gas demand. Clearly, network owners should not be investing in infrastructure to meet gas demand that won’t be there. Similarly, the reservation should not be seeking to deliver gas to meet demand for parts of the gas networks that are being decommissioned. These disparate gas demand forecasts should now be integrated.
AEMO’s annual demand forecast in the GSOO should be expanded into a common set of 25-year demand scenarios to be used across the gas market. Individual networks will have different demand forecasts based on their customer base and jurisdictional policy. But these network demand forecasts should be consistent with the common demand forecast, not determined independently by the network owners themselves. At a minimum, the Australian Energy Regulator (AER) should be able to use the new AEMO scenarios to assess the credibility of network demand forecasts.
AEMO’s demand scenarios should break down supply volumes of natural gas, biomethane, and hydrogen, and the locations of that supply. It is likely there will be locations where gas network closures can be deferred, or where there will be continued demand for distribution networks beyond 2050 to transport renewable gas. In those cases, network owners should be able to continue those services.
But these are likely to be small parts of the network, and those projections of pipeline requirements should be based on forecast volumes of renewable gases arriving in the right place at the right time – not wishful thinking from profit-seeking monopoly businesses.95It is unlikely that renewable gases would drive demand for new distribution pipelines. Most hydrogen is unlikely to be transported in pipelines. Most biomethane is likely to be behind-the-meter or injected into existing transmission pipelines. And this gas will be for industrial uses, not residential.
AEMO’s scenarios for gas demand and the supply of renewable gases will reduce uncertainty around the pace and location of declining demand for the gas distribution network. Network owners should then be required to develop transition plans which outline:
- Localised demand forecasts for their network that are consistent with AEMO’s system-wide common demand forecast.
- Which parts of their network will be needed for how long; how they will maintain the network for as long as it is needed.
- How they will decommission the network by the phase-out date96Critically, the network owners, not AEMO, should be responsible for identifying network under-utilisation. Our model requires network demand forecasts to be consistent with other gas system planning instruments.
The transition plans would sit on top of the five-yearly Access Arrangement to provide a longer-term view of the economic lifetime of each part of the network. Each of the eight regulated distribution networks in Australia would then have between three and four Access Arrangement periods left before full decommissioning, depending on their phase-out dates.
These transition plans would allow network owners to identify in advance when parts of the network will be decommissioned. And if network owners can decide to disconnect customers, customers will need new protections.
Network owners should be required to give customers at least five years’ notice of disconnection, and they should publish planned decommissioning dates for all customers.97In March 2026, Germany introduced new rules requiring network owners to give customers 10 years’ notice of gas decommissioning. This would minimise the risk of customers investing in new gas appliances only to have the network decommissioned.
Even with five years’ notice, some households connected to the gas network will face unaffordable costs to electrify their appliances, and potentially upgrade the wiring of their homes. Governments will need to provide financial support to low-income households that cannot afford the upfront cost of electrification. Proper planning and timelines communicated in advance will reduce the need for government financing, which is another reason governments should take control of the gas phase-out, to minimise the cost.
4.6 Limit expenditure to only what is required
Expenditure between now and gas network phase-out should be limited to what is absolutely required to safely operate the network for as long as it is needed, and then to decommission it. This will require expenditure rules that govern Access Arrangements to be materially tightened.
Gas network owners continue to ask for, and receive permission for, substantial investment in networks. In the current Access Arrangement period, network owners have spent $3.3 billion in capital expenditure and $3.5 billion in operating expenditure on their networks.98This covers the period when Victoria and the ACT announced their residential gas phase-out policies. The energy regulator issued its final decision on the Victorian Access Arrangements in June 2023, before the partial ban on new gas connections was announced in July 2023. The regulator issued its final decision on the ACT Access Arrangement in April 2021, after the ACT government announced its policy to phase out residential gas by 2045. So while the ACT Access Arrangement reflects relevant policy, the Victorian one largely does not. In the most recent decision, in May 2025, the energy regulator approved nearly $700 million in capex and $1.1 billion in opex for Jemena.99AER (2025c).
But currently there is no clear framework for discerning what capital investments and operating expenditure are required to safely operate the network for as long as it is needed, versus capital investments that will not be needed under declining demand.
For instance, in Jemena’s Access Arrangement, the regulator rejected $50 million in capex that Jemena requested to replace gas meters, on the basis that replacing the meters may not be required under declining demand. But the regulator also rejected $79 million in proposed capex to fund the connection of biomethane facilities to the Jemena network.
The AEMC has proposed to address this in several ways.100AEMC (2026). The proposed rules would require network owners to:
- Consider how long-term demand trends should affect expenditure proposals (not just the current five-year Access Arrangement).
- Justify new capex based on forecast future (not current) demand.
- Stop spending money on advertising pipeline gas to new customers (which is currently allowed).
These proposed changes are a start but do not go far enough. They do not consider the possibility of decommissioning gas networks, either in part or in full, and they do not require new expenditure to be consistent with a path towards decommissioning.
To start with, network owners should stop growing their regulated capital base by connecting new customers to the gas network.
At a minimum, customers that do connect to the network should pay the full costs of doing so. Since 1 January 2025 in Victoria, and starting on 1 October 2026 in NSW, Queensland, South Australia, and the ACT, newly-connecting gas customers will need to pay cost-reflective connection charges upfront.101Even though the ACT has banned new gas connections, there are some limited circumstances where customers can still connect to the grid. In Victoria, the full ban on new residential and commercial gas connections does not start until 1 January 2027. These changes will remove connections capex from the regulated asset base, which account for about a third of all capex.
WA has no such rule. In its Access Arrangement for 2025 to 2029, ATCO (which owns the distribution network serving 800,000 customers from Perth to Mandurah) is expecting to connect 82,000 new households to the gas grid. If that happens, the costs of disconnecting those customers will be paid for by all WA gas customers. Increasing the asset base 25 years before it must be decommissioned simply makes the decommissioning and depreciation problem worse.
Proposals for new expenditure should be justified against network transition plans. And the energy regulator should approve only new spending required to decommission networks, or safely operate them until then. This should apply to all eight regulated distribution networks.102Our model is not a ban on all gas mains replacement, but network owners would be required to justify why mains replacement is a better option than electrification. Decisions on specific spending proposals would be a matter for the AER, based on clearly defined criteria.
4.7 Allocate costs fairly without causing a death spiral
There are three kinds of costs associated with a declining gas network to allocate: gas exit costs (to leave the network), network costs (to operate and maintain the network), and decommissioning costs (to retire the network). In what follows, we propose a ‘grand bargain’ between consumers, industry, and taxpayers to shoulder the costs of network phase-out across these three buckets.
A cross-cutting challenge in determining the allocation of costs across parties is that owners of regulated distribution networks can pass any costs back onto consumers by including costs in their regulated asset base. But some share of costs should be borne by network owners and their shareholders. To achieve this, any costs that governments decide should be borne by network owners will need to be excluded from the regulated asset base. This will require a change to the National Gas Law.
There is no easy way to allocate these costs and our proposal will have many critics. But ignoring the problem will not make it go away. It’s time to discuss who should pay.
Customers and network owners should share the cost of exiting the gas network
Customers choosing to leave the gas network typically have two options – disconnection (a temporary removal of the gas service) or abolishment (permanent removal of the gas meter). Costs vary by network, but temporary disconnection is much cheaper than permanent abolishment.
In Victoria, in 2023, the Australian Energy Regulator capped abolishment fees at $220, to remove the incentive for customers to opt for the cheaper but less safe disconnection option which leaves live but unused assets in place.103AER (2023). But with the cost to the network owner of gas abolishment sitting at about $1,200, the rest of the cost was socialised across all remaining gas users in the network.
The Jemena gas network in NSW adopted a similar approach, with customers paying $250 for abolishment and the remaining $1,200 in costs being recouped from remaining gas customers.104AER (2025d). Network owners in SA, WA, Queensland, and the ACT typically charge cost-reflective abolishment fees of about $1,000.
Socialising the costs of gas disconnection is inequitable – households that can afford to electrify are subsidised to do so by those households that cannot. In its 2023 decision to cap Victorian abolishment fees, the AER acknowledged that socialising disconnection fees was an ‘interim measure’ designed to address public safety concerns about live but unused gas pipelines, and that further work was needed to develop a ‘more sustainable solution’.105AER (2023).
In April 2026, the AEMC issued a new rule requiring customers leaving the gas network to pay cost-reflective charges, instead of the costs being socialised across gas users, and empowering the AER to approve the costs that networks charge for this service.106This new rule will apply to all regulated distribution networks, except in WA. The rule comes into effect at the start of each gas network’s next Access Arrangement period. To address the safety concerns of customers choosing the cheaper disconnection, the rule requires safety regulators to impose safety standards, and network owners to implement them.
The effect of the AEMC ruling is to shift abolishment costs onto the customers choosing to leave the gas network, and to increase the price that customers in NSW and Victoria will pay by about $1,000. This creates a significant financial barrier to electrification that many households will be unable to afford.
A better solution would be to keep abolishment fees capped but prevent the remaining costs from being socialised onto remaining gas users. This could be achieved by amending the rules on Access Arrangements to prevent network owners from including abolishment fees in their asset base for the calculation of regulated returns.
This model would essentially share the cost of leaving the gas network between households choosing to leave, and network owners, rather than other gas consumers. A 50:50 split between the exiting customer and the network owner would be a reasonable approach. Requiring network owners to pay a portion of the abolishment costs also creates an incentive for them to deliver abolishments at least cost.
Customers that are removed from the gas network by their distributor as part of network-driven decommissioning should not be charged for abolishment.
Network costs should be depreciated based on retirement deadlines – up to the death spiral point
Remaining costs of the network itself would typically be recouped through tariffs over the lifetime of the asset. However, to respond to the risk that their assets will become stranded, network owners have started to ask for, and receive permission from, the energy regulator to more quickly recoup the cost of their network, known as ‘accelerated depreciation’.107Depreciation is the amount that network owners recoup each year.
Gas pipeline networks are long-lived assets, and their owners expect to recoup costs over the useful life of the asset, up to 80 years. If demand is forecast to drop, the economic life (how long an asset is commercially viable) of a pipeline may be less than its technical life (how long it could feasibly operate for). Accelerated depreciation aligns an asset’s returns with its economic life, rather than its technical life.
In the most recent Access Arrangements, network owners requested a collective $913 million of accelerated depreciation, of which $533 million was approved.108AEMC (2026).
Accelerated depreciation increases the costs that customers must pay in the short- to medium-term. By reducing the stranded-asset risk, it also shifts cost and demand risk off network owners and onto consumers.109The AEMC argues that accelerated depreciation reduces the exposure of network assets to stranding risk but does not involve a transfer of costs and risks from network owners to consumers. It says that if demand wasn’t declining, consumers would have to pay the full costs of the network eventually. But this position is internally inconsistent – if accelerated depreciation reduces stranding risk, then by definition it shifts costs onto consumers. And accelerated depreciation is only used because demand is declining. Some consumer advocates oppose the use of accelerated depreciation on the basis that it increases bills for gas consumers in the short-term.110ECA (2025b).
But that is the point – to bring forward the date when network owners can recoup their investments. The National Gas Law entitles network owners to a reasonable opportunity to recoup their efficient costs.
If demand is declining and asset lives are shortening, depreciation schedules should to an extent reflect that.
And if governments impose phase-out dates for residential gas and interim five-year decommissioning plans – as we argue they should – there is a strong argument for network owners to be granted some accelerated depreciation to reflect these shorter asset lifetimes.
But accelerated depreciation alone cannot solve the problem of stranded-asset risk indefinitely because, as demand decline accelerates and depreciation increases, it pushes up bills and sparks the death spiral. Modelling commissioned by Energy Consumers Australia found that accelerated depreciation could increase bills:
- In the Jemena network in NSW by $130 over the 2026-to-2030 period and only reduce the regulated asset base by about 10 per cent in 2055111Dynamic Analysis, Turning Down the Gas.
- In the Multinet network in SA by $170 over the 2027-to-2031 period, and only reduce the regulated asset base by about 2.8 per cent by 2031112ENA (2026).
If accelerated depreciation pushes gas bills above the death spiral point, it will spark a chaotic decline in the gas networks that harms both consumers and network owners. It is in the interests of both that accelerated depreciation be used only within limits. In our view: some accelerated depreciation is justified on the basis that demand is declining and network owners should be given a reasonable opportunity to recoup their investments, and redundancy provisions are necessary on the basis that accelerated depreciation alone would drive an expensive, inequitable, and chaotic decline of the gas distribution network.
Accelerated depreciation should therefore be permitted as a tool to manage stranding risk up to the point where it would push gas bills unacceptably high.113Importantly, the ‘death spiral point’ is a theoretical construct, not a specific dollar figure beyond which customers will leave the gas network. Energy Consumers Australia argues that the death spiral point is not an ‘objectively discoverable price point that accelerated depreciation can be calibrated against’. ECA 2025b. While generally true, the rationale nonetheless holds that accelerated depreciation should be limited based on its likely impact on gas bills.
Then, if there are limits on accelerated depreciation, regulators should require network owners to write off parts of the network to remove them from the regulated asset base. The cost of redundant assets should be shared between network owners and state governments. Targeted redundancy measures act as an effective cap on gas bills by capping the size of the regulated asset base relative to the customer base.
State government should negotiate cost agreements with network owners in their states to share the cost of redundant assets. Some level of cost-sharing is both necessary and justified. It is necessary because if network owners were faced with the write-down of the vast bulk of their networks, the risk of financial collapse becomes acute.
It is justified because some of the network redundancy is driven by government policy. Costs of network redundancy borne by network owners will need to be removed from the regulated asset base.
Governments should pay network owners for decommissioning, but should recoup those costs from the sector
There are six possible parties to pay for network decommissioning costs – and all have downsides: forcing gas consumers to pay is unviable because it would quickly push bills above the death spiral point, and unfair because it would shift costs onto consumers who cannot electrify; forcing gas network owners to pay the entire cost risks sending them bankrupt, leaving both the cost and responsibility for decommissioning the network on government; forcing gas producers to pay would reflect that they have profited from this infrastructure historically but, since they do not own it, they don’t have responsibility for its decommissioning; forcing electricity consumers to pay is unfair because many electricity consumers have never been gas consumers, and it risks pushing up power bills materially; forcing electricity network owners to pay is also unfair because it transfers costs from gas network owners to electricity network owners; and forcing the government to pay is the easy way out, but essentially amounts to a subsidy for gas network owners to avoid remediation and decommissioning costs.
We propose a cost-sharing arrangement between industry and taxpayers through a set of state-based funds to reimburse network owners for their efficient decommissioning costs, paid for by hypothecated levies on the gas and electricity sectors:114In our model, consumers are already paying a share of phase-out costs by accepting accelerated depreciation of remaining network costs and by sharing the costs of gas abolishment. This is the consumer share of the grand bargain. state governments should establish funds to pay the costs of decommissioning the network in their respective states; money for the funds should come from a four-way cost-sharing arrangement between state governments, gas network owners (as the beneficiaries of the gas network), electricity network owners (as beneficiaries of electrification), and gas producers (as beneficiaries of the gas economy); funds should be raised from industry hypothecated levies or taxes; the rules governing Access Arrangements and electricity network determinations should be amended to explicitly clarify that levies paid by network owners to finance decommissioning cannot be included in the building block approach to revenue determinations, and therefore cannot be passed on to consumers; and if, based on the current fiscal environment, governments prefer a three-way cost-sharing arrangement with industry, they can choose to raise the entire amount from industry.
The size of the funds (and therefore the levies) should be based on the federal government’s estimate of the cost of network decommissioning. Network owners themselves should do the decommissioning, because it will happen in waves over the next 25 years, and because network owners are best-placed to manage progressive shut-downs safely.
Given costs will be incurred over the next 25-30 years, the levy can be modest. For example, raising $10 billion over 30 years would not be an unreasonable impost spread across the gas and electricity sectors.
And to ensure that gas network owners have an incentive to complete the decommissioning safely, state governments should require decommissioning bonds for each part of the network to be decommissioned under the transition plans. Over the next five years, network owners should be required to deposit bonds with their state governments – to be repaid upon successfully decommissioning each part of the network.115Network owners may be inclined to back-end their decommissioning, keeping the network as large as possible for as long as possible. Paying bonds to network owners upon successful decommissioning of parts of the network discourages delaying decommissioning. Similarly, requiring network planning to be based on central AEMO demand forecasts makes it harder to delay decommissioning.
Box 6: What if the distribution network owners hand back their licences?
One risk of declining gas demand and a phase-out of gas distribution networks is that if the networks become unprofitable, network owners may suddenly close their businesses, hand back their licences, and avoid expensive decommissioning costs. This would leave customers without access to gas, and governments with a hefty decommissioning bill.
There are two ways to mitigate this risk: establish financial incentives for decommissioning (through bonds) and establish trailing liabilities on network owners to ensure they cannot avoid financial and operational responsibilities by handing back their licence.
The owners of the major gas distribution networks in Australia all own many other assets in Australia, including the electricity networks. AusNet owns part of the Victorian gas network and also part of the Victorian electricity network. Jemena owns part of the NSW gas network and part of the Victoria electricity network. CK Infrastructure Holdings owns the SA gas network, part of the Brisbane and Victorian gas networks, part of the Victorian electricity network, and the entire SA electricity network. ATCO, which owns the WA gas distribution network, owns $27 billion of assets across Australia and the rest of the world.
The fact that all the gas networks are owned by the same companies as the electricity networks gives government a clear opportunity to establish trailing liabilities and ensure that taxpayers are not left with the clean-up bill.
4.8 Unregulated distribution networks should have the same decommissioning regulations
The majority of Australian gas customers are connected to regulated distribution networks. But many people are connected to one of the 28 unregulated networks which are not required to submit Access Arrangements that regulate their prices and returns.
These unregulated networks are mostly in regional cities such as Mildura in Victoria (900 customers), Alice Springs in the NT (1,100 customers), and Kalgoorlie in WA (7,500 customers).
Unregulated networks face the same risk of a death spiral as regulated ones, but regulators do not have the same tools available to manage their decline because the owners of unregulated networks are able to simply decide to shut down their networks. This means that thousands of regional Australians (and Brisbanites) are uniquely exposed to chaotic and expensive network closures.
To ensure an orderly transition for these regional communities, the owners of unregulated distribution networks should have the same decommissioning framework as regulated ones – they should be required to develop transition plans to progressively decommission the network and give customers five years’ notice of closure.
Recommendation 3
Reform the regulation and planning of gas distribution networks to enable and encourage the safe and progressive decommissioning of the networks as households electrify:
– Develop consistent national standards for decommissioning gas distribution networks, with clear roles and responsibilities and requirements for safety and site remediation.
– Repeal rules that require regulated networks to connect new customers to the network and that prevent networks from disconnecting customers.
– Introduce new 25-year common gas demand forecast scenarios to be used as the basis of all gas system planning. Require networks to reconcile their own network demand forecasts with the common forecast.
– Require gas networks to develop transition plans outlining how they intend to progressively retire their networks by the phase-out date.
– Restrict new expenditure by gas networks to only what is required to safely operate the network until phase-out.
– Allow networks to use accelerated depreciation only insofar as it does not increase gas bills.
– Progressively reduce the size of the regulated asset base by writing down redundant parts of the networks. Share this cost between networks and state governments.
– Levy charges on gas and electricity networks and gas producers to fund the cost of decommissioning. Reform network regulations to prevent networks passing through the remainder of the cost to gas and electricity consumers.
5 Finance and plan gas-powered generation differently
In the next two decades, the role of gas-powered generation in Australia’s electricity mix will change from being an everyday provider of bulk electricity to being a provider of backup firming capacity.
Annual gas use for gas-powered generation in the National Electricity Market (NEM) has fallen from 150 petajoules to less than 90 petajoules over the past five years.116AEMO (2026a). This is good news for emissions reduction. But the evolution of gas-powered generation from an everyday generator to a capacity provider creates two challenges.
The first is financial: how to secure investment in new gas-powered generation given the business case relies on increasingly rare periods of very high prices. A new long-term contracting framework to encourage investment is required. That framework should provide market signals for investment in dispatchable capacity that will run rarely. It should be technology-neutral, allowing gas generators to compete with alternative non-fossil capacity as long as emissions are priced.117An emissions constraint for the electricity sector is discussed in Chapter 2.
The second challenge is logistical: how to get the right volume of gas to the right places at the right times. The NEM is forecast to need 20-to-30 gas-powered generation plants by 2050. As demand for gas in other uses falls, making gas available on demand for a decentralised fleet of this size becomes difficult.
To date, it looks like the market is solving this by investing in transmission pipelines and gas storage. To facilitate continued investment, the Australian Energy Market Operator should develop detailed forecasts of where pipeline gas will be available for existing and new gas-powered generation.
5.1 The role of gas-powered generation is changing
Today, gas generates just four per cent of total electricity in the NEM, a tenth of renewables. However, it plays an essential role in supporting renewables. Gas generators can be turned on at short notice and do not face weather-related constraints like renewables do. So they are well-suited to a ‘firming’ role – generating power to meet spikes in demand, or in prolonged periods of low renewable output.
But this role is changing. As it changes, gas generators are facing new challenges that will require new policy responses.
This chapter largely focuses on the NEM. Australia’s second largest grid, covering Perth and surrounds, does not face the same challenges related to gas generation as the NEM. WA has a capacity market, so gas-powered generators have more certain revenues. And because most gas generators are located near the main gas transmission line, they do not face the same challenges of access to gas.118Australia has three other smaller grids: one covering Darwin and Katherine, one around Mt Isa, and one in the Pilbara. This report does not address challenges to gas generators in these grids.
Gas usage for gas-powered generation has been falling
Gas-powered generation output in the NEM peaked in 2014 and has been declining ever since (see Figure 5.1). The average daily gas-powered generation output has declined 61 per cent, from 2,109 gigawatt hours down to 691 gigawatt hours.119Open Electricity (2026).
Figure 5.1: Gas-powered generation is generating less electricity (top) and plants are running for fewer hours each year (bottom)
Top: Electricity generation from gas-powered generation, in TWh.
Bottom: Percent of the year gas-powered generation plants are running.
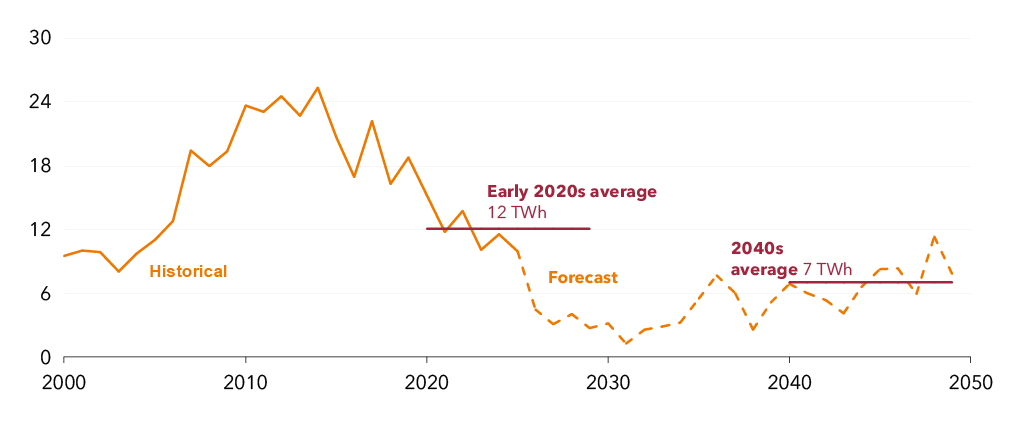
Source: Grattan analysis of Open Electricity (2026), AEMO (2025b).
Less gas-powered generation means less gas. Average daily use of gas for electricity declined from 622 terajoules in 2014 to 253 terajoules in 2025.120While overall gas-powered generation has declined a lot, peak day gas-powered generation output has declined much less, down by only 33 per cent, from 2,325 gigawatt hours to 1,553 gigawatt hours. This is important because peak day gas-powered generation demand matters for access to gas.
Gas-powered generation is likely to remain essential to the safe operation of the NEM and to achieving decarbonisation at lowest cost. But demand for gas for electricity generation is not likely to grow. The Australian Energy Market Operator (AEMO) forecasts that gas will generate an average of 7 terawatt hours a year in the 2040s, down from 12 terawatt hours a year in the 2020s so far.
Under AEMO’s Step Change scenario, output is forecast to drop significantly into the 2030s, before picking up again in the 2040s as renewables reach extremely high penetrations and overall power demand increases (see Figure 5.1).121AEMO produces three different forecasts of future gas-powered generation. This forecast is from AEMO’s capacity outlook model. AEMO’s separate sequential model forecasts gas consumption for gas-powered generation in petajoules for the Integrated System Plan and the Gas Statement of Opportunities. These time-sequential model forecasts imply slightly higher volumes of gas-powered generation than the capacity outlook model. We have used the capacity outlook model because it is the only forecast of electricity output.
The role of individual gas-powered generation plants is also changing. In the 2010s, an individual gas peaker could expect to be switched on about 15 per cent of the time, and a mid-merit plant nearly 70 per cent of the time. Today, peakers are running just 5 per cent of the time and mid-merit plants about 20 per cent of the time (see Figure 5.1).
This trend, of gas-powered generation plants mostly sitting idle, is likely to continue. Over the next 20 years, the utilisation for peaking plants is forecast to be just three per cent – an average of just 11 days a year.122Grattan analysis of Open Electricity (2026).
Batteries are eating into the traditional role of gas-powered generation
Gas-powered generation is running less because the electricity system has better alternatives that can respond faster, deliver cheaper power, are easier to build, and don’t rely on access to insecure gas supply.
Primarily, these alternatives are batteries.
The biggest uncertainty in how much gas-powered generation will be needed in the future is how big a role batteries will play. For example, residential batteries are being installed at four times the rate anticipated in AEMO’s Integrated System Plan modelling.123See Gordon (2026). In large part, AEMO’s underestimate of home battery deployment is due to the unexpected popularity of the federal Cheaper Home Battery scheme. Future AEMO forecasts will correct the underestimate and, when they do, the forecast of future gas-powered generation needs is likely to decrease.
Hundreds of thousands of small batteries across the grid reduce the need for gas-powered generation by smoothing demand peaks and providing an alternative source of dispatchable output at lower cost.
And big batteries are also rapidly pushing gas-powered generation out of its traditional role in providing evening peak power. Across the NEM and Western Australia’s Wholesale Electricity Market (the WEM), in the past year, the contribution of gas-powered generation to evening demand has declined by nearly 850 megawatts and the contribution of big batteries has increased by 1,400 megawatts (see Figure 5.2).
Figure 5.2: Across the NEM and the WEM, batteries have increased evening output by 1.4 GW while gas has declined by 850 MW in a year
Change in average output (MW) by time of day from Q1 2025 to Q1 2026
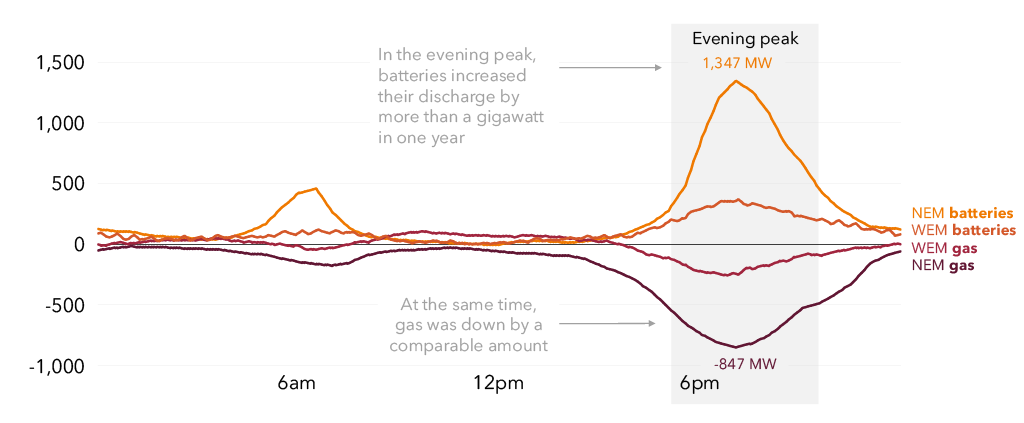
Notes: NEM = National Electricity Market. WEM = Wholesale Electricity Market in WA.. Source: Grattan analysis of AEMO (2026b).
Big batteries are running more often in the evening peaks, earning revenue that used to be won by gas-powered generation. In addition, batteries, rather than gas, are increasingly setting prices (see Figure 5.3).
Figure 5.3: Batteries, not gas, are increasingly setting morning and evening peak prices
Proportion of time as marginal price setter in the NEM, Q1 2025 compared to Q1 2026, gas-powered generation and batteries
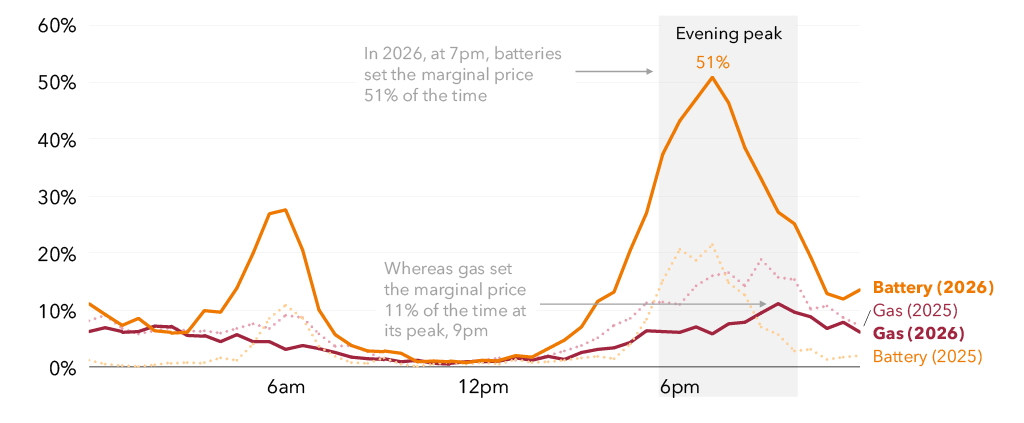
Source: Grattan analysis of AEMO (2026b).
This change is significant because setting prices has historically been central to the business model of gas-powered generation. Peaking plants typically earn disproportionate revenue during infrequent price spikes. If gas-powered generation can’t set prices, it gets harder to see the business case for gas-powered generation.
5.2 Current plans will not meet the need for new gas-powered generation capacity
Even though the NEM will need to run its gas-powered generation fleet less often, and that fleet will generate less power using less gas, the installed capacity of the gas-powered generation fleet is likely to be larger than it is today.
AEMO’s Integrated System Plan (ISP) suggests the NEM will need 15 gigawatts of gas-powered generation capacity by 2050 to meet Australia’s electricity needs at least cost.124Assuming the model is correct, delivering either more or less than 15 GW would result in higher system cost. We discuss in Section 6.2 whether 15 GW is the optimal amount of gas capacity. Most of the existing gas-powered generation fleet will be retired over the next 25 years.
As it is replaced, the type of gas generation will also shift from mostly ‘mid-merit’ gas generators, which run relatively often, towards ‘peaking’ gas generators, which run less frequently.
This means that the NEM will need 12 gigawatts of new gas-powered generation to be built to deliver the least-cost pathway. Based on the current retirement schedule of the existing gas-powered generation fleet, substantial investment in new gas-powered generation will be required from the 2040s (see Figure 5.4).
Figure 5.4: If the Integrated System Plan is correct, a lot of new flexible gas generators need to be built
GPG capacity under the ISP’s Step Change scenario, (GW)
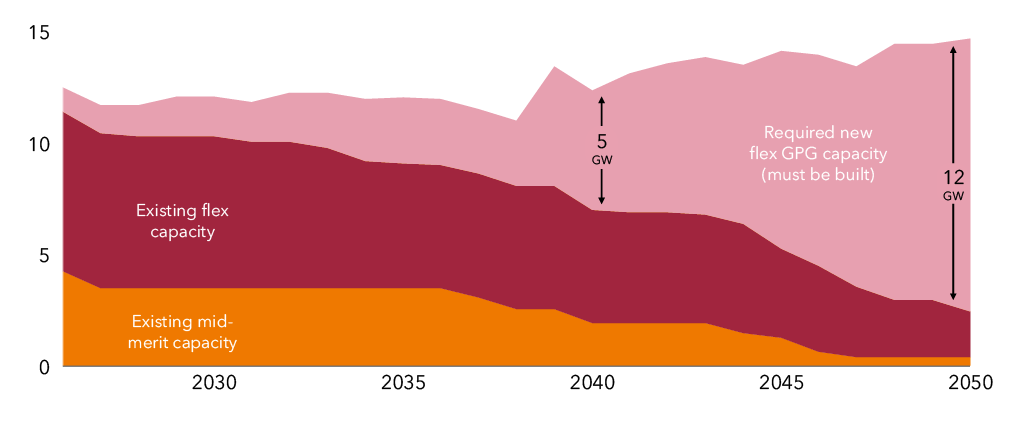
Notes: GPG = gas-powered generation. ISP = Integrated System Plan. GW = gigawatts. Years converted from financial to calendar, so 2025-26 appears at 2026.
Source: Grattan analysis of AEMO (2025b).
A typical large gas-powered generation plant is about 500 megawatts, so the NEM will require about 20 to 30 new, large gas-powered generation plants to be built over the next 25 years.
But there is little investment going into new gas-powered generation in the NEM. Over the past 18 months, AEMO has approved just three gas-powered generators in the NEM, and with a collective output capacity of 0.2 gigawatts, these are small power plants not capable of grid-scale firming. Over the same period, AEMO has approved nearly 22 gigawatts of new battery capacity for the NEM.125Data from AEMO 2026c which was published in 2026 and covers the period July 2024 to December 2025. Big batteries are being deployed 100 times faster than new gas-powered generation.
The most recent gas-powered generation peaking plant to open in the NEM was the Tallawarra B plant in NSW, a 320 megawatt plant owned by Energy Australia and opened in 2024. Since it opened, Tallawarra B has run just 3.8 per cent of the time (and not at all in the entire month of March 2026).126Open Electricity (2026).
Two gas-powered generation peaking plants, both government-owned, are due to open soon:
- The 660 megawatt Hunter Power Project, owned by Snowy Hydro, due to be commissioned in 2026.
- The 400 megawatt Kogan Creek Power Station in Queensland, owned by CS Energy, due to be commissioned in 2028.
Beyond these, there are no grid-scale firming gas power plants in the pipeline for the NEM.127AEMO (2026c). Given the existing fleet rarely runs, and given ongoing uncertainty about securing future gas supply for short but highly-priced operating windows, this is hardly surprising.
5.3 The NEM will need a new financing model for gas-powered generation
The NEM has a problem – gas-powered generation doesn’t seem attractive to invest in today, but the NEM will probably need more capacity in the future, to run just a few hours a year. Without that dispatchable capacity, we risk higher prices and lower reliability of power.
In the design of the NEM, the spot price of electricity acts as a signal for new investment. Historically, gas-powered generation plants could expect to run most of the time, set prices during peak periods, and earn disproportionate revenue during infrequent, high-priced events.
But these conditions are changing as gas-powered generation plants run less often, especially during the peaks, and set prices less frequently.
Generators that run so infrequently will struggle to attract finance because their returns are so uncertain. In some energy markets, dispatchable generation such as gas-powered generation attracts ‘capacity payments’ – revenue for being able to dispatch energy on-demand.128For example, the WA electricity system has a capacity market which pays generators for dispatchable capacity in addition to paying for the electricity they actually produce. These payments act as an insurance policy, ensuring that sufficient capacity is ready when needed, rather than only paying for energy generated.
In 2022, the Energy and Climate Change Ministerial Council considered reforming the NEM to create an additional market for capacity that could be dispatched at short notice to balance, or firm, the higher level of renewables. Some ministers objected to the idea that such a capacity market would act as a subsidy to coal and gas, and the proposal was rejected.129Durkin (2022).
In December 2025, the Nelson Review into wholesale electricity found that the NEM is failing to encourage sufficient investment in generation of all types, especially dispatchable capacity. The review proposed establishing an Electricity Services Entry Mechanism (ESEM) – a scheme to contract, among other things, firming services that could be provided by gas-powered generation or other sources of dispatchable capacity.
The intention is for legislation to be passed by the end of 2026.
But these reforms face a difficult passage. Legislation will require unanimous support from federal and state energy ministers. While the other states have given in-principle support to the Nelson Review’s recommendation to create the ESEM, Queensland has not. And support for the ESEM in industry is mixed.
All governments should support the ESEM. It should be designed in a way that allows gas-powered generation to compete with other forms of dispatchable capacity to provide firming services for the NEM. Emissions from gas-powered generation can be priced separately (we suggest through the Safeguard Mechanism, see Chapter 2).
If emissions are priced, and the value of dispatchable capacity is recognised through the ESEM, the NEM should be able to deliver the right level of gas-powered generation.
5.4 Gas-powered generation plants will need to access gas supply in new ways in the future
A gas-powered generation fleet that is larger, but used less often, will shift from requiring a relatively constant flow of moderate volumes of gas to requiring a large volume of gas over a short time.
AEMO’s forecast details a changing gas demand profile (see Figure 5.5):
- In 2026, peak gas demand for gas-powered generation in the NEM will be 1,029 terajoules per day and median demand will be 423 terajoules per day.
- In 2030, peak gas demand for gas-powered generation in the NEM will be 1,372 terajoules per day while median demand will be 345 terajoules per day.130These forecasts are based on 1-in-10-year peak electricity demand conditions, based on the 2020 observed weather year.
Figure 5.5: The gas-powered generation fleet of the future will run less on many days, but will have more days of very high demand
Daily gas consumption for GPG in the NEM, (TJ)
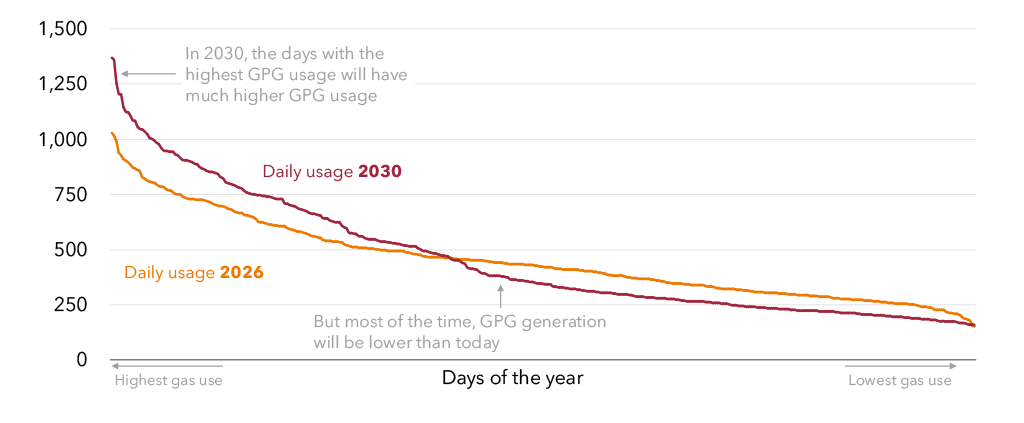
Notes: GPG = gas-powered generation. NEM = National Electricity Market. TJ = terajoules.
Source: Grattan analysis of AEMO (2026a).
This shift from frequent, low volumes to infrequent, high volumes is likely to require substantial new gas storage. Supplying the gas will be much more complex and expensive as other uses of gas decline. Gas-powered generation plants may face increasing difficulty accessing pipeline gas. Gas storage will be critical to ensuring reliable gas supply.
Storage works on both a short-term and seasonal timescale. Users might store excess gas in a given week for use later that week, or store surplus gas produced in summer for use during winter peaks or in preparation for unforeseen disruptions to other generation supply.
Pipelines can also be used for storage. Long-distance transmission pipelines in particular can hold large volumes of gas. This ‘linepack’ gas acts as a buffer between supply and demand.
There are 10 major gas storage facilities on Australia’s east coast, but of these only 7 are able to meaningfully support gas-powered generation.131The others – Moomba in South Australia, and Roma and Silver Springs in Queensland – are constrained by their capacity, location, or the rate at which gas can be withdrawn. Of these, 3 are dedicated storage facilities:
- Iona near Port Campbell in Victoria stores gas on behalf of large users and is used to boost winter gas supply to Victoria and South Australia. It has a capacity of about 24 petajoules, and can be filled up quickly at about 155 terajoules per day, but can be emptied even faster, at 570 terajoules per day. This makes it extremely valuable in supplying bulk gas quickly.
- Newcastle is an LNG storage facility in NSW used by AGL to ensure supply for its gas-powered generation plants during winter peak demand. The facility can be filled relatively slowly at a rate of 10 terajoules per day, and discharge much faster at about 120 terajoules per day. It can store 1.6 petajoules of gas.
- Dandenong is a small LNG storage facility in Melbourne that provides peak day gas. It has a capacity of just 0.7 petajoules, and can support the Newport gas power station in Melbourne. Like Newcastle, it fills up relatively slowly because it must liquefy the gas to LNG before it can be stored.
The other four are gas transmission pipelines, each supplying a gas power station, that store relatively small volumes of gas as linepack:
- The Colongra pipeline, owned by Snowy Hydro, is a 9km transmission pipeline supplying Snowy Hydro’s Colongra power station in NSW. It has a capacity of 43 terajoules, enough to supply the station for five hours at full capacity.
- The Kurri Kurri Lateral pipeline, owned by APA, is a 24km storage pipeline that provides gas to the Hunter Power Project in NSW. It has a capacity of 70 terajoules.
- The Mortlake pipeline, owned by APA, is an 83km transmission pipeline connecting Origin’s Mortlake power station in Victoria to the Iona storage facility. It has a capacity of 150 terajoules.
- The Braemar pipeline, owned by Alinta, is a 150km transmission pipeline that provides gas to the Braemar power station in Queensland.132The capacity of the Braemar pipeline is not available.
Of these, AEMO only explicitly models storage facilities that offer storage services to third parties on the market – Kurri Kurri, Iona, Newcastle, and Dandenong. The others – Braemar, Mortlake, and Colongra – are privately owned and do not inject gas into the network, they only supply their own stations. AEMO’s gas supply forecasts assume these ‘non-market’ gas stores are available when needed.
These seven existing storage facilities do not provide enough gas storage to meet forecast daily demand peaks. AEMO’s latest forecast suggests these facilities will not be able to meet southern demand by 2029 (see Figure 5.6). These forecasts are probably underestimates because they do not account for depletion of storage facilities, and because the non-market storage facilities are simply assumed to be full when needed. If they are not, the gaps will be larger still.
Figure 5.6: Gas storage is playing a growing role in meeting southern demand, but there is not enough storage
Daily southern demand met by southern production and storage (TJ)
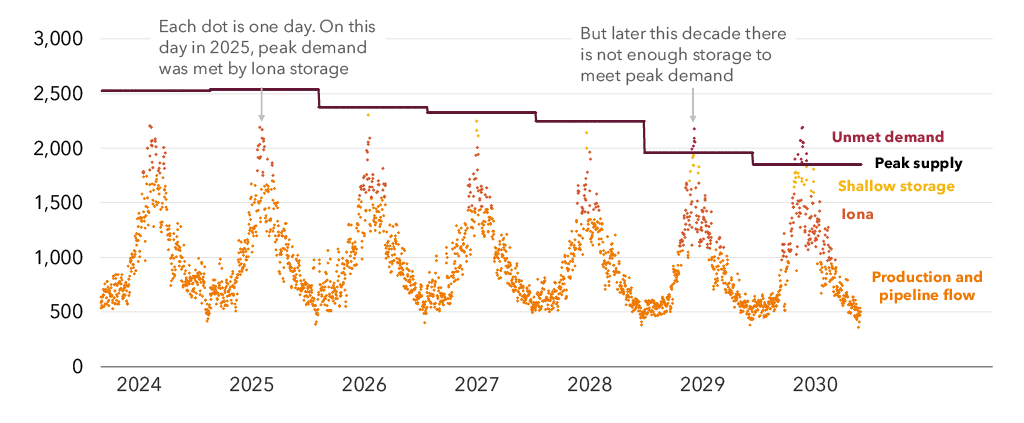
Notes: TJ = terajoules. Shallow storage includes Newcastle, Dandenong, and the Kurri Kurri Lateral pipeline. Additional demand is demand that cannot be met from pipeline flows from the north or from existing storage facilities. Because they do not provide storage services to the market, Colongra, Braemar, and Mortlake storage pipelines are not modelled – they are assumed to be available and supporting their power stations. AEMO’s modelling of daily shortfalls does not account for seasonal storage depletion, so actual supply gaps are likely to be much larger than suggested here.
Source: Grattan analysis of AEMO (2026a).
There is not enough gas storage to meet demand to 2030, and given that daily demand peaks are likely to increase beyond the 2030s, the east coast is likely to need more gas storage.
Without sufficient new gas storage, there is an increased risk that gas-powered generation plants switch to burning diesel. AEMO suggests that under-investing in infrastructure required to supply gas to gas generators could result in most of the gas generation fleet installing and regularly using 14-hour onsite diesel storage.133AEMO (2025b).
This would come at significant cost to consumers and link electricity prices to international fuel markets, since Australia imports almost all of our diesel. And given that diesel is about as emissions-intensive as coal when burned, it would also increase emissions.134Some NEM gas-powered generators can already burn diesel as well as gas.
5.5 AEMO should better use the Gas Statement of Opportunities to signal the need for investment in gas storage
To date, the market appears to be responding to the need for more gas storage. Snowy Hydro is working with Lochard Energy to expand the Iona storage in Victoria by about three petajoules to support Snowy’s gas peaking plants. GB Energy is planning to convert a (yet to be built)
gas production facility at Golden Beach in Victoria into a storage facility with 20 petajoules of gas once the gas field is depleted.
But the challenge of gas access is likely to change quickly, especially as declining overall demand pushes up the cost of pipeline gas and potentially renders some existing transmission pipelines and most of the distribution network uneconomic.
While most gas generators are connected to transmission pipelines, the decline of distribution networks will still affect their access to gas. Declining gas consumption will push up costs of transmission too. In addition, some networks are looking to connect gas generators directly
to the distribution network as backup onsite power for data centres. If the distribution network becomes unviable, distribution-connected generators could face increased costs or loss of pipeline gas.
To ensure the market continues to invest in gas storage in the right locations, AEMO should publish more granular forecasts of gas supply risks to existing and potential gas generators. Locations where pipeline gas is likely to become restricted or expensive may become targets
for investment in gas storage. Equally, the location of gas supply and storage may determine the optimum location of new gas generation.
Even as many gas pipelines (mostly distribution ones) decline in utilisation, there may be demand for some new transmission pipelines to supply gas-powered generators. Enhanced forecasts of gas supply availability are needed to ensure investors make optimal decisions on
the location of new storage and gas-powered generation plants.
Recommendation 4:
Get the market settings right to ensure there is sufficient gas-powered generation in the National Electricity Market:
– Implement the Electricity Services Entry Mechanism (ESEM) as proposed by the Nelson Review in the wholesale National Electricity Market.
– Incorporate gas-powered generation into the ESEM by contracting for sufficient volumes of technology-neutral firmed capacity.
– Price the emissions from electricity generation outside the ESEM by reactivating the Safeguard Mechanism in the electricity sector.
– Expand the capability of the Gas Statement of Opportunities to publish more granular forecasts of supply adequacy of pipeline gas to existing gas-powered generators.
– Enhance AEMO’s modelling of storage requirements by incorporating non-market storage facilities and transmission linepack into the gas storage model.
6 Plan electricity and gas as a single system
Australia’s electricity and gas systems are planned and regulated separately. This is tenable when both systems are growing, because both require continued investments. But when customers start to leave the gas network by electrifying, a regulatory system that is geared towards continued investment in gas makes less sense.
Planning and operating the gas and electricity systems separately will no longer work. It risks over-investing in gas infrastructure we don’t need, and under-investing in electricity infrastructure we do need. That would push up costs for everyone, and slow the transition to net zero.
The separate National Gas and National Electricity Objectives should be replaced with a single National Energy Objective that recognises that gas consumers are also electricity consumers, and allows regulators and businesses to make trade-offs between continued investment in the gas system versus electrification.
AEMO’s electricity planning does not fully consider how constraints in the physical gas system affect decisions on how much gas generation to build. This planning function should be expanded to make trade-offs between the costs of gas infrastructure versus alternatives.
The processes for planning and approving expenditure on electricity and gas networks should be harmonised. Without better integration of network planning, we run the risk that the electricity grid won’t be ready to handle increased demand from gas-to-electric switching.
Finally, gas market measures to avert supply shortfalls should be expanded to consider demand-side reduction options too. Increased supply makes sense as a solution to a shortfall when the market is growing, but not when it is shrinking. AEMO’s gas supply powers, and the forthcoming gas reservation scheme, should be designed to support, not resist, the electrification of gas demand.
6.1 Gas and electricity systems have separate governance
The gas and electricity markets are governed by two separate laws – the National Electricity Law and the National Gas Law – each with its own objective.135There is also a third law with its own objective, the National Energy Retail Law, which covers retail energy markets. Each objective is to promote efficient investment in and efficient operation of electricity and gas services (respectively) in the long-term interests of consumers.
Each objective shapes the rules for its respective market. For example, when the Australian Energy Regulator decides how much spending by gas networks to approve through Access Arrangements, it must approve spending that best meets the National Gas Objective (NGO).136Access Arrangements are the agreements by which the AER determines the amount of revenue networks are allowed to recover from customers. When the Australian Energy Market Commission sets rules for the electricity system, it must set rules that best meet the National Electricity Objective (NEO). The objectives are mandatory tests that govern the regulatory decisions for each system respectively.
But the two objectives are separate and siloed. The NEO applies to consumers of electricity and the NGO to consumers of gas. Neither the Australian Energy Market Commission when it sets rules, nor the Australian Energy Regulator when it applies them, is able to consider that all consumers of gas are also consumers of electricity, and therefore that gas consumers may have a long-term interest in leaving the gas network.
Under the NGO, pipeline owners are unable to consider electrification as an alternative to more gas network investment to meet customer needs. For instance, if a suburb faces a significant cost to replace its gas mains, the network owner is only able to consider the cost of new gas mains, and cannot consider whether electrifying the households in that suburb would better serve the long-term interests of the households.
And when it considers this spending proposal through Access Arrangements, the regulator is forced to consider only what would serve the long-term interests of gas consumers as gas consumers – not as households that pay both gas and electricity bills, that have choices between gas and electric appliances, and that have options to exit the gas network entirely.
This regulatory separation between electricity and gas no longer makes sense in the context of declining demand for gas, because most users of gas will at some point transition off gas. Instead of separate gas and electricity objectives, Australia should have a single National Energy Objective that sees households and businesses as energy consumers, not as separate electricity and gas consumers. A single objective would require businesses and regulators to make more direct trade-offs between further investment in the gas system, or electrification.137The Energy and Climate Ministerial Council last considered a proposal to combine the two objectives in 2022 when the emissions goal was added. Some stakeholders expressed concerns that regulators do not have experience optimising across the gas and electricity sectors. This simply underscores the need to break down the silos between gas and electricity regulations. Full integration would be complex and challenging, but this is not in itself a reason not to do it.
6.2 The electricity system plan should be expanded to consider constraints in the gas network
Currently, AEMO exercises its electricity transmission and whole-of-electricity-system planning functions through the Integrated System Plan (ISP). Every two years, it publishes a plan that outlines the mix of generation, transmission, and storage to reliably meet consumers’ electricity needs at least-cost, while meeting state and federal emissions and energy policies.
The Integrated System Plan cannot determine the optimum level of gas-powered generation to build
The ISP sets out a pathway with a specific volume of gas-powered generation capacity required to meet electricity consumers’ needs – the most recent ISP stated that 15 gigawatts of gas-powered generation would be required to meet system needs by 2050.
But the ISP is not really able to determine the ‘optimal’ level of gas-powered generation versus other forms of firming (backup) capacity, because it is not able to consider the physical infrastructure requirements to supply certain levels of gas-powered generation.
As discussed in Chapter 5, supplying gas-powered generation plants with gas in the future will be more challenging because high renewables penetration will push gas-powered generation into a different backup role requiring infrequent but high volume gas consumption, and because lower gas demand overall means pipeline services will become more expensive.
Because these costs arise in the gas system, not the electricity system, the ISP cannot account for them. So the volume of gas-powered generation indicated by the ISP may result in higher overall costs to consumers than alternative investments in the power system.
The ISP only considers constraints in the physical gas system to determine how many hours per day gas-powered generation can run
In the latest ISP, AEMO introduced measures to start modelling the interconnection between the gas and electricity systems. The new approach considered three gas infrastructure options to address future gas supply gaps, and calculated a daily gas supply limit for gas-powered generation across the National Electricity Market. These changes are a start, but they do not go far enough.
Those three options – an LNG import terminal at Port Kembla in NSW, a pipeline to a new gas field at Narrabri in NSW, and more southern supply and storage – result in different volumes of gas that can be delivered to a hypothetical future gas-powered generation fleet and therefore act as a limit on how much that fleet can run. While this introduces some awareness of gas system constraints, it simply acts as a limit on gas-powered generation output in each region; it does not determine the right volume and locations for new gas-powered generation capacity based on electricity system and gas system constraints.
As a result, the ISP suggests most of the new gas-powered generation be built near Melbourne, even though Victoria is likely to have the most acute gas supply constraints in the future. An alternative model, where new gas-powered generation was built in Queensland close to gas supply, would deliver lower gas infrastructure costs, but higher electricity infrastructure costs, so it is not preferenced by the model.
The ISP cannot make trade-offs between electricity and gas
Because the costs of the infrastructure required to run the gas-powered generation fleet are not considered in the ISP’s cost-benefit analysis, the ISP is unable to consider the system-wide benefits of gas-powered generation versus non-gas alternatives.
Consider one example: do we need more gas-powered generation in the Newcastle area? From an electricity system perspective, new gas-powered generation would make sense – by delivering electricity to Sydney from the north, it would reduce congestion on the grid south of Sydney. That would free up that part of the grid to deliver power from Victoria to Sydney.
But from a gas perspective, new gas-powered generation in Newcastle looks challenging. NSW produces essentially zero gas at the moment, and Newcastle sits at the end of the gas pipeline. A large new gas-powered generation plant would require new investment: either a pipeline to a new gas field at Narrabri, or an LNG regasification terminal. Either way, it would be costly to get enough gas to a new gas-powered generator in Newcastle.
The ISP assumes that because of the lack of gas infrastructure and supply in Newcastle, alternative firming technologies such as batteries are better in that location. But it is unable to determine whether consumers’ interests would be better served by new gas-powered generation in Newcastle – with all its attendant costs – or different investment in the electricity system. The ISP itself acknowledges that because ‘gas and electricity developments were not co-optimised, AEMO has not assessed whether this would be a more efficient outcome overall’.138AEMO (2025b).
Avoided investment in gas supply and infrastructure is not accounted for in the ISP model, because those costs accrue in the gas system, not the electricity system. The model is therefore unable to fully optimise for lowest overall system cost, just what is least cost in the electricity system, even if that means higher costs for consumers through higher gas costs.
The ISP does not consider the infrastructure costs of governments underwriting gas-powered generation
The ISP takes state and federal policies as constraints on its model. It does not assess the merits of government policy against its lowest-cost objective. As a result, government investment in gas-powered generation creates infrastructure costs that are not captured in the ISP.
For example, in 2025 the Queensland government announced a tender for a new 400 megawatt gas-powered generation plant near Gladstone. As a result, the ISP’s model requires an expansion of the Queensland Gas Pipeline, which runs inland from Gladstone, to serve this facility.
The South Australian government is similarly running a tender for 700 megawatts of long-duration, dispatchable generation. This will probably underwrite a new gas generator which would need additional network investment in gas supply and transport. When the contract is awarded, the ISP will be updated to reflect infrastructure investments required to service it, without assessing whether other non-gas investments might have met the electricity system’s needs at lower cost.
The ISP should be expanded to include the gas system
To become a whole-of-system plan, the ISP should be expanded to co-optimise investments in electricity and gas. Co-optimisation means considering the full benefits and costs of alternative investments in either gas or electricity infrastructure to meet the needs of consumers.
Co-optimisation would explicitly consider the costs of the infrastructure required to service the gas-powered generation fleet in the future, compared to options such as over-building renewables, batteries, demand management, or dispatchable pumped hydro.
Shifting the ISP to a full co-optimisation model would be a significant undertaking. AEMO should start in the next ISP in 2028, by enhancing its modelling of gas system constraints, co-ordinated with the Gas Statement of Opportunities. This could include modelling:
- Future access to and cost of pipeline gas for existing gas-powered generation plants.
- Optimising the location of new gas-powered generation based on access to gas.
- Incorporating system-wide costs of gas-powered generation plants (transport, storage, etc) into the least-cost optimisation function.
By the 2030 ISP, AEMO’s forecasts of gas-powered generation requirements should fully account for the ability to supply gas to the fleet, and the overall costs to consumers of building and running the fleet. This would be a substantial expansion of the role of the ISP.
Currently, the primary output of the ISP is a set of ‘actionable’ electricity transmission projects, which are regulated monopolies. The equivalent gas infrastructure (pipelines, production, processing) is privately owned, so an equivalent list of preferred gas would not carry the same regulatory weight. Nonetheless, getting the regulated electricity investments right, and giving a clearer signal to private gas markets about future demand for gas infrastructure, would be a material contribution of a co-optimised ISP.
6.3 Electricity and gas distribution network planning should be coordinated so that the grid is ready when people electrify
Residential gas users switching from gas to electricity will drive up demand on electricity networks and create new challenges. The electrification of household heating will probably shift peak demand from summer to winter. And with more appliances using electricity (cars, stoves, heaters, etc), the daily load levels on individual powerlines are likely to fluctuate much more than in the past. Sudden increases or decreases in electricity demand are manageable, but they require new tools.
At the moment, there is no coordination between gas and electricity networks about the pace and location of electrification. If electricity networks are not expanded or strengthened in advance, then rapid growth in electrification could cause localised blackouts, damage to customer appliances, or damage to the grid itself.
In its most recent determination proposal (the electricity equivalent of an Access Arrangement), Citipower, which runs the electricity network in inner Melbourne, says residential electrification has increased winter demand in peak hours by 250 per cent and caused damage to the grid from unmanaged load spikes.139Citipower (2025). Better coordination of residential gas-to-electric switching, and clear timelines, are essential to managing these necessary grid upgrades at least cost to consumers.
In Chapter 4, we argued that the operators of gas distribution networks should develop 25-year transition plans outlining which parts of the gas network will be needed and for how long, and should use each five-year Access Arrangement period to decommission parts of the network, giving customers at least five years’ notice. These decommissioning plans should be integrated with the determinations of the electricity networks, to ensure grid upgrades are completed in tandem.140Electricity and gas networks are, to an extent, competitors. Governments should carefully consider how competitive conflicts could be managed under an integrated planning model. A clear direction from government that residential gas use will be phased out by a certain date and that gas networks should be progressively decommissioned would largely solve this problem.
At a minimum, gas networks should be required to share data with electricity networks on customers either temporarily or permanently leaving the gas network, so that electricity networks can better anticipate increased demand from gas-to-electric appliance switching.
6.4 AEMO’s new gas supply powers should be expanded to include demand-side options
Despite being flush with gas, because most gas produced is exported, the east coast of Australia periodically faces forecasts of gas supply gaps, where forecast demand is higher than forecast supply. To manage the risk of these gaps, the federal government monitors the supply-demand balance and has the ability to restrict exports.
At the operational level, AEMO has a range of powers to manage gas supply gaps in the east coast gas system. After major gas supply and price shocks in the winter of 2022, and in the face of forecast supply gaps, the Energy and Climate Change Ministerial Council gave AEMO stronger powers including the ability to issue alerts of impending shortages, to convene conferences of gas companies to address shortages, to buy and sell gas directly, and to direct companies to provide gas when needed. Ministers also considered a new investment power that would have given AEMO the ability to run a tender for new gas supply, storage, or transport infrastructure if necessary to avoid shortfalls, but this proposal was withdrawn in May 2026.141ECMC (2026).
All of these powers are on the supply side – they are aimed at increasing the availability of gas to meet forecast demand. Interventions to boost gas supply make sense in the context of a growing market, but they make less sense in the context of gas demand that is already declining, and needs to decline faster to hit net zero.
Demand reduction is already averting supply gaps
In 2025, AEMO forecast that by June 2029, gas demand in the southern gas market would outstrip available supply, leading to several weeks of shortages. But in the most recent 2026 forecast, those forecast gaps in June 2029 are almost entirely gone (see Figure 6.1).
Figure 6.1: In the short-term, demand reduction is playing a much greater role than increased supply in avoiding supply gaps
Daily southern supply and demand, June 2029, (TJ)
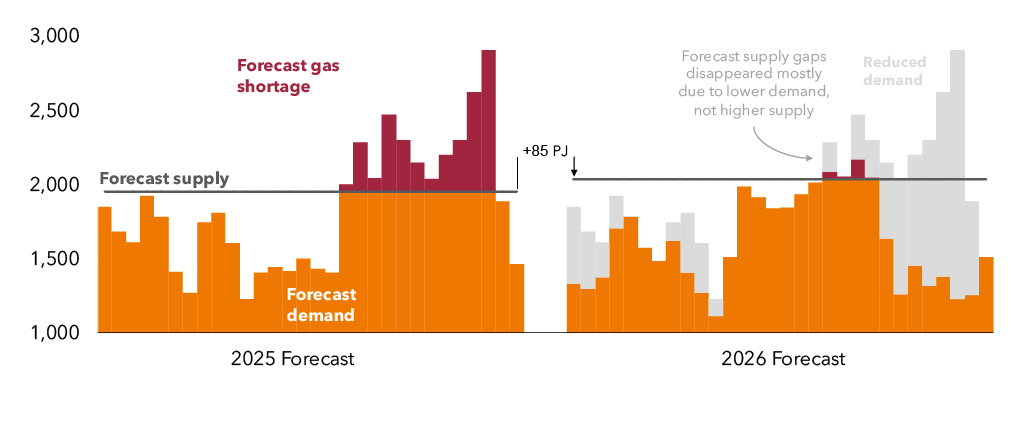
Note: TJ = terajoules.
Sources: Grattan analysis of AEMO (2025c), AEMO (2026a).
Increased supply plays a role – the forecast of daily gas availability went up 85 terajoules. However decreased demand is the primary reason the gaps have disappeared or narrowed.
There is less demand forecast for gas-powered generation, and households and industry are electrifying faster than previously expected. As a result, net demand over that month (June 2029) is projected to decrease by 6,800 terajoules, almost completely eliminating the potential supply gaps.142AEMO (2026a).
AEMO’s gas supply reliability powers should be reformed to give priority to demand reduction
In a gas market with declining demand, governments and industry should have the tools to manage supply gaps by both increasing supply and reducing demand. And because reducing gas demand should be a priority of energy policy, AEMO’s gas reliability powers should preference demand reduction wherever feasible, instead of supply increases.
The Gas Statement of Opportunities (GSOO) should be expanded to consider demand-side options to address future supply shortfalls. Currently, the GSOO identifies a suite of supply-side investments, such as pipeline expansions, to address future shortfalls. But the GSOO is unable to consider demand-side solutions to future supply gaps.143The Demand-Side Statement of Opportunities (DSOO) currently being developed by AEMO would be ideal for informing this aspect of the GSOO.
AEMO does not model demand-side reduction opportunities as alternatives to reduce future supply gaps, even though tactical demand reduction could meaningfully avert future shortfalls.
Take residential hot water systems as an example. Across NSW, Queensland, SA, and the ACT, about 140,000 gas hot water systems break down each year, and most of these are replaced with gas hot water systems.144Victoria is excluded from this analysis because from 1 March 2027 all gas hot water systems in that state must be replaced with electric systems, so this demand reduction will already be baked into GSOO forecast. See T. Wood et al (2023a) for discussion of replacement trends for gas appliances. Together, 140,000 hot water systems consume about 2.1 petajoules of gas per year.145Assumes a gas water heating system uses 15 gigajoules of gas per year. So replacing all these systems with electric alternatives would reduce demand by 2.1 petajoules each year. Cumulatively, this scale of demand reduction could functionally eliminate the supply gaps currently forecast for the early 2030s.
If governments can close future supply gaps by accelerating electrification, they should. And AEMO should be empowered to put forward demand-side options alongside supply-side measures as solutions to future supply gaps. By expanding AEMO’s gas supply powers to consider – and preference – demand reduction, AEMO’s reliability powers could accelerate, not hinder, electrification.
6.5 AEMO should be able to pay large users to reduce demand to avoid daily peak shortfalls
Ensuring sufficient gas supply each month and year is only part of the problem. AEMO is also accountable for ensuring gas supply can meet daily demand peaks, which are forecast to become higher as the electrification of household heating increases reliance on gas-powered generation during extended cold and still winter periods. Currently, AEMO only has supply-side options to manage those daily peaks.
By contrast, the electricity market has many ways of using demand response to manage peak demand. When electricity demand spikes, businesses registered with AEMO can bid into the spot market to reduce their electricity demand and get paid the spot price. Individual households can get paid by their retailer to reduce electricity for set periods. Retail customers can choose contracts linked to the wholesale price, or with time-of-use tariffs which reward customers for reducing demand during peak periods. And AEMO can pay large users of electricity to reduce demand as a last resort to avert blackouts.
The gas market has none of the above mechanisms to reduce demand. In large part, this is because the gas market does not operate on five-minute automatic dispatch and spot prices like the NEM, and because there are fewer large users of gas that would be able to reduce demand in response to price or other signals.
But AEMO should be able to pay large gas users to reduce demand to avert daily shortfalls. One option being considered by the Australian Energy Market Commission is a so-called Supplier of Last Resort mechanism, whereby AEMO could contract for supply and demand responses to an identified threat to gas reliability and supply.
When required in an emergency to avoid an imminent gas shortfall, this power would allow AEMO to procure either gas supply services (such as withdrawing gas from storage), or demand-response services (paying businesses to reduce consumption).
The Supplier of Last Resort power is valuable but it is not an effective tool for routine gas demand management. As the name suggests, it is mostly a tool for increasing supply, and it is only used as a last resort to prevent a crisis. In the proposed rule, demand-response would be procured only after AEMO had exhausted all supply-side options.
Like in electricity, demand response should be a normal part of a functioning gas market, not just an emergency measure before the lights go out. AEMO should be given much broader powers to procure gas demand response to manage daily peaks.
The amount of gas demand response that can be feasibly procured may end up being small. But even small reductions in peak gas use can be extremely valuable if they reduce the need for investment in further infrastructure. One study found that about 7 per cent of overall peak day demand could be curtailed in less than six hours with low complexity.146Based on 28 per cent of commercial and industrial gas demand, which itself makes up 25 per cent of total peak day demand; see page 48 of AEMC (2025). This would be a material boost to peak day reliability.
It should be straightforward for AEMO to procure this kind of demand response, and for gas users to be paid for it.
6.6 The gas reservation scheme risks locking in high demand
The federal government will introduce a gas reservation scheme starting in 2027, requiring all 10 LNG exporters in Australia to supply an amount of gas equivalent to 20 per cent of their exports for the domestic market.147The scheme may carve out WA, given they already have a state reservation. Under the scheme, exports to service pre-reservation contracts will be respected, but any additional exports will only be permitted once domestic supply obligations are met.
At the time of publication, the detailed reservation design was still under development. The design must walk a fine line – deliver more gas to domestic customers to put downward pressure on prices, without flooding the domestic market, propping up gas demand, or putting domestic-only producers of gas out of business. A fixed 20 per cent domestic gas supply obligation is likely to oversupply the domestic market by nearly 60 per cent for nearly a decade (see Figure 6.2). This works against the trend of declining gas use, and risks locking in gas use and emissions for longer.
Figure 6.2: Requiring 20 per cent of LNG export volumes to be supplied domestically risks flooding the domestic market with gas
Gas oversupply delivered by a 20 per cent reservation scheme, per cent of domestic supply
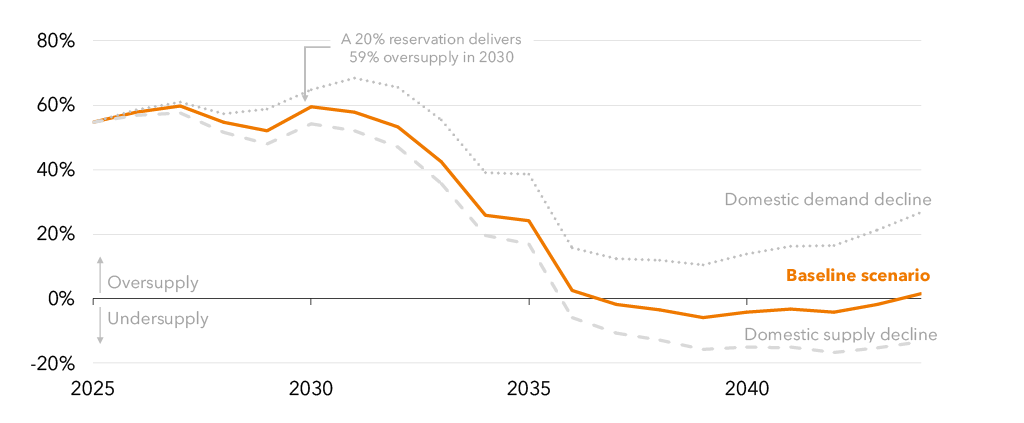
Note: See Reeve et al 2026 for a full outline of Grattan’s proposed federal gas reservation design.
Source: Grattan analysis.
Instead, the government should determine in advance the actual volume of gas required for the domestic market, up to a cap of 20 per cent of LNG exports, and require that volume of gas to be delivered. This would enable the regulator to calibrate reserved gas volumes to the size of demand in any given year, and to ratchet down the volume of gas delivered by the reservation over time.
Recommendation 5:
Better integrate gas and electricity system planning to enable a least-cost transition from gas:
– Combine the National Gas Objective and the National Electricity Objective into a single National Energy Objective.
– Expand the Integrated System Plan to become a least-cost whole-of-energy system transition pathway by including the physical gas system and its constraints.
– Integrate planning of electricity distribution and gas distribution networks to ensure that electricity networks are able to manage the increased load from electrification of gas use.
Recommendation 6
Prioritise demand-side measures to address future gas supply gaps:
– Expand AEMO’s gas reliability and supply powers to include demand-side as well as supply-side measures to avert gas supply gaps.
– Expand the Gas Statement of Opportunities to include specific demand-side options to address future supply gaps.
– Give AEMO expanded powers to manage daily peak gas demand by paying users of gas to reduce demand. Expand the planned Supplier of Last Resort power to preference demand-reduction over supply-side solutions, and integrate its operation into the normal function of the gas market, not as a last resort.
– Ensure the federal gas reservation is designed to avoid locking in high gas demand.
7 Prepare for life after LNG
So far, this report has focused on the role of gas in the domestic economy. But about 75 per cent of gas produced in Australia is exported, and LNG is our largest source of gas-related emissions.
Australia is the world’s second-largest exporter of LNG – but these exports have probably passed their peak. As major export contracts expire through the 2030s, Australia’s LNG exports are likely to decline. Despite the Iran War, in the long term the world is likely to be flush with LNG – and Australian LNG is relatively expensive, meaning we will probably lose market share to cheaper competitors.
The reality of a massive but declining sector presents the federal government with two challenges.
The first is to make the most of LNG while it is here. To capture value of this non-renewable resource, the government should reform or replace the current gas tax and introduce a windfall profits tax. To ensure domestic gas users will have access to gas for as long as they need it, the government should ensure the new national reservation actually delivers gas and cannot be gamed. And to keep our national emissions reductions on track, the government should use the upcoming review of the Safeguard Mechanism to drive greater emissions cuts from LNG.
The second challenge is to prepare for a post-LNG economy. This will require building up new industries to replace LNG as a source of export revenue, ensuring the industry doesn’t leave taxpayers with a heavy clean-up bill, and supporting locations that currently depend on LNG for jobs to transition to new types of employment.
LNG is not going to disappear quickly, but restructuring an economy takes decades. And exporting LNG indefinitely risks the rest of the Australian economy by driving dangerous climate change. That’s why we must start preparing for life after LNG now.
7.1 Demand from Australia’s legacy LNG customers is likely to decline over the next two decades
Australia is a major exporter of LNG. But our exports peaked in 2023 and will probably never be as high again.
Nearly 90 per cent of Australia’s LNG exports are shipped to the major east Asian economies – Japan (36 per cent), China (28 per cent), South Korea (14 per cent), and Taiwan (11 per cent).148DISR (2024). But all of these countries except Taiwan plan to use less natural gas domestically over the next two decades.
Japan has had declining domestic gas demand for a decade as nuclear capacity has restarted post-Fukushima and the share of renewables in power generation has grown. Japan’s latest energy plan expects a demand of between 8 per cent and 20 per cent less LNG than was imported in 2024, assuming it meets its emissions-reduction target of 73 per cent on 2013 levels by 2040. Under less stringent emissions reductions of 61 per cent, gas consumption is forecast to increase by 12 per cent.149JANRE (2025).
But Japan’s LNG importers are already over-contracted against domestic demand. Even if the upper range of 2040 import demand were reached, if Japan simply renewed its current contracts it would still have more than enough gas to meet demand without any additional purchases.150Reynolds (2026).
South Korea‘s energy plan expects LNG electricity generation to fall from about 25 per cent of the mix to about 10 per cent. This would require South Korea to build quickly to overcome its slow adoption of renewables, increasing generation share from a recent record of about 10 per cent in 2024 to about 40 per cent in 2038.151Kim (2025).
Despite rising electricity demand from data centre growth, South Korea is trending away from gas and towards nuclear and renewables, and even faster than in Japan. And several plans for new LNG import infrastructure have recently been cancelled in light of softening demand.152Lui (2024). All this suggests that South Korea’s imports for domestic use are unlikely to grow strongly.
Taiwan is building new LNG import facilities and plans to install 13 gigawatts of gas-powered-generation capacity to 2030, adding about 60 per cent to its current capacity of 21 gigawatts. This is to support a stated ambition to depend more heavily on LNG for electricity as it moves away from coal. Because about 80 per cent of Taiwanese gas use is for electricity, this is likely to directly drive increased LNG demand.
On the other hand, Taiwan is also considering restarting nuclear power after several major blackouts and an increased sensitivity to energy security threats. Each additional gigawatt of active nuclear would displace about a million tonnes per year of LNG use. While it is almost certain that Taiwan’s gas demand will increase, the exact magnitude will change if nuclear re-enters the mix.
China‘s geography means LNG demand faces several headwinds. With renewable capacity soaring to 55 per cent of the grid, gas generation has been kept at only 3 per cent of electricity, compared to Taiwan’s 40 per cent, South Korea’s 25 per cent, and Japan’s 30 per cent.153IEA (2024b), IEA (2024c), IEA (2023a), IEA (2023b). China produces 60 per cent of its own gas domestically (at a growing rate), at much lower costs than importing. And it also has access to overland gas piped from Russia and Central Asia, which is cheaper than LNG imports. In a warring world, domestic and overland gas imports from neighbouring countries are likely to receive an additional security premium.
The International Energy Agency forecasts China’s gas demand to grow 36 per cent to 2035 under its Stated Policies Scenario, and to plateau from there – it is forecast to grow only an incremental 6 per cent more to 2050.154The Stated Policies Scenario includes all policies which are in place, and which have been announced. China will only buy as LNG what it cannot produce domestically or import more cheaply through pipelines.
7.2 LNG demand may grow in new markets, but this is uncertain
International forecasts project demand from Australia’s current customers to be partially replaced by demand from other countries in Asia as growing economies try to boost their energy supply without coal. But there are likely scenarios where prospective buyers of Australian LNG accelerate the deployment of renewables over gas, and demand for LNG is lower than is currently expected.
The IEA’s World Energy Outlook 2025 forecasts growth of 35 per cent in Southeast Asian gas demand to 2035, and a further 15 per cent growth to 2050 in the Stated Policies Scenario. But it is fundamentally uncertain how much gas is going to be used in these countries.
Throughout Southeast and South Asia, the cost of utility-scale solar and storage has fallen fast, and these countries are not following the same development path as Australia and other western economies. In many countries, the sources of electricity are trending towards renewables faster than gas.
Countries that have not yet built many LNG import terminals and gas-fired generators are facing a choice between locking in that capital now or going directly to renewables.
Immediate concerns about reliance on imported fuels will also have an impact. In Vietnam, for example, power plant developers are already switching proposed LNG projects to solar and batteries, to avoid future exposure to challenges with energy security and supply autonomy, and from a desire to control future electricity costs.155Stapczynski (2026).
And even where countries do continue to increase their use of gas, they are likely to prioritise domestic production – so LNG demand will decline faster than gas demand.
7.3 Australia’s LNG sector has higher costs than competitor countries
Compared to LNG from other countries, Australian LNG is expensive (Figure 7.1). Many of the factors that drive costs are unique to where the gas reserves are located – for example, the Scarborough gas field in WA is located in deep water and requires a dedicated pipeline to get the gas to the Pluto LNG plant for processing and liquefaction. And the Pluto facility is in a remote location, which pushes up labour costs.156AEP (2020).
Figure 7.1: Australian LNG is relatively expensive to produce
Cost of LNG production, dollars per gigajoule
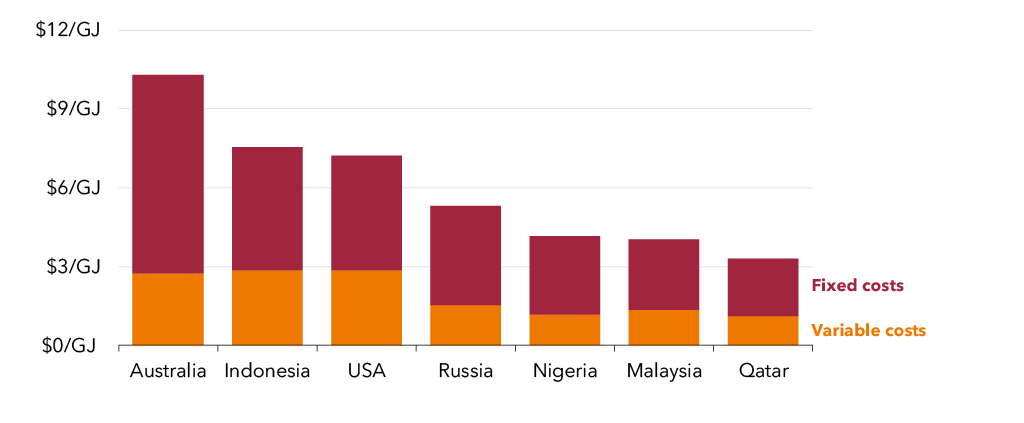
Note: Variable costs include labour costs as well as other variable inputs, for example, energy.
Source: DISR (2024).
Buyers with limited substitutes or limited domestic energy resources of their own may be prepared to pay an energy security premium for LNG from Australia. But they will not source all their LNG from high-cost producers if they don’t have to.
Before the Iran war, forecasts showed that a coming wave of LNG expansion, driven by Qatar and the US, was likely to cause a prolonged period of lower LNG prices.157IEA (2025b). Due to the destruction of part of Qatar’s production, and the security problems of moving gas through the Strait of Hormuz and the Bab-Al-Mandab Strait, global LNG spot prices are elevated, and futures prices suggest they will stay high for some time.
If the shock from the war persists, high prices are likely to result in demand destruction, as users implement efficiency measures, switch to other fuels such as coal, or electrify. This is what happened in Europe in 2022, when Russia’s invasion of Ukraine sent European gas prices soaring.158Bruegel (2026). And if the shock passes quickly, the planned influx of new LNG supply is more likely to hit the market on time.
This means that when the market returns to ‘normal’, there is every likelihood Australian LNG producers will be selling a relatively high-priced product into a market that is smaller than they were planning for just a few months ago.
Regardless of the exact rate of decline, some LNG production will be around for decades. The government should more actively manage the sector to ensure minimal damage and maximum benefit to the Australian economy. It can do this in three ways: ensuring LNG makes a fair contribution to emissions-reduction goals, managing the impacts on domestic gas prices through a strong reservation, and ensuring taxpayers get a fair slice of export profits by reforming gas taxation.
7.4 LNG exporters should deliver more domestic emissions reductions
LNG emissions are large. The Gorgon LNG facility in WA emits 2 per cent of Australia’s total emissions all by itself – equivalent to all the emissions from the 5.5 million homes that use gas for heating, cooking, and hot water.159Grattan calculation based on DCCEEW (2026), CER (2026b), and DCCEEW (2025b). IEA and IEEFA estimates suggest the methane fugitive emissions from LNG may be even higher due to under-reporting; potentially as much as twice the reported amounts: Denis-Ryan (2023), IEA (2026).
All Australian LNG facilities are covered by the Safeguard Mechanism.160The workings of the Safeguard Mechanism are described in Box 3. LNG facilities surrendered nearly a million offsets in 2023-24 to meet their obligations.161CER (2025). This is likely to increase as the Safeguard Mechanism tightens, because once built an LNG facility has few options to reduce its emissions, and many of those it does have cost well above the cost of buying an offset (see Figure 7.2).
Figure 7.2: Most options to reduce emissions from LNG cost more than Australian carbon credit units
Estimated costs of abatement options and forecast ACCU prices, $/tonne of CO2-e, 2030 (top) and 2050 (bottom)
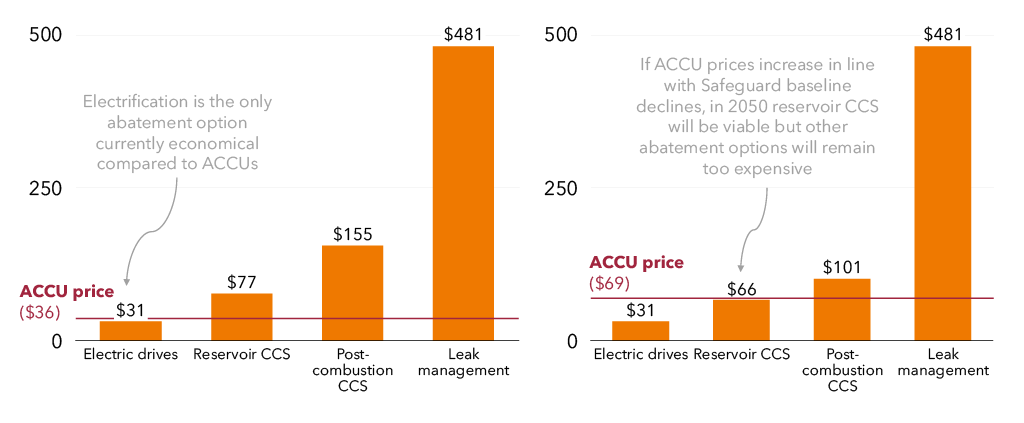
Notes: CCS = Carbon Capture and Storage. ACCU = Australian Carbon Credit Unit. ACCU prices are assumed to rise at the same rate that Safeguard baselines fall. This assumes an ACCU price of $69 in 2050, far below the Australian Energy Market Commission’s estimate of the potential social cost of carbon at this time.
Sources: Grattan analysis of Energy Transitions Commission (2023), CER (2025), DCCEEW (2025b).
Given the headwinds facing Australian LNG described in Section 7.1, it is unlikely that an entirely new LNG export facility will be built.162There are only two new LNG facilities listed in the Resources and Energy Major Projects database: the Rafael project in WA and the Tamboran project in the Northern Territory: Office of the Chief Economist (2025). It is more likely that LNG exporters will want to open new gas fields to provide gas to existing LNG trains.163The Resources and Energy Major Projects database lists Ichthys, off WA, and Pluto, in WA, as potentially expanding production. Pluto is due to come online this year. The date for Ichthys is unknown.
However, given that LNG facilities have long lives, and are difficult to adjust once built, it is worth considering the emissions impact of a new facility. Australia’s emissions targets are set using an emissions budget, and the more of this budget that is consumed by LNG facilities, the harder other sectors have to work to decarbonise to keep the country within the budget.
New gas fields servicing existing LNG facilities are required already to keep their reservoir carbon dioxide emissions at zero, either by offsetting all the carbon dioxide emissions, or by using carbon capture and storage (CCS) to capture and store them. As shown in Figure 7.2, CCS for these reservoir emissions should be cost-effective compared to Australian carbon credit units once ACCU prices double.
But making CCS cost-effective compared to offsetting does not make it easier to implement. Only one Australian facility (Gorgon) has installed CCS, and not particularly successfully.164The Gorgon CCS project is run by Chevron on Barrow Island off Western Australia, part of the Carnarvon basin. Theoretically, it is the largest CCS project in the world (Chevron (2026)). But delays and technical difficulties have meant it has not realised this potential. The project started construction in 2009, was scheduled to open in 2014, but only properly began injecting carbon in 2017. While the planned storage capacity is four megatonnes per year, in the past five years the most it has injected was 2.7 million tonnes of carbon dioxide in 2020; in 2024 it only injected 1.6 million tonnes, or 15 per cent of its emissions: Morrison (2025).
Barring huge improvements in the success of CCS, it is likely that any new LNG facilities will come with a large demand for offsets. A recent study commissioned by Woodside into the Browse basin, found that developing the new gas field would push up demand for carbon capture by 1 million tonnes in 2050. Critically, though, it suggested these emissions would be better captured using direct air capture and CCS in the power sector, neither of which have been commercially demonstrated. This underscores the challenges that CCS faces in decarbonising LNG.165Deloitte (2026).
In Chapter 1, we noted that Australia’s capacity to produce offsets is limited, and that many other sectors will also need them. Allowing facilities that will create large increases in offset demand (regardless of what sector they are in or what they produce) will make the pathway to net zero more difficult.
The federal government should use the upcoming review of the Safeguard Mechanism to assess the risk of new LNG facilities making it harder to reach net zero. This should include considering the threshold at which facilities become liable to participate in the Safeguard, and whether the unlimited use of offsets is reducing the incentives to use CCS.
The government should also consider ways to require LNG producers to deploy CCS onsite before using carbon removals, and placing additional conditions on new facilities with very large emissions. The government should maintain the requirement for new fields serving LNG trains to keep their reservoir carbon dioxide emissions at zero.
7.5 A strong gas reservation should moderate the impact of gas exports on domestic prices
The world price of gas flows through to the Australian economy, because our exporters can choose to sell gas to the world market for high prices instead of supplying gas domestically.
This link affects electricity prices, domestic gas prices, and, through both of these, the cost of everything from groceries to domestic manufacturing.
Successive federal governments have tried for years to break the link between world and domestic gas prices, through the Australian Domestic Gas Security Mechanism, the Code of Conduct, and the Heads of Agreement. Late last year, the federal government admitted it was time for wholesale reform, and it is now designing a domestic gas reservation to replace all three.
The government’s stated intention is to make gas exporters supply the domestic market first, before they can export. This should give the domestic market more gas than it needs, so that prices fall on average and there is a buffer if international prices spike.
At the time of publication, the detailed design of the reservation was still being developed. There are three critical decisions to make in designing the reservation: how much gas does the domestic market need, how should that gas be allocated across exporters, and how should the obligation to supply that gas be policed. We proposed a model to balance these objectives in our submission to the reservation design.166Reeve et al (2026).
7.6 The federal government should reform its gas tax
The federal government does not receive much tax revenue in return for leasing out Australia’s gas resources. This is particularly the case when international prices are high.
Gas producers pay corporate taxes like all other companies, state royalties (calculated on the value of gas) to capture rents on onshore gas, and the federal Petroleum Resource Rent Tax on offshore gas (see Box 7).
While other gas-exporting countries receive significantly more state revenue from gas, like-for-like comparisons are difficult due to the structural differences in the equity and tax positions which other governments take on their gas sectors.
Box 7: Royalties versus rent taxes
Royalties are payments to government of a fixed percentage of production value or a fixed rate per unit of production volume, in return for the right to exploit a natural resource. They are simple to administer and hard to avoid.
There is no precise science to setting a royalty rate: royalties of around 10 per cent are most common, although up to 20 per cent is not uncommon.aKraal (2021). Royalties can also use a graduated scale, so that higher commodity prices lead to higher royalties.
Royalties can act as a deterrent to investment because they must be paid regardless of how successful the project is. They raise operating costs for every unit produced, and reduce the number of projects that are profitable enough to proceed.
Rent taxes are an alternative approach. These taxes apply to profits above a threshold representing a reasonable return on investment. If the project is not profitable, no tax is paid. They do not increase marginal production costs or change the investment decision for marginal projects.
The Petroleum Resource Rent Tax has failed to deliver significant revenue
7.6 The federal government should reform its gas tax
The federal government does not receive much tax revenue in return for leasing out Australia’s gas resources. This is particularly the case when international prices are high.
Gas producers pay corporate taxes like all other companies, state royalties (calculated on the value of gas) to capture rents on onshore gas, and the federal Petroleum Resource Rent Tax on offshore gas (see Box 7).
While other gas-exporting countries receive significantly more state revenue from gas, like-for-like comparisons are difficult due to the structural differences in the equity and tax positions which other governments take on their gas sectors.
The Petroleum Resource Rent Tax has failed to deliver significant revenue
The Petroleum Resources Rent Tax (PRRT) was legislated in 1988 as a more efficient measure than the older royalty/excise system that applied to offshore gas fields such as Bass Strait. It has been incrementally reformed ever since, but still does not capture fair amounts of revenue from gas companies.
Oil and gas projects require large upfront asset investment, incurring negative profits. Once operational these assets generate profits for the project’s life. The PRRT is a 40 per cent tax on profits, with a built-in clause to allow negative profits from the past to be ‘carried forward’ to offset against positive profits in future years. Because investment projects rely heavily on discount rates (the amount the future is discounted against present money), negative profits from the past have been able to be carried forward at very high discount rates.
The large capital expenditure of LNG projects, combined with the ability to split profits between upstream and downstream entities in the same corporate structure, has meant that taxable profits have so far been low – in many cases zero.167While taxable profits have been low, gross profits have often been significant. No LNG project had paid any PRRT before 2023, despite reported revenue of about $74 billion in that year.168Treasury (2023), Geoscience Australia (2025). Total PRRT from LNG was $1.5 billion in 2023-24. And the $47 billion Ichthys project, which began operation in 2018 and exports up to 9.3 Mt per year, has paid no PRRT so far.
Attempts have been made to reform the PRRT and collect more tax. Following the Callaghan Review, the Morrison government lowered the rate at which negative profits could be carried forward, and in its first term the Albanese government made further changes that brought forward $2.4 billion of PRRT collections over five years.169Chalmers (2023). These changes were widely criticised as weak and likely to raise less money than was anticipated.170J. Evans (2025), Steggall (2023). The problem of transfer pricing between entities in the same corporate structure was never addressed, nor were simpler proposals to lift the headline 40 per cent tax rate.171Freebairn and Quiggin (2010).
The PRRT is not working, and it should be comprehensively reformed to fix the problems above, or replaced.
Figure 7.3: Gas companies have not paid much tax despite large revenue increases
Tax paid by gas companies, billions of dollars
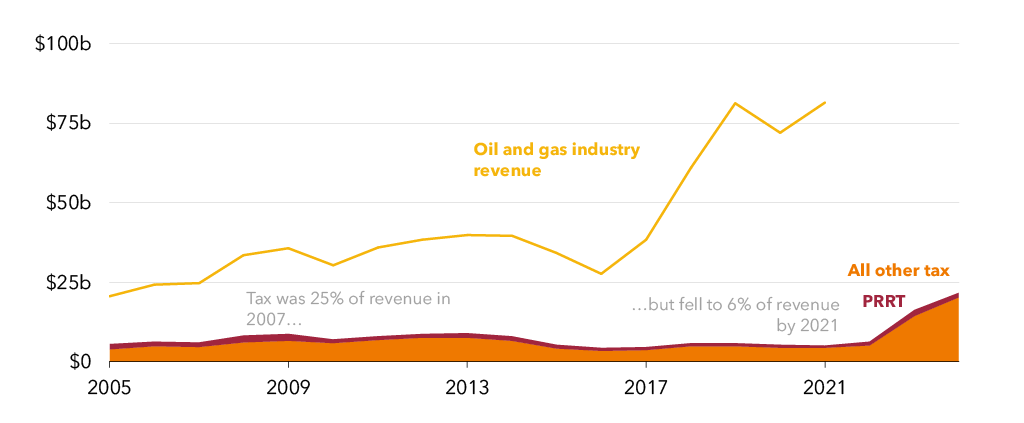
Notes: PRRT = Petroleum Resource Rent Tax. The remainder of the taxes paid are royalties and company taxes.
Sources: APPEA (2021), ATO (2025).
The PRRT could be replaced with a simple royalty
Gas production is a profitable business. It does not seem to be the case in Australia that royalties are a deterrent to investment in gas: the Queensland royalty regime, which takes a substantial share of well-head value, did not deter the development of the Queensland gas industry.172At April 2026 prices, every gigajoule of Queensland gas supplied to the domestic market earned the Queensland government $1.14; and every gigajoule of spot LNG earned $1.12 (Grattan calculation using Queensland royalty rates). In the 2024-25 financial year, the Queensland government received $1.2 billion in royalty payments from gas, almost as much as the federal government made from PRRT from the whole country: (Queensland Government (2025)). Replacing the PRRT with a royalty would make it harder to avoid, and the Queensland experience shows that it is unlikely to deter investment. In 2023, Grattan calculated that a simple royalty of 10 per cent on well-head value would have raised more than $4 billion per year.173D. Wood et al (2023).
One downside of a royalty is that it doesn’t always capture windfall profits. This suggests the best mix may be a royalty on ‘normal’ prices, supported by a higher and more responsive windfall profits tax.
The government should introduce a windfall profits tax
Events such as the Ukraine and Iran wars can deliver windfall profits to commodity producers, and governments have sometimes sought to limit or redistribute them.
In 2022, a combination of circumstances pushed domestic gas prices to well above $20 a gigajoule. The government responded by imposing a price cap of $12 a gigajoule for one year that was subsequently relaxed to a reasonable price indicator. This price cap operated alongside the existing mechanisms of the Australian Domestic Gas Supply Mechanism, the Heads of Agreement, and the Code of Conduct.
Domestic short-term contracts steadily reduced to around $13 a gigajoule, well below the international price but above the federal government’s cap. The ACCC considered that the price cap had little impact, at least partly because the resources minister provided exemptions to several producers.
In present or future crises, a relatively simple alternative to these arrangements would be for the federal government to introduce a two-part windfall profits tax:
- A tax rate of 100 per cent on revenue from domestic sales that exceed a reasonable local maximum of the recent price history.
- A tax rate of 50 per cent on revenue from export sales, indexed to the Brent Crude oil price.
The first would protect domestic consumers from extreme volatility in international prices. The second would give Australians a share of profits that arise from geopolitical disturbances.
A windfall profits tax deters opportunistic pricing and would not be expected to raise any significant revenue for the government. It would not affect our international customers who are already paying the high prices and, if well-designed, would not affect the investment attractiveness of the sector, since prices would remain at levels where the companies were quite prepared to invest.
The proposed gas reservation does not substitute for a super-profits tax; they are solving different problems. The reservation is solving the problem of uncertainty of supply, noting that this may have an impact on prices. The windfall profits tax solves the problem of price volatility.
7.7 Governments should plan for a post-LNG economy
The eventual decline of the LNG sector is necessary to limit the damaging effects of climate change. And Australia stands to benefit hugely from stabilising our climate. But losing the LNG sector will also come at a cost.
Unless we plan well, communities will be harmed, our terms of trade will worsen, and our economy will be weaker. So, the government should start preparing the economy for a post-LNG future.
When decline comes, it will come quickly
When large industries close down, the process tends to happen slowly, and then quite quickly. This happens because large and complex industrial facilities have a minimum viable scale: a production volume below which it is no longer economic to produce.174Lappen and Grubert (2026). This effect also exists at the industry level: a minimum number of producers and/or amount of production is required to sustain the secondary industries that service all producers.175A good example is the closure of car manufacturing in Australia. Structural decline of the industry began in the early 2000s, and the Mitsubishi plant in Tonsley, SA, closed in 2008. The remaining three plants held on until 2013, when they all announced they were closing within a period of nine months. To maintain car manufacturing in Australia required all four plants to be operating; once Mitsubishi closed, the remaining plants found it harder and harder to remain viable.
This is the risk faced by the LNG sector. While forecasts show a smooth decline in demand for LNG, the withdrawal of production capacity will be lumpy. This has already begun – the first Australian LNG train to close was Woodside’s Train 2 at the North West Shelf LNG plant. Woodside closed the train in July 2025, reducing the plant’s capacity by 15 per cent.176Woodside (2025). The economies of scale associated with LNG production and transport means the closure of some plants may hasten the closure of others.
Employment impacts will be small, but concentrated
LNG facilities employ relatively few people once the construction phase is over. There are 18,000 direct full-time-equivalent employees in the oil and gas extraction sector, and if the number of jobs is proportional to production, then we estimate that about 15,000 of those jobs are associated with LNG.177ABS (2026). People who provide logistics and supply chain services to the LNG industry will also be affected, although less directly.
The widespread use of fly-in fly-out workers means most of these people do not live near the facilities. But some regional towns, such as Karratha, Port Hedland, and Broome, rely on economic activity from these workers. As well, the Gladstone facilities are in a region of Queensland that will be hard-hit by the closure of coal mines, so the impact of LNG decline will be compounded there.
The federal government should commission a report from the Net Zero Economy Authority on the regional economic impacts of declining LNG.
Australia will need replacement export industries
7.7 Governments should plan for a post-LNG economy
The eventual decline of the LNG sector is necessary to limit the damaging effects of climate change. And Australia stands to benefit hugely from stabilising our climate. But losing the LNG sector will also come at a cost.
Unless we plan well, communities will be harmed, our terms of trade will worsen, and our economy will be weaker. So, the government should start preparing the economy for a post-LNG future.
When decline comes, it will come quickly
When large industries close down, the process tends to happen slowly, and then quite quickly. This happens because large and complex industrial facilities have a minimum viable scale: a production volume below which it is no longer economic to produce.174Lappen and Grubert (2026). This effect also exists at the industry level: a minimum number of producers and/or amount of production is required to sustain the secondary industries that service all producers.175A good example is the closure of car manufacturing in Australia. Structural decline of the industry began in the early 2000s, and the Mitsubishi plant in Tonsley, SA, closed in 2008. The remaining three plants held on until 2013, when they all announced they were closing within a period of nine months. To maintain car manufacturing in Australia required all four plants to be operating; once Mitsubishi closed, the remaining plants found it harder and harder to remain viable.
This is the risk faced by the LNG sector. While forecasts show a smooth decline in demand for LNG, the withdrawal of production capacity will be lumpy. This has already begun – the first Australian LNG train to close was Woodside’s Train 2 at the North West Shelf LNG plant. Woodside closed the train in July 2025, reducing the plant’s capacity by 15 per cent.176Woodside (2025). The economies of scale associated with LNG production and transport means the closure of some plants may hasten the closure of others.
Employment impacts will be small, but concentrated
LNG facilities employ relatively few people once the construction phase is over. There are 18,000 direct full-time-equivalent employees in the oil and gas extraction sector, and if the number of jobs is proportional to production, then we estimate that about 15,000 of those jobs are associated with LNG.177ABS (2026). People who provide logistics and supply chain services to the LNG industry will also be affected, although less directly.
The widespread use of fly-in fly-out workers means most of these people do not live near the facilities. But some regional towns, such as Karratha, Port Hedland, and Broome, rely on economic activity from these workers. As well, the Gladstone facilities are in a region of Queensland that will be hard-hit by the closure of coal mines, so the impact of LNG decline will be compounded there.
The federal government should commission a report from the Net Zero Economy Authority on the regional economic impacts of declining LNG.
Australia will need replacement export industries
LNG is one of Australia’s largest exports, second only to iron ore in value of goods exported. In 2025, LNG exports were worth $60 billion; since 2010, LNG has risen from 4 per cent of goods exported by value to 11 per cent.178DFAT (2026). If it disappears quickly, this will have an adverse impact on the balance of trade, and on the economy more broadly.
The federal and state governments need to urgently start encouraging new industries that can take the place of LNG. They need to put in place well-designed industrial policy to build up industries that capitalise on Australia’s strategic and comparative advantages in minerals and renewable energy.
LNG exports are also a source of geo-strategic influence for Australia. It is telling that during the 2020-24 trade war, China did not suspend LNG imports. Similarly, LNG has given Australia leverage in the global energy crisis of 2026, as a tool to ensure liquid fuel imports from Asia.179Albanese and Wong (2026), Albanese et al (2026). Industrial policy should also account for how to manage the loss of a lever of geo-strategic influence.
Grattan has written at length on how to design good industrial policy and where Australia’s opportunities lie.180See, for instance, T. Wood et al (2022), T. Wood et al (2020).
Taxpayers should not be made to pay to clean up the mess
Gas production affects air quality, water quality, Indigenous heritage, soils, and the ecosystems where it is located. As the industry winds down, there is a risk that assets are sold to smaller operators that collapse, leaving no clear responsibility for decommissioning and remediation, and no one to foot the bill.
Remediation costs are substantial. For example, Chevron estimates that the cost to clean up Barrow Island in WA is $2.3 billion.181Milne (2025). The oil and gas sector estimates that total remediation costs in Australia will top $60 billion in the next 30 years.182AEP (2020). And it is likely that these costs are underestimates, because there is no agreed standard for what constitutes ‘decommissioned’ and ‘remediated’.183Experience in the UK is that, on average, decommissioning activities cost 76 per cent more than estimated (ranging from 21 per cent to 189 per cent more): DISR (2025).
In an expanding industry, remediation costs from one project are recouped from the revenue of the next project. But this model breaks down when the industry is contracting: there is no ‘next project’ to provide the cash to pay for remediation. The temptation for companies is to sell off assets to shelf companies that then declare bankruptcy and walk away from the problem. Another approach is needed to ensure the money is set aside ahead of time and responsibility can’t be avoided.
The federal government has already put in place trailing liabilities for decommissioning, after the financial collapse of Northern Oil and Gas Australia.184Northern Oil and Gas Australia went into liquidation in January 2020, leaving the Northern Endeavour floating oil platform without an operator. The vessel was in poor condition, raising concerns about a major accident or environmental incident. The federal government assumed ownership of the platform, installed a caretaker operator, then paid for full decommissioning and remediation. The government has not published the cost of this remediation, but estimates range up to $1 billion: Macdonald-Smith (2021). Trailing liabilities allow the federal government to issue remedial directions to current and former holders of petroleum titles, parent and related companies, and people who had significant influence on or financial benefit from the project.
The federal government also imposed a temporary levy on all offshore petroleum title-holders, to cover the costs of remediation of Northern Endeavour after the collapse of Northern Oil and Gas Australia.
Trailing liabilities should be sufficient to prevent another Northern Endeavour. But the federal government should move quickly to establish standards for decommissioning and remediation, and then make an industry-wide assessment of the likely costs. This can then inform further reforms, such as requiring title-holders to periodically show they have access to sufficient funds to undertake full remediation (as a condition of continuing to hold a licence); or requiring them to post clean-up bonds or contribute to a clean-up fund. State governments should use the same assessment to reform their arrangements.
Recommendation 7:
Manage the LNG sector more actively to maximise its benefit to Australia and prepare for a post-LNG economy:
– Reform the Safeguard Mechanism to drive emissions reductions from LNG facilities, including from greater deployment of carbon capture and storage.
– Commission a report from the Net Zero Economy Authority to assess the regional economic impacts of a declining LNG sector.
– Ensure the LNG industry pays sufficient tax by reforming or replacing the Petroleum Resource Rent Tax, and introducing a windfall profits tax.
– Ensure the gas reservation delivers sufficient gas to the domestic market in the short term, without locking in long-term demand.
– Use industry policy to build up new export industries that can replace the export income, economic contribution, and geo-strategic influence that LNG currently provides.
– Establish a national standard for decommissioning and remediating gas production facilities. Conduct a national survey of the likely cost of achieving this standard across all gas facilities, to inform further reforms.
Acknowledgements
This report was written by Alison Reeve, Tony Wood, Hamish McKenzie, and Ben Jefferson. It was edited by Paul Austin.
We would like to thank the members of Grattan Institute’s Energy and Climate Change Program Reference Group for their helpful comments, as well as numerous government and industry participants and officials for their input.
The opinions in this report are those of the authors and do not necessarily represent the views of Grattan Institute’s founding members, affiliates, individual board members, reference group members, or reviewers. The authors are responsible for any errors or omissions.
Grattan Institute is an independent think tank focused on Australian public policy. Our work is independent, practical, and rigorous. We aim to improve policy by engaging with decision makers and the broader community.
We acknowledge and celebrate the First Nations people on whose traditional lands we meet and work, and whose cultures are among the oldest in human history.
For further information on Grattan’s programs, or to join our mailing list, please go to: www.grattan.edu.au. You can donate to support future Grattan reports here: www.grattan.edu.au/donate.
Please view the downloadable pdf for the bibliography.