Published by Inside Story, Friday 8 June
When income tax scales change, it’s inherently a question of redistribution. Any change to tax rates is a decision about who should bear less — or more — of the tax burden. And because of bracket creep, any decision not to change tax rates is also a decision to shift the tax burden.
At the very least we should be honest about the redistribution that will occur. Unfortunately, much of the discussion about the government’s tax plan has used arguments that conceal it. Those on the right conceal the fact that they want the poor to bear a greater share of the tax burden. Those on the left conceal the fact that they want the rich to bear a greater share of the tax burden.
I don’t want to express a view here about what is the “right” level of redistribution. But I do believe that this choice should be made in the light of day rather than in the shadows. And the choice should be made free of a number of received myths about income tax.
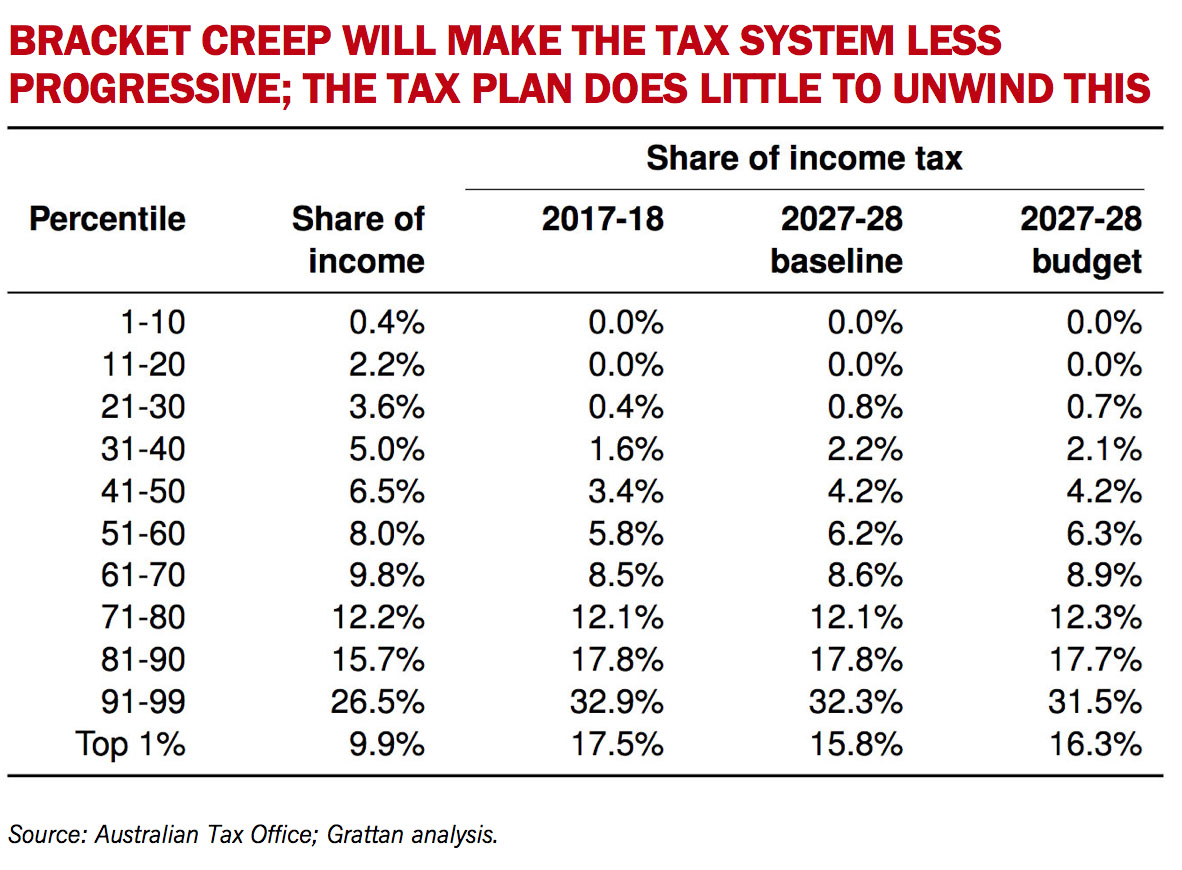
The simplest analysis of redistribution is shown in the first of the charts below. Over the next ten years, overall, bracket creep will move more than 2 per cent of the tax burden from the top to the middle. After the government’s tax plan, almost 3 per cent of the tax burden will be moved from the top to the middle.

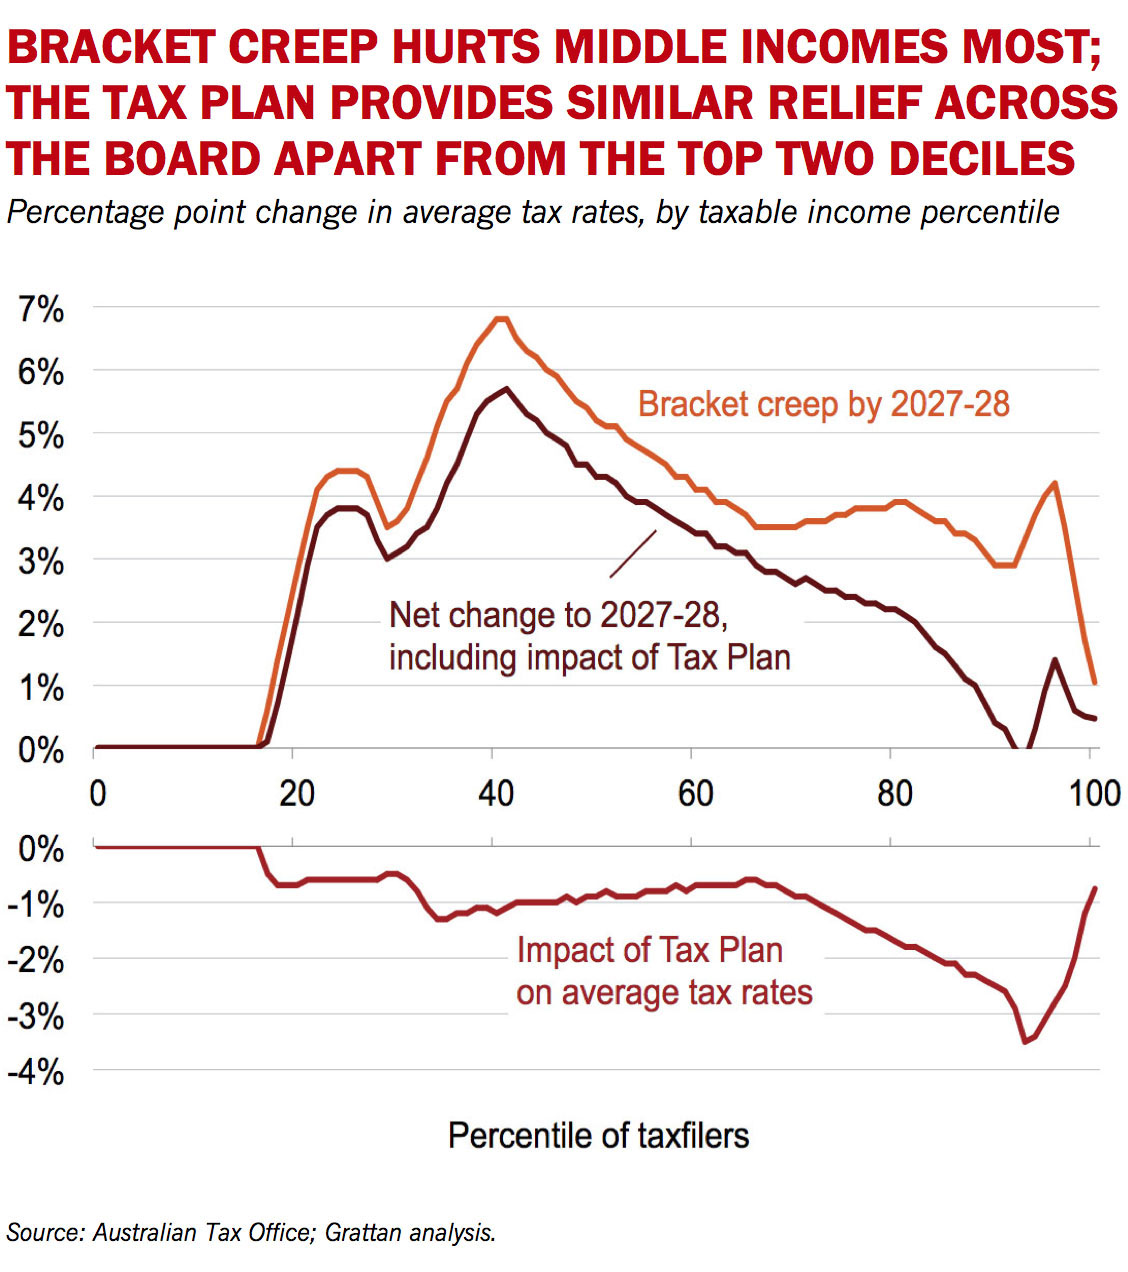
The second chart makes this clearer. It shows how average tax rates would change for people across the income distribution. The top orange line shows the effect of bracket creep over ten years. Those at the fortieth percentile would see their average tax rate increase by six percentage points over ten years. These are true middle-income earners, on around $36,000 a year. For taxpayers between the seventieth and one-hundredth percentile, bracket creep would typically only increase average tax rates by about 3 percentage points.

This brings me to myth 1, that bracket creep hurts high-income earners more. This isn’t true: it hurts middle-income earners most, because they have the biggest gap between their average tax rate and their marginal tax rate (helpfully illustrated on page six of Treasury’s submission).
The middle brown line of the second chart shows how average tax rates will change given bracket creep and the tax plan. Over the next ten years, assuming the plan is implemented, average tax rates will increase for middle-income earners by around four or five percentage points, but will barely move for those in the top 10 per cent of income earners.
The bottom red line shows the difference between the orange and brown lines. It isolates the long-term impact of the tax plan. This shows that the plan reduces average tax rates by about one percentage point for everyone between the twentieth and sixty-fifth percentiles, but reduces tax rates by two to three percentage points for high-income earners between the eightieth and ninety-ninth percentiles. Much of the other available modelling is consistent with these conclusions.
The only modelling I’m aware of that is not consistent is the analysis by Deloittes cited in submissions by the Business Council of Australia, the Centre for Independent Studies and the Institute of Public Affairs to the Senate inquiry into the government’s tax plan. The Deloittes analysis claims that the plan will redistribute about 2 per cent of the tax burden from the bottom to the top. We have tried to reproduce the Deloittes results, but unfortunately we can’t reconcile the numbers. We have taken into account the fact that Deloittes looked at 2024–25 rather than 2027–28, and looked at all adults rather than just everyone who files a tax return. But we still find that bracket creep and the tax plan redistribute about 2 per cent of the tax burden from the top 20 per cent of adults to the second quintile — bearing in mind that the remaining 60 per cent of Australia’s adults don’t pay tax, because most of them don’t work, often because they’re retired.
Instead of looking at whether tax changes are progressive or not, much of the rhetoric about the tax plan focuses on how many taxpayers will be moving into a high-tax bracket. This is myth 2: that the tax system is “hitting the top” because more people are in a high tax bracket. Bracket creep means that the proportion of taxpayers in a high tax bracket increases over time. So, of course, the proportion of tax paid by people in that bracket increases. But at the same time the proportion of tax paid by the top 10 per cent of taxpayers falls.
On the other hand, some have attacked these tax cuts as unfair because they are bigger for high-income earners. This is myth 3. In reality, a moderately progressive tax change overall would still give more to high-income earners, in absolute dollars, as a percentage of the budget cost and as a percentage of post-tax income. Those on higher incomes pay a higher proportion of the tax take, so pretty much any tax change — including a highly progressive change — will give them a bigger tax cut, at least in absolute dollars. Those who claim that the tax cuts are unfair using these analyses need to explain why they think it is inherently “fair” that ultimately a very small number of people should pay all of the income tax.
Finally, I want to look briefly at the economic impact of the tax plan. Many of the submissions to the Senate inquiry assert that a high marginal rate for top income earners has a big economic cost because it discourages people from staying in Australia, depriving Australia of their talent.
This is myth 4. On the contrary, there is no evidence that Australia’s high top marginal tax rates materially affect decisions to work more, or to live in Australia. The recent AfrAsia Bank Global Wealth Migration Review looked at migration of millionaires around the world. It found that 10,000 millionaires moved to Australia last year, and almost none left. This is the highest net migration of millionaires to any country last year — in absolute terms, let alone correcting for population. And this in a year when Australia’s top marginal rate was relatively high, and cut in at a relatively low income. Singapore, with its famous 15 per cent tax rate, only attracted 1000 millionaires.
If you want tax cuts with a big economic payback — and that is not the only reason for income tax cuts — then you would focus the tax cuts on middle-income earners (those earning $50,000, not $80,000). That’s because their decision to work is more sensitive to effective marginal tax rates, after taking into account the withdrawal of welfare benefits and the net cost of childcare. Effective marginal tax rates are typically much higher for middle-income than for high-income households because of our highly means-tested welfare system. This is also the conclusion of the Treasury submission. Incentives for high-income earners matter less because they’re probably working full-time anyway.
To sum up, bracket creep hurts middle-income earners (those on $50,000 a year) more than those on high incomes. Even though more people will be in high marginal tax brackets, high earners will not be bearing more of the tax burden. Tax cuts are not inherently “unfair” just because they give more to those on high incomes than those on low incomes. And while cutting top marginal tax rates in Australia will not materially affect economic outcomes, a tax cut focused on middle-income earners (those on $50,000, not $80,000 a year) will have more of an effect on the economy.
The key facts are that bracket creep will reduce the progressivity of the tax system, and the tax plan doesn’t materially unwind this. Having agreed on that fact base — on which there is a broad consensus — we can argue openly about whether reducing the extra burden on high-income earners, but increasing the proportion of tax paid by middle-income earners, is “fair.”