In the countdown to Tuesday’s federal Budget, speculation over tax cuts is in full swing. But who actually benefits from tax cuts and other goodies announced on Budget night? And who counts as ‘Middle Australia’?
In 2019, Grattan published a cheat sheet showing what Australians earn each year. It was designed to help cut through the complexities and pitfalls that bedevil debates about the winners and losers of different policies.
Today we update our cheat sheet for the 2022 Budget.
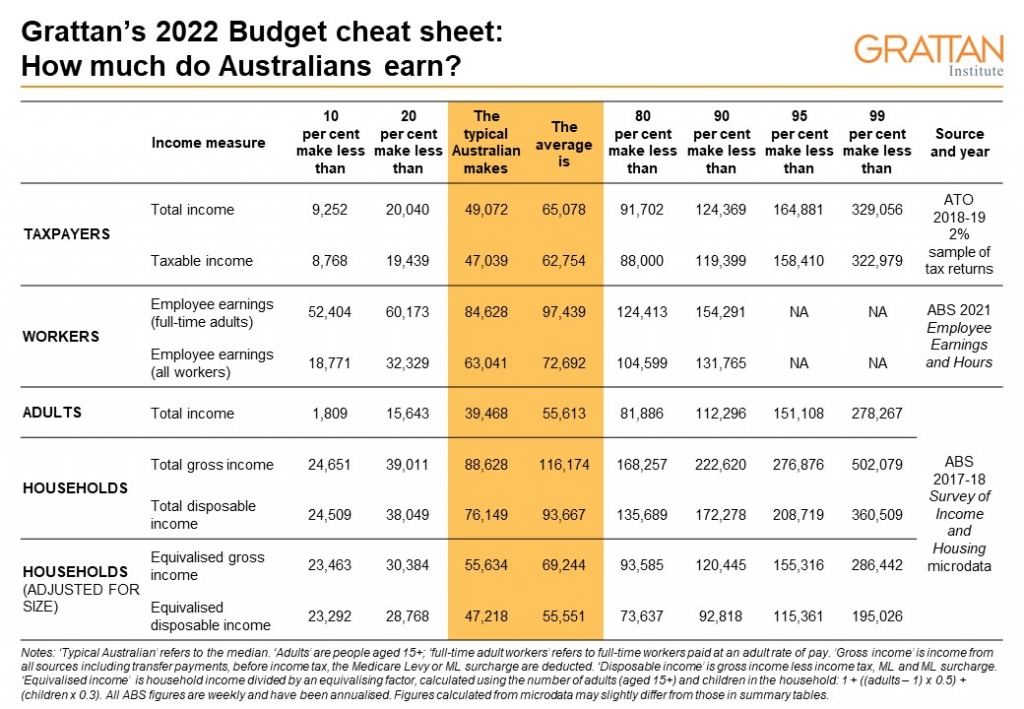
The typical Australian earns a lot less than average full-time earnings
When people look around for an earnings figure representing a typical person, they often quote average full-time earnings. But, as our cheat sheet shows, this figure is not a good guide to the typical Australian’s income.
More than three-quarters of Australian workers earn less than the average full-time wage of $97,439 a year. Most earn less than the average hourly wage, and many only work part-time. The typical full-time Australian worker actually earns $84,628, and the typical Australian worker earns just $63,041.
And more than one-third of Australian adults are not in paid work because they are retired, living with a disability, caring for others, or unemployed. So the typical adult’s income (from all sources) is less again, at $39,468.
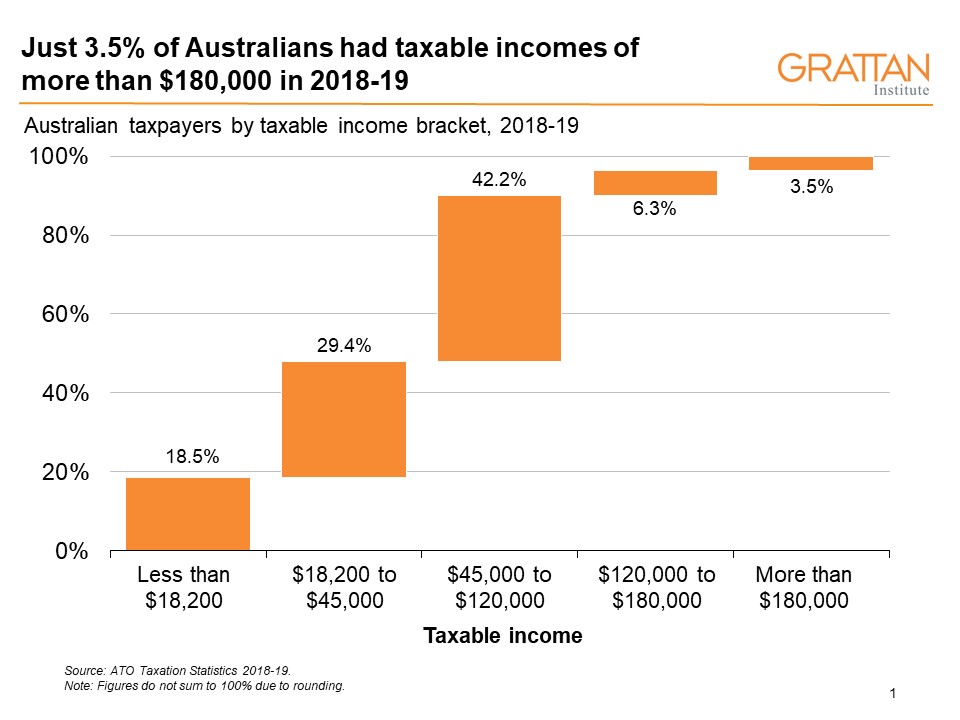
The personal income tax scales are also a poor guide
The tax scales are also a poor guide to the distribution of income. The top tax bracket kicks in at $180,000 a year and is often cited as shorthand for high income. But just 3.5 per cent of taxpayers had taxable incomes that high in 2018-19. Only 24 per cent had taxable incomes higher than $80,000. So a taxpayer with an income of $80,000 is in the top quarter of Australian taxpayers.
Australian Tax Office data on taxable income also has some key gaps. Taxable income reported by the ATO refers to the income we actually paid tax on after taking out deductions for work-related expenses and donations to charities.
These idiosyncrasies matter a lot when debating who wins and loses from policies to change deductions, such as negative gearing. Taxable income also misses people who do not file a tax return, such as wealthy retirees who are drawing on tax-free superannuation, and people on income support whose incomes are so low that they don’t submit a personal tax return.
What about households?
An individual’s income can also be a poor measure of their actual economic circumstances. For example, many people on low incomes have spouses on high incomes. Measuring household income can cut through this, but it comes with a further wrinkle: households need to be adjusted for their size to make an apples-to-apples comparison. This is because larger households share resources, so can get by with less money per person.
The ABS makes this adjustment and reports what it calls equivalised household income. In 2017-18, the typical Australian household reported disposable income of $76,149, but after adjusting for household size, this falls to just $47,218.
Brendan Coates
Joey Moloney
While you’re here…
Grattan Institute is an independent not-for-profit think tank. We don’t take money from political parties or vested interests. Yet we believe in free access to information. All our research is available online, so that more people can benefit from our work.
Which is why we rely on donations from readers like you, so that we can continue our nation-changing research without fear or favour. Your support enables Grattan to improve the lives of all Australians.
Donate now.
Danielle Wood – CEO
