New Grattan Institute research published in The Conversation today shows that economic stimulus, not the closed border, is driving Australia’s unemployment rate to historic lows.
This chart tells the story.
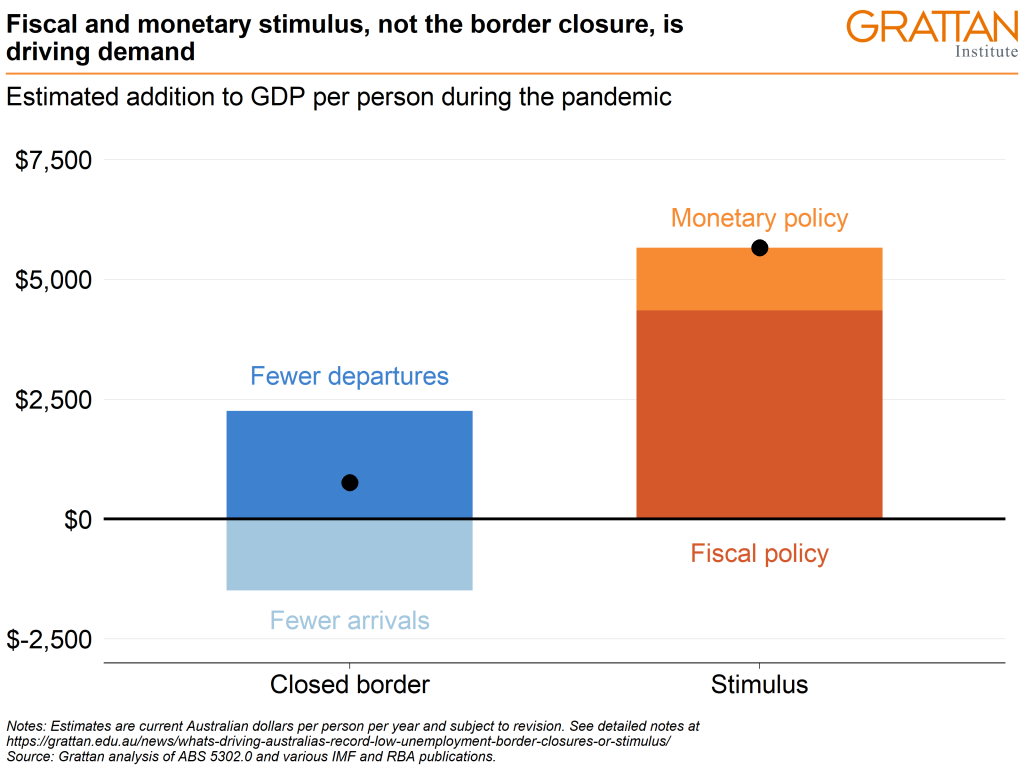
It shows that the effect of stimulus is 7-to-8 times larger than the effect of the border closure.
Of course, our estimates are imprecise, but we are confident that no matter how you do the maths, stimulus is having a much larger effect on the economy than the border closure.
Our approach measures the effects on GDP per person. This captures the additional demand driven by these interventions, while accounting for changes in the population that might have occurred with business-as-usual migration.
Our key findings are:
- Fiscal and monetary stimulus has been very large.
- The reduction in travel and education imports provided a substantial boost to the domestic economy.
- Many incoming migrants, particularly students and working holidaymakers, spend more than they earn in Australia. Not having these people in Australia has weighed on the economy.
- The annual flow of other migrant workers has a negligible impact.
The chart breaks out the size of these effects.
The dark-blue bar captures the decline in travel and education imports as fewer Australians travel abroad, while the light-blue bar captures the decline in travel and education exports and the net effect on labour demand of having fewer migrants in Australia. These effects are clearly swamped by the impact of fiscal and monetary policy (in orange).
For the full story, head to the article. The rest of this post shows how we came up with the figures.
Fewer departures
This is captured by the fall in imports of travel and education services compared to 2019, using the ABS Balance of Payments. We use the ‘tourism related services’ item, which includes expenditure by students. Imports fell from $57.7 billion in 2019 to an annualised average of $1.5 billion since the June quarter of 2020.1
Fewer arrivals
This captures the fall in exports of travel and education services compared to 2019, as well as the net effect of fewer migrant workers. Exports fell from $68.9 billion in 2019 to an annualised average of $27.4 billion since the June quarter of 2020.
The effect of fewer migrant workers is harder to estimate. As noted in The Conversation article, studies tend to find no net impact of migration on unemployment. We use a simple framework to consider a counterfactual GDP per capita with an additional 100,000 migrant workers per year under the following assumptions:
- The additional workers are paid a salary that would otherwise go to an Australian.
- They each earn $53,000 a year after tax, in line with earnings of New Zealanders and temporary skilled workers from the Australian Census and Temporary Entrants Integrated Dataset (adjusted for inflation to 2021 dollars).
- Their savings rate is equal to the average household savings ratio from the National Accounts during the pandemic – an unprecedentedly high 17.2 per cent.
- Their expenditure basket is the same as that of Australians and so 16.6 per cent is spent on imports (derived from the 2021 CPI weights and Jacobs and Williams (2014)).2
- All income not saved or spent on imports is spent on domestic goods and so becomes income for Australians.
The baseline measure is GDP per capita ($1.95 trillion over 25 million people). The counterfactual measure adjusts GDP for the additional spending of migrant workers and adjusts population for the additional workers. The difference is the net direct effect, which suggests that migrant workers would have reduced GDP per capita through savings and purchases of imported goods. The total ‘loss’ of these savings and imports is an estimated $2 billion per year.
An additional 100,000 workers with these characteristics is an upper bound. The largest falls in visa classes are for working holidaymakers and students. The latter are already captured in the trade figures. It is unclear whether working holidaymakers are captured in the scope of the Balance of Payments statistics. But in any case, working holidaymakers typically spend more than they earn in Australia – so having fewer enter the country is a net loss for GDP. We omit this class of visa-holder from estimates of the direct effect and assume they are captured in the trade data.
The estimated direct effect of fewer migrant workers is an unrealistic upper bound. We deliberately stack the cards against our key message. Yet the takeaway is clear: the direct effect of migrant workers is small.
Fiscal stimulus
We use the IMF figure of $362 billion, apply a fiscal multiplier of 0.6, assume it occurs over two years, and divide by the population to estimate an effect on GDP per capita. The fiscal multiplier is conservative, but also uncertain given issues with the distribution of JobKeeper, the range of fiscal interventions used, and restrictions on economic activity during lockdowns.
Monetary stimulus
This captures a cash rate reduction of 65 basis points, $350 billion of quantitative easing (QE), and the $188 billion term funding facility (TFF). We ignore yield curve control, and the assumptions we use probably understate the effects, again stacking the cards against our key message.
Estimates rely heavily on RBA publications, particularly Guttmann, Lawson, and Rickards (2020), who use the MARTIN model to predict the effect of various interest rates on activity. QE is assumed to work entirely through its effect on interest rates (longer-term bond yields and the subsequent pass through to other rates), which is consistent with the international literature. Graph 6 of Guttmann et al (2020) indicates that a 60 basis-point reduction in the cash rate leads to a 0.95 per cent increase in GDP after two years. Similarly, a 50 basis-point reduction in other rates (longer-term bond yields, business lending rates, and mortgage rates) leads to a combined 0.95 per cent increase in GDP after two years. The estimated effect of other rates is much smaller than the international literature on QE – Gagnon and Sack (2018) report a rule of thumb that 10 basis points on long rates is equivalent to 25 basis points on US federal funds rate.
The effect of bond purchases on bond yields is taken primarily from Finlay, Titkov, and Xiang (2021), who find that QE reduced bond yields by about 30 basis points. This does not capture the full extent of the program (running until mid-February 2022) and is also a smaller effect than suggested by the international literature on QE. Gagnon and Sack (2018) report a rule of thumb that purchasing bonds worth 1.5 per cent of GDP reduces bond yields by about 10 basis points. (The Reserve Bank’s QE program purchased bonds worth about 18 per cent of GDP, which would translate to a reduction of 120 basis points.) We assume the 30 basis-point decline in bond yields flows through to equal reductions in business and mortgage rates.
Black, Jackman, and Schwartz (2021) detail how the TFF decreased the cost of funding for banks, which then flowed on to business and mortgage rates. But it is hard to separate the effect of the TFF from reductions in the cash rate and yield curve control. As part of the program, banks were incentivised to extend lending to business, resulting in $35 billion of new lending. We take this as adding directly to GDP, and we ignore other effects of the TFF. This probably overstates the effect of the TFF relative to the other interventions, but it provides some counterbalance to the otherwise understated effects.
The total effect of these monetary policy actions might add about $66 billion to GDP over two years. This estimate has substantial uncertainty given that most of the actions taken had never been implemented in Australia before.
Footnotes
- Unless stated otherwise, none of the data throughout the estimates are adjusted for inflation, because this would suggest unrealistic precision.
- The import share of CPI probably changed during the pandemic, but the effect on our estimates is likely to be small.
While you’re here…
Grattan Institute is an independent not-for-profit think tank. We don’t take money from political parties or vested interests. Yet we believe in free access to information. All our research is available online, so that more people can benefit from our work.
Which is why we rely on donations from readers like you, so that we can continue our nation-changing research without fear or favour. Your support enables Grattan to improve the lives of all Australians.
Donate now.
Danielle Wood – CEO
