Published at The Conversation, Thursday 15 December
It’s a time-honoured tradition for older and younger generations of Australians to argue about whether government is treating them fairly.
Our report Age of Entitlement, released last month, was aptly named. No-one denied its conclusions: senior Australians get tax breaks unavailable to younger Australians worth A$1 billion a year – and that’s not even counting the tax breaks from superannuation. Instead, many seniors argued that they were entitled to a better deal.
This sense of entitlement is based on genuine views that today’s seniors have done it tougher than the generations coming after them. Many seniors believe that they’ve paid higher taxes and the government is paying for family benefits and childcare they never got. They believe they’ve borne the brunt of budget cuts over the last few years. And to the extent that they’ve accumulated wealth, they believe they paid higher mortgages rates and saved harder to get there.
Many younger people have a different take. Fewer of them can afford to buy a house. University debts hang around their necks. Secure employment is harder to find. And they’re acutely aware that someone will have to pay for recurrent budget deficits, and “someone” is likely to be them.
It’s unproductive if generations just talk past each other. But it wouldn’t be the first time. Both older and younger generations have factoids for their point of view, so they’re unlikely to back down. But it might be helpful if everyone could see the bigger picture to understand what’s going on.
Higher taxes
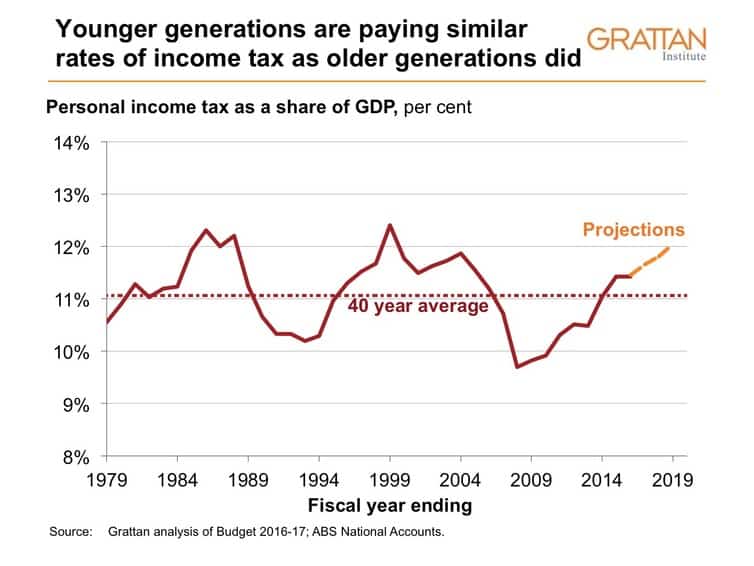
In a typical discussion, grandpa might say that he paid higher rates of income tax than today. If so, grandpa was working very hard. The top rate of personal income tax in 1985-86 was 60%, but it only applied if grandpa earned more than A$35,000. It mightn’t sound like much, but adjusted for higher incomes that’s A$161,000 in today’s money.
To understand the overall burden of income tax on an entire generation over a working life, one can look at income taxes as a share of the economy (see chart below). It’s a little higher today than the average of the past four decades. The average grandfather paid a little less income tax than today. If budget forecasts are to be believed, income taxes will be close to the peaks of the late 1980s and 1990s within the next three years.
Irrespective of who has paid more tax in the past, some seniors argue that after a lifetime of paying tax they shouldn’t have to keep doing so once they retire.
If great-grandfather is still alive, he might interrupt at this point. Previous generations of retirees did not opt out of the tax system at age 65. In fact, 20 years ago almost twice as many older Australians paid personal income tax as do today.
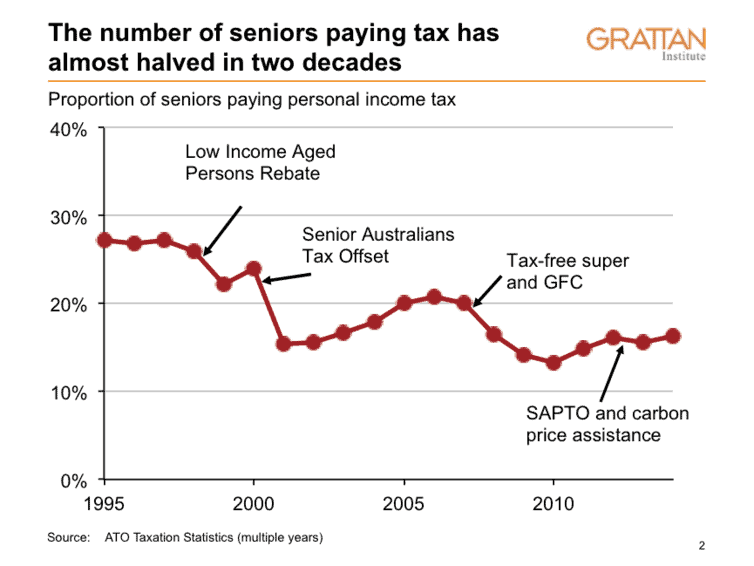
The number of over 65s “taxed-nots” increased because the Howard government abolished taxes on superannuation withdrawals for those aged over 60 years in 2007, and introduced much more generous tax offsets only available to older Australians – such as the Seniors and Pensioners Tax Offset.
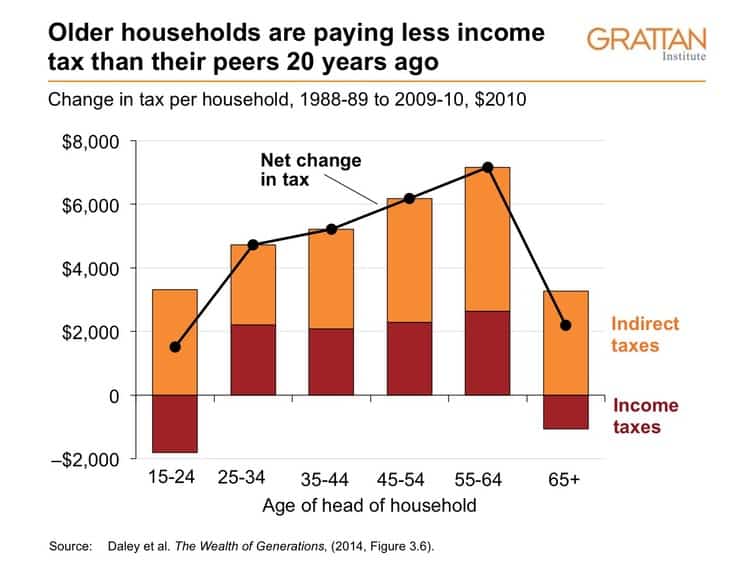
Not only do fewer seniors by number pay income tax; but on average senior households also pay a lower amount of income tax in real terms today than senior households 20 years ago, even though both their workforce participation rates and their incomes have jumped.
In any case, developed countries today can’t afford an entire generation that stops paying tax. Because of the baby boom, over-65s are a rapidly increasing share of the population. And with rising life expectancies they will spend more of their lives not paying tax.
Keeping the intergenerational bargain
At the same time, over 65s can expect to be drawing on government support (particularly health care) for much longer than previous generations.
Grandma will doubtless say that younger generations have always looked after older generations. Older households have always received more benefits (welfare and in-kind services such as health) from government than they paid in taxes. Under the intergenerational bargain, government has always been a “piggy bank” transferring resources from younger working households to older retired households.
But the intergenerational bargain has become a lot more skewed over the last decade. In 2004, the average senior household took about A$22,000 more out of the government tin in services and welfare payments than it contributed in sales and income taxes. By 2010 the net take had jumped by almost A$10,000 in today’s money to A$32,000 per senior household. Meanwhile the net contributions of other age groups reduced somewhat (see chart below). The cost of these increased transfers to older households was about A$22 billion a year, or about half the Commonwealth government’s annual budget deficits of recent years.
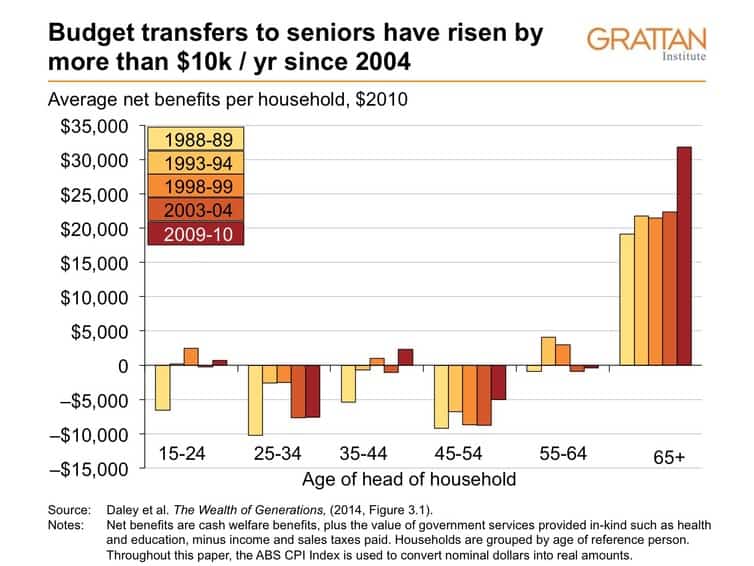
Part of this jump was higher health spending such as government spending on doctors, hospitals, subsidised medicines via the Pharmaceutical Benefits Scheme, and subsidised pathology services. Real spending on health has doubled for a person of a given age over the last 20 years. And so government spending on a 70 year old has gone from A$5,800 to A$10,700 in the last 20 years.
Overall, the net take by older households has increased even further because they are also paying less tax.
This might have seemed affordable while the mining boom boosted government revenues. But today’s budget deficits and much slower economic growth suggest it is unsustainable. More is being taken from the piggy bank than anyone is putting in.
Families are getting more – and seniors more again
At this point, grandpa is likely to point to all the extra spending for families that wasn’t there a generation ago – family payments, childcare benefits, and the like.
In terms of the changes over the last 15 years, it is true that budget giveaways to families with children in the 2000s under Howard were much bigger than the giveaways to seniors. But one of the quiet successes of the Rudd/Gillard governments was to wind back much of these extra family benefits, restricting the payments more tightly to families in genuine need.
The cumulative cost to today’s Commonwealth Budget of decisions over the past 15 years to expand support for families and seniors is now almost identical, with each now costing the Budget around A$8 billion a year.
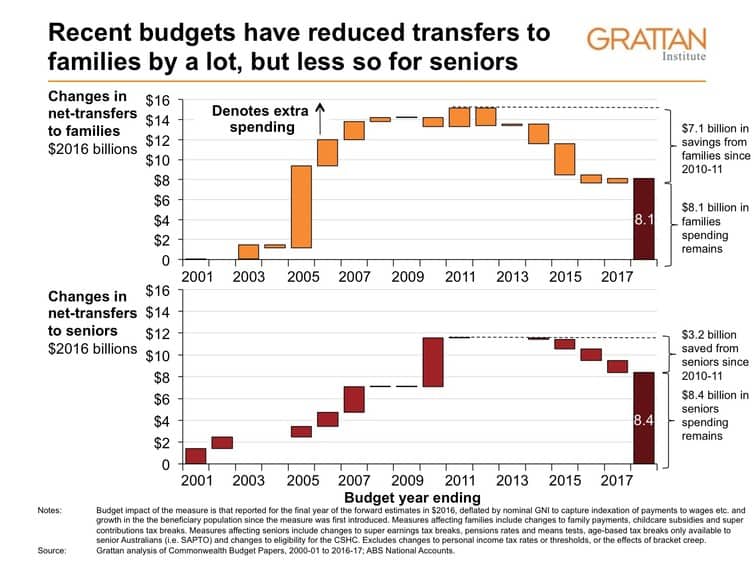
And there’s a crucial difference. Some of the remaining net increase in transfers to families is for childcare (A$1.6 billion). The evidence is overwhelming that increased support for childcare tends to increase how much women work when they have children. As the Commonwealth government has increased support for childcare, a greater proportion of women with young children now work.
Seniors are bearing a (small) share of the budget repair burden
Grandma may well complain that government has made a series of decisions over the last three budgets that have affected seniors such as tightening the Age Pension assets test, and winding back superannuation tax breaks. But decisions affecting families, symbolised by axing the Baby Bonus, have been even larger over the last three years – and bigger again once you include the three years before that.
The reality is that no-one can really complain. The only way to reduce persistent budget deficits of around A$40 billion a year is for government to tighten the belt and increase taxes in ways that are going to affect pretty much everyone.
This analysis doesn’t include bracket creep, which technically doesn’t count as a budget measure, even though it has made the biggest contribution to budget repair. Over the last eight years, bracket creep has been largely unchecked, and has largely reversed the mid-2000s personal income tax cuts. And of course bracket creep affects working families much more than seniors.
Higher mortgage rates
Ah, says Grandpa, but you younger generations have had it easy with global interest rates at their lowest in at least 5,000 years. People who lived through the late 1980s will never forget paying mortgage rates of 17%.
But interest rates are only one part of the housing affordability story. The pain of mortgage repayments also depends on how much you paid for the home, and how fast the loan gets eroded by inflation and rising wages. The typical home today costs four times a typical household income. 20 years ago it was only 2.5 times. And inflation in the 1980s averaged 8.4%; whereas inflation today is around 1.5%.
The bigger picture looks at how much of a household’s income goes to paying off the mortgage (see chart below). And mortgage interest payments today eat up more of a household’s income than in 1989 when interest rates peaked. And of course today’s borrowers are much more vulnerable: if interest rates rise from today’s historic lows, their interest payments will spiral to record levels.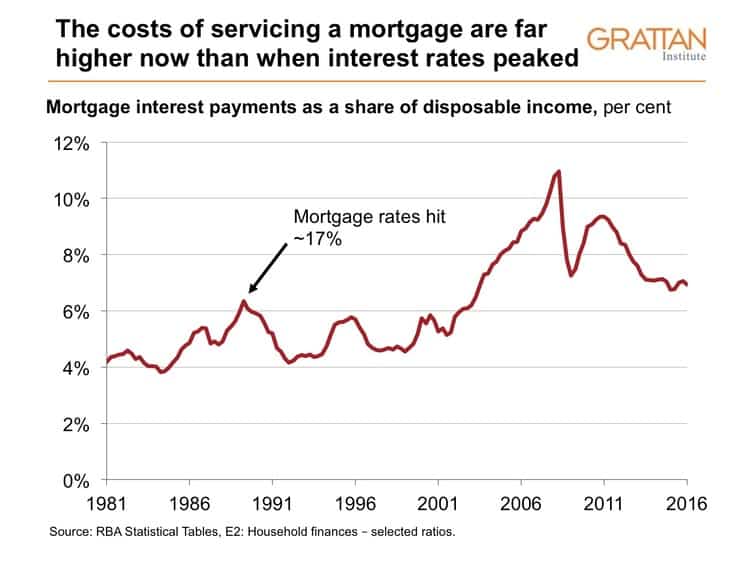
As a result, younger generations today are much less likely to own their home than younger generations in the past.
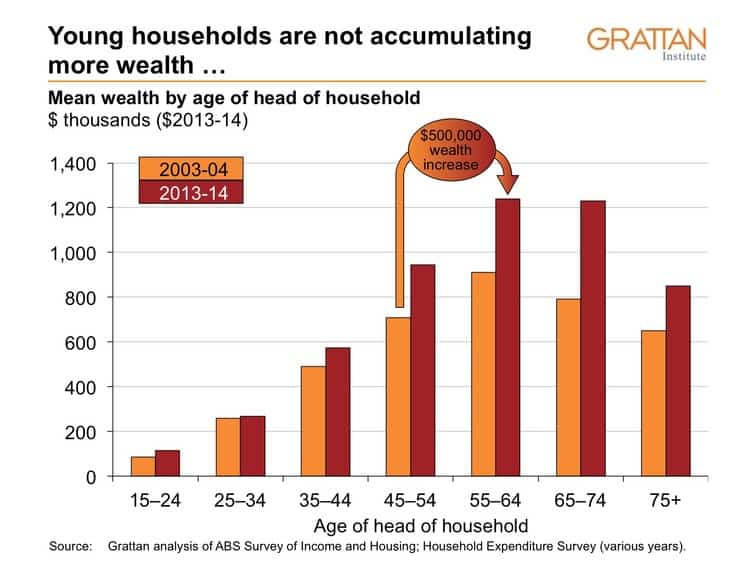
Housing is part of a bigger picture: seniors are taking an increasing share of the country’s wealth. Between 2004 and 2014, seniors households (over 65) increased their share of total wealth from 25% to 30%. Despite the global financial crisis, households aged between 65 and 74 years today are A$400,000 (or 47%) wealthier in real terms than households of that age ten years ago. Households aged between 45 and 54 in 2004 increased their average wealth by about A$500,000 over the subsequent decade.
“We saved harder”
Yes, says grandma, and that’s because we scrimped and saved while you ate too many smashed avocadoes. Well, perhaps. But on the numbers, households of all age groups are saving much more today than in 2004.
The real advantage for older households was that they were in the right place at the right time. They already owned assets when interest rates fell in a move that probably won’t repeat for several generations. And this fall in interest rates pushed asset values upwards. By contrast, households aged 25 to 34 years typically bought both housing and superannuation assets at these higher prices, missing out on the free kick.
Everyone would like to believe that their prosperity is the result of hard work. And hard work by individual households does make a difference. But no generation really works that much harder than its predecessor. The reality is that luck has played a big part in creating a generation much wealthier than its parents, and probably wealthier than its children.
So what should we do now?
There may well be vociferous agreement that budget repair remains a priority with the Commonwealth government spending A$11 for every A$10 in revenue. Winding back expenses or increasing revenues by 10% is a big ask, and it won’t happen unless people from all generations contribute.
That includes seniors, many of whom continue to be on a very good wicket. Even after the Turnbull government’s superannuation package, most retirees will still pay no tax on their super withdrawals or earnings. We continue to have age based tax breaks that result in many younger workers paying more tax than seniors on similar incomes.
Of course if great-aunt Agatha hasn’t got much, and her main income is a full Age Pension, she shouldn’t pay income tax – and nor should younger Australians on similarly low incomes. That’s how a progressive personal income tax system is supposed to work. But if grandpa has income from investments plus a part pension, so that he’s got more to live on than his granddaughter on a basic wage of A$35,000, it seems fair enough that grandpa should pay at least as much tax as his granddaughter.
As we’ve seen, grandpa probably didn’t pay more income tax over his life, is paying less income tax in retirement than his parents, is benefiting far more from government services, has not borne a disproportionate share of budget repair over the past few years, didn’t spend more of his income paying back the mortgage, and may well own assets that his grandchildren will only dream about.
There will always be a generation gap. We can narrow it if each generation understands the facts behind the other generation’s point of view. And on the numbers, grandpa is getting a pretty good deal from government.
![]()
 Published at