Orange Book 2025: Policy priorities for the federal government

by Aruna Sathanapally, Sam Bennett, Peter Breadon, Brendan Coates, Jordana Hunter, Tony Wood, Kate Griffiths

16.03.2025 report

Chapter

Overview

Elections are our opportunity to set Australia’s path. This report charts the path to a more prosperous Australia: the policies that should be on the agenda of whoever wins the 2025 federal election.

This election is being held at a time of great uncertainty. The international rules-based order is under siege, and the world is more unstable than it has been in decades. The impacts of climate change are showing themselves. Many Australians, having only recently emerged from a global pandemic, have faced significant financial pressures from rising living costs. But Australia has successfully navigated the crises of recent years while avoiding mass job losses and bankruptcies.

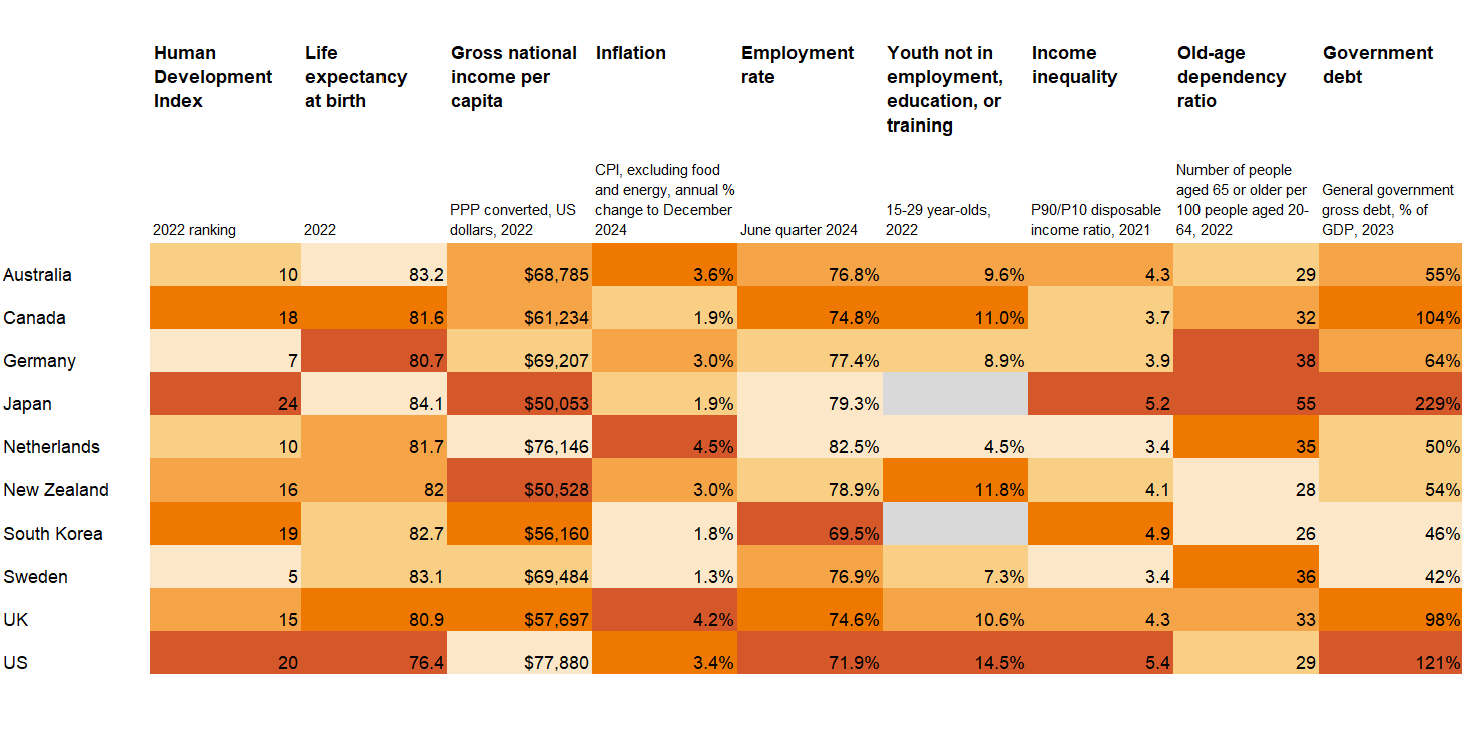
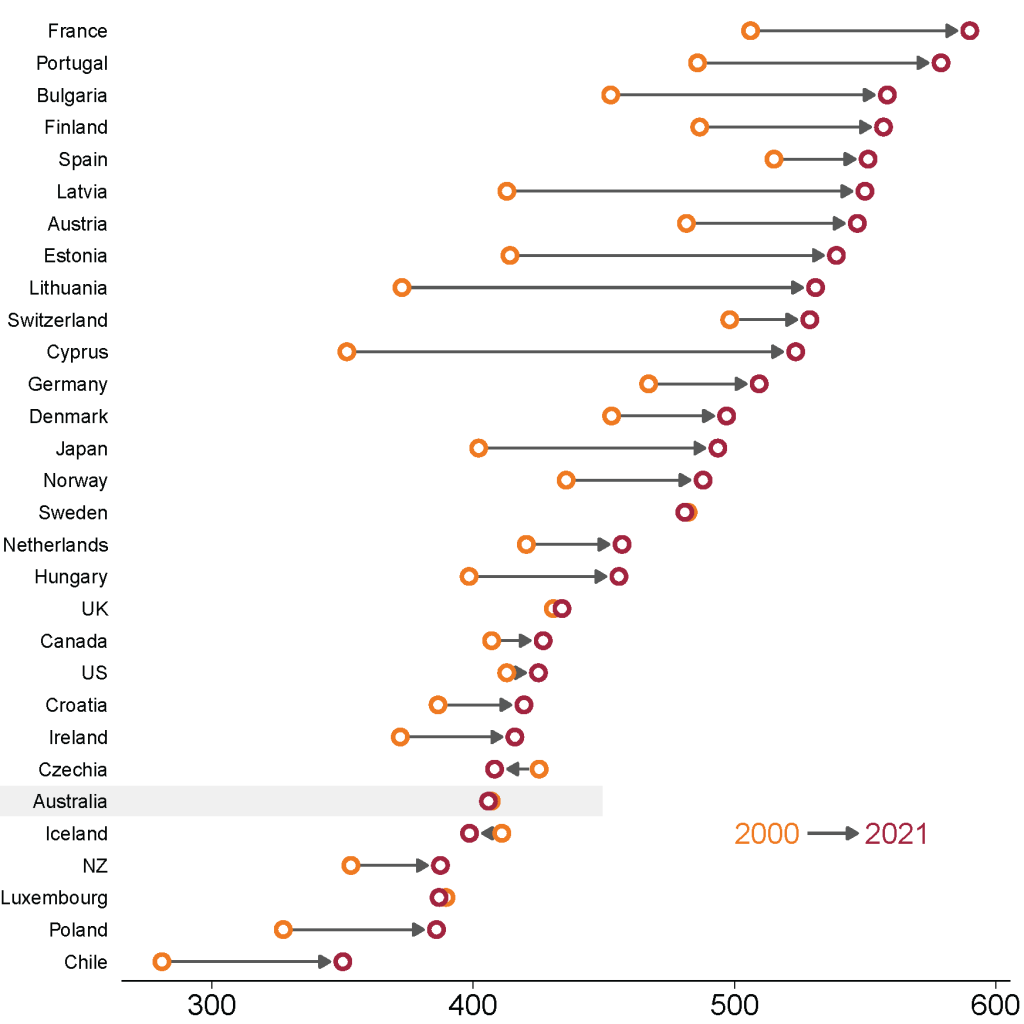
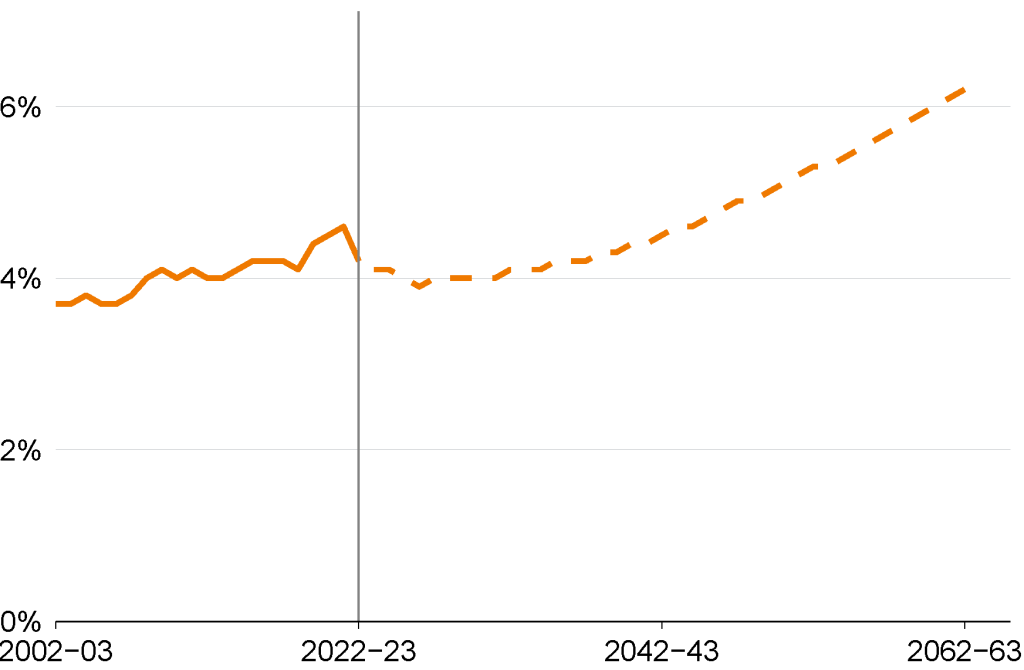
With inflation having fallen, it is our long-standing challenges that await: an ageing population, growing demand for health and care, a housing system that doesn’t serve our most basic needs, weak productivity growth, and the urgent imperative to decarbonise our economy. These are challenges we share with many other countries – and Australia is better placed than most to meet them.

This report offers a policy blueprint to improve living standards for all Australians, now and in the future. Fortunately, Australia is not starting from scratch – progress is being made on several fronts, but governments will need to stay the course on necessary but difficult reforms, and tackle others left in the too-hard basket for too long.

Productivity growth is the key to raising our living standards in the long term. While the federal government doesn’t hold all the levers, it can strengthen the foundations: a competitive economy, a well-functioning labour market, the conditions for people to flourish (housing, health, education, and social cohesion), and the right infrastructure, tax, and regulatory settings.

The transition to net zero presents opportunities for new high-value industries that use renewable energy. Implementing electricity and gas market reforms and comprehensive industry policy will be essential to realising them and avoiding a disruptive and costly transition later.

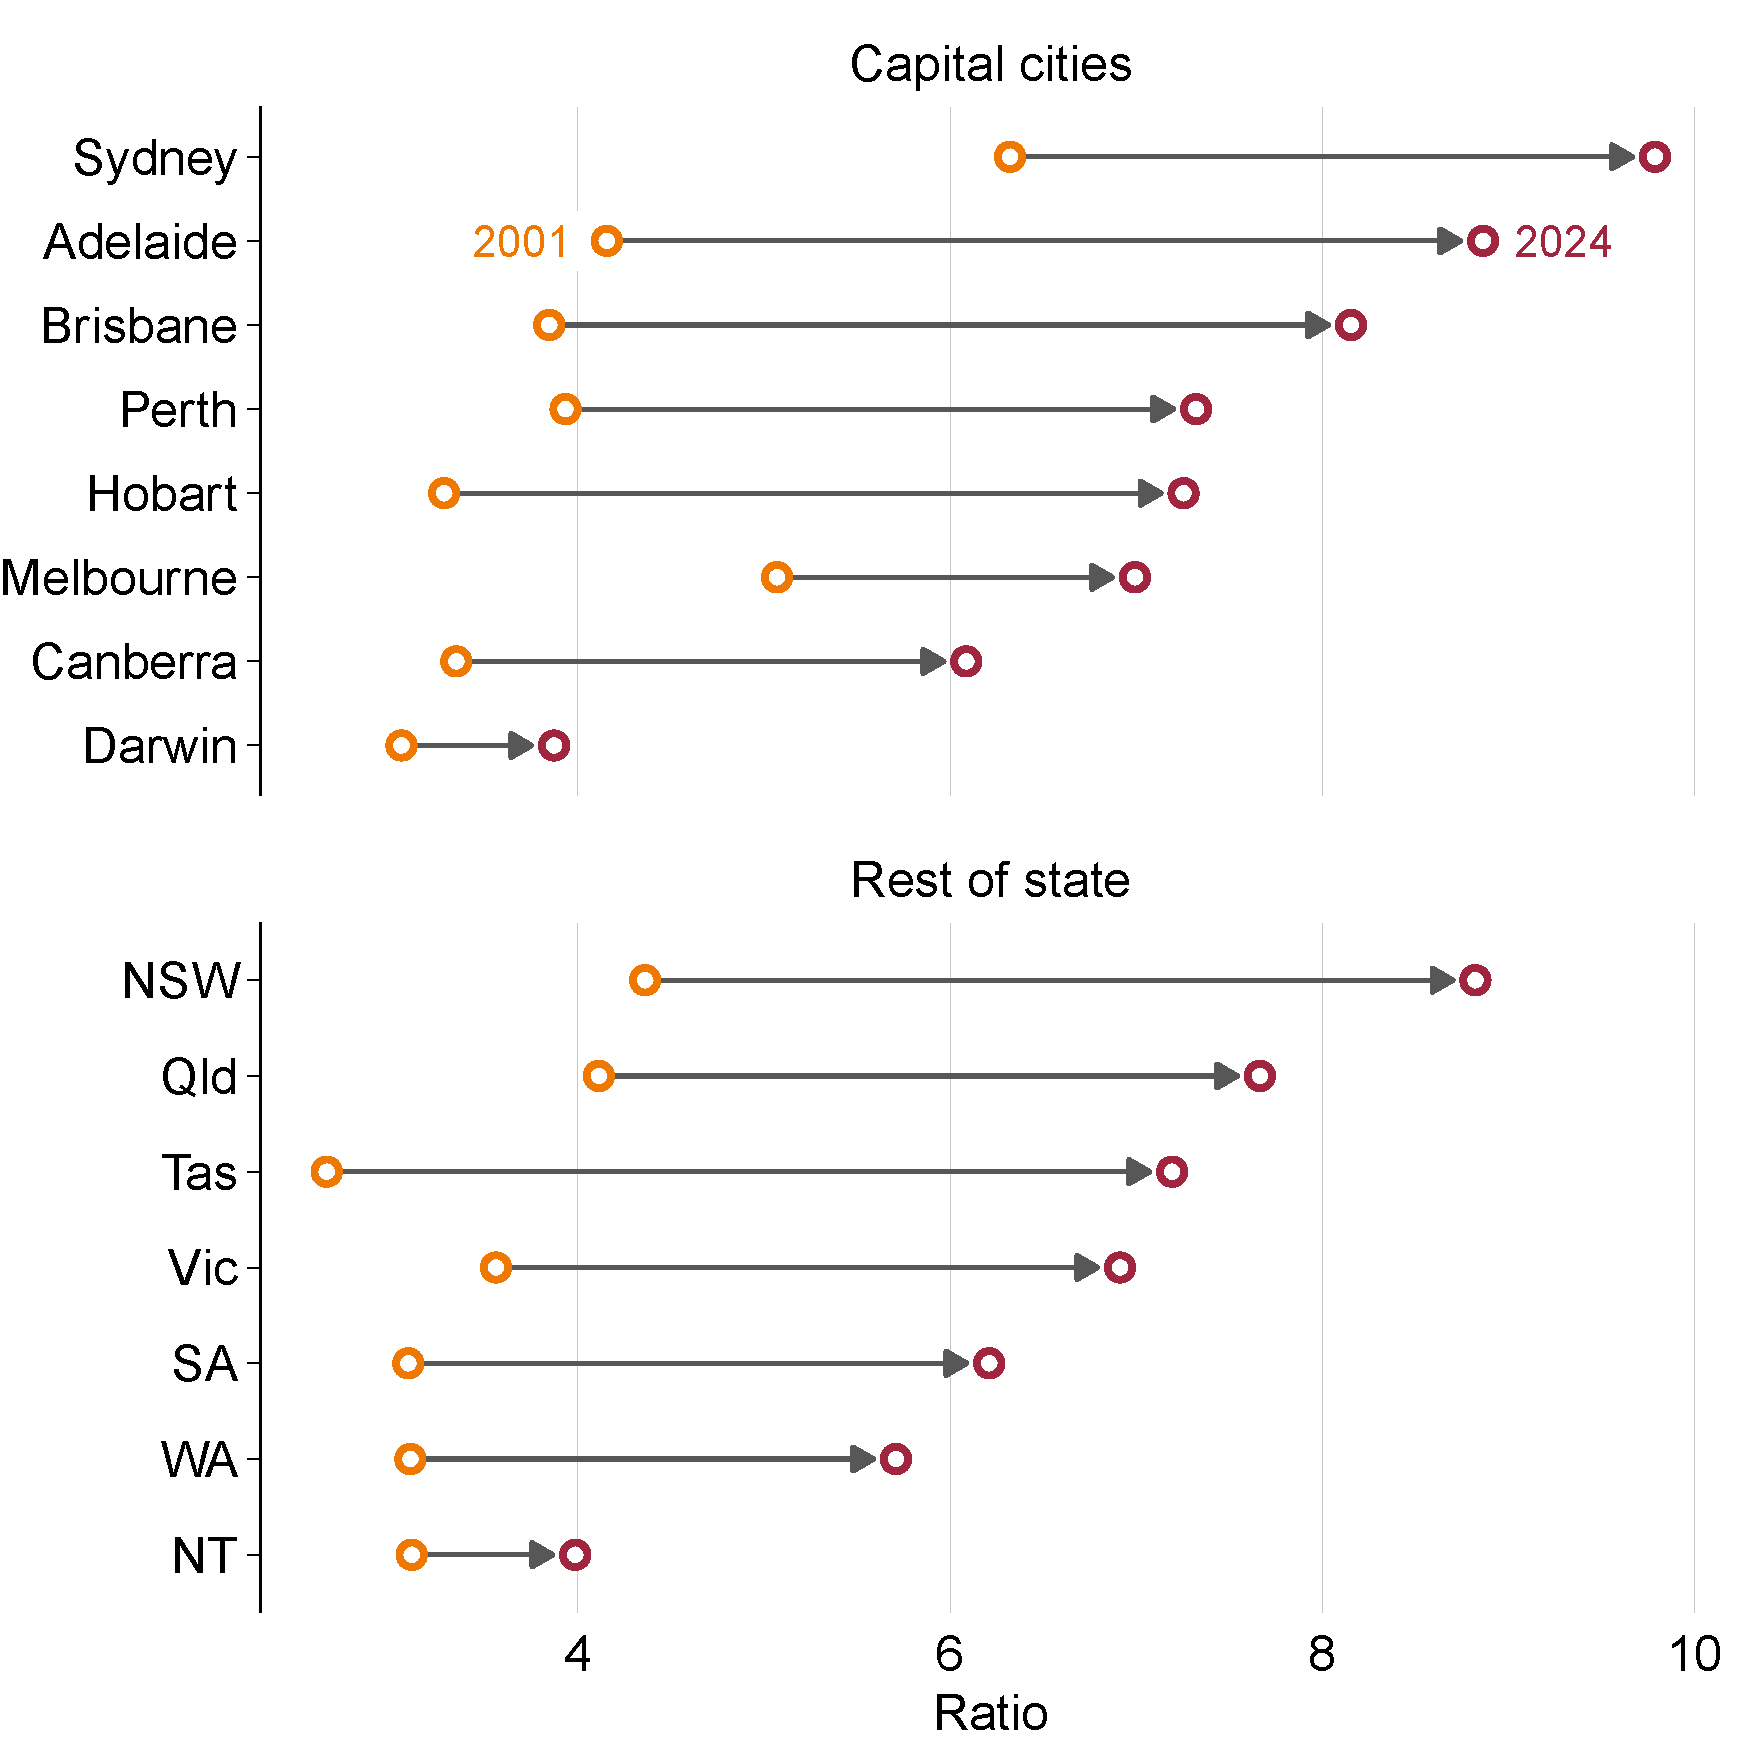
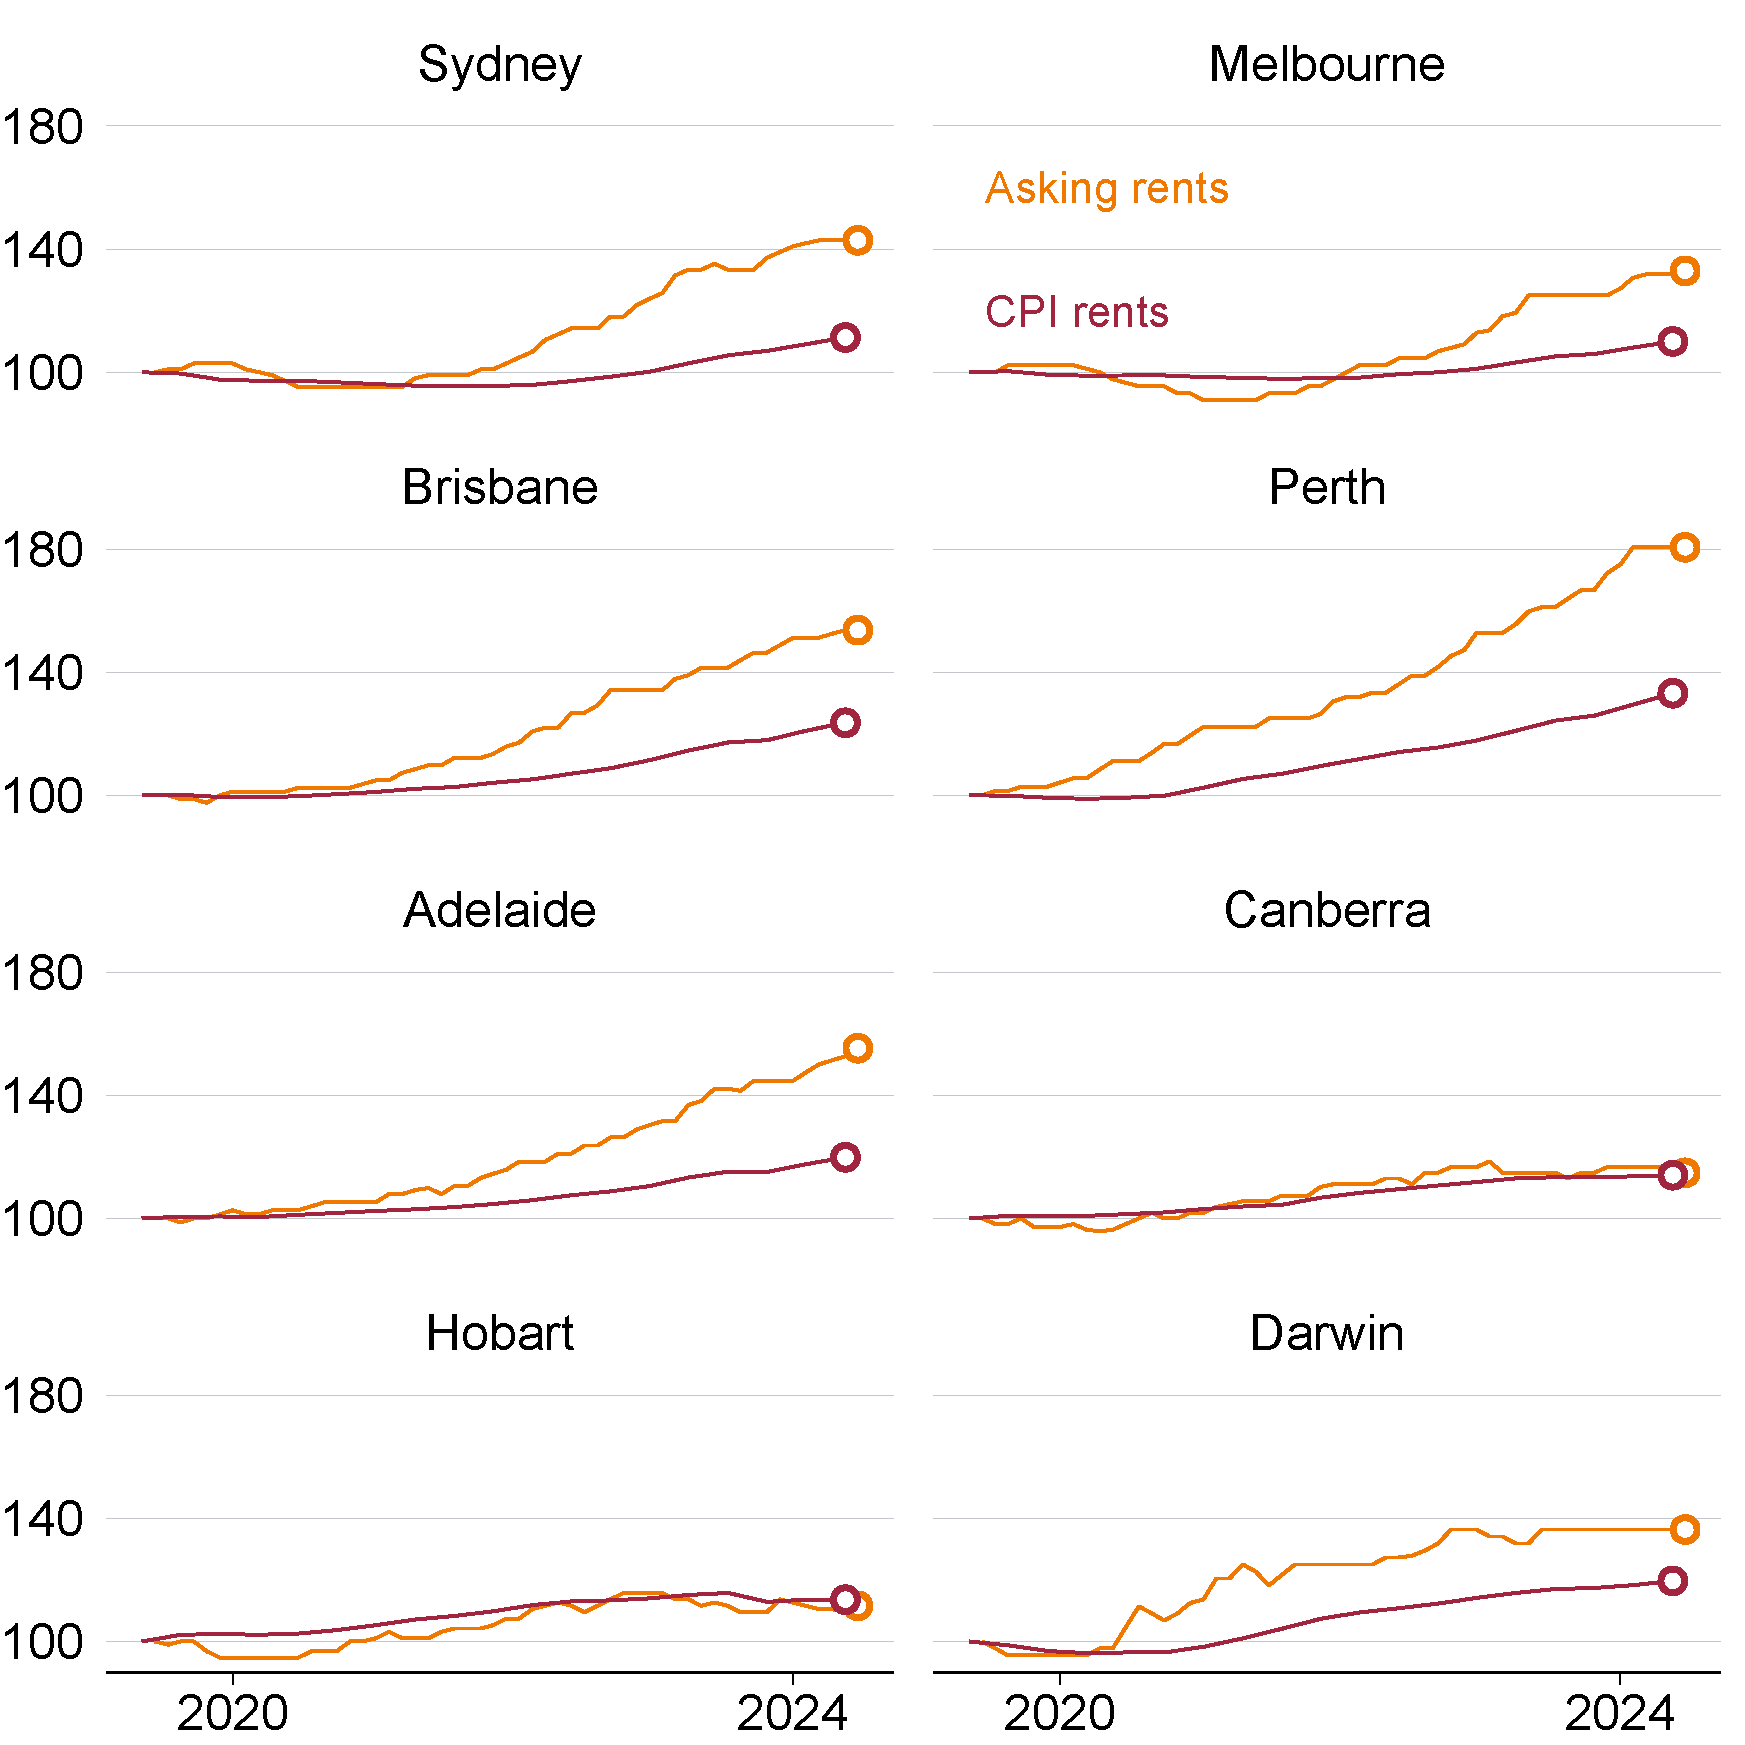
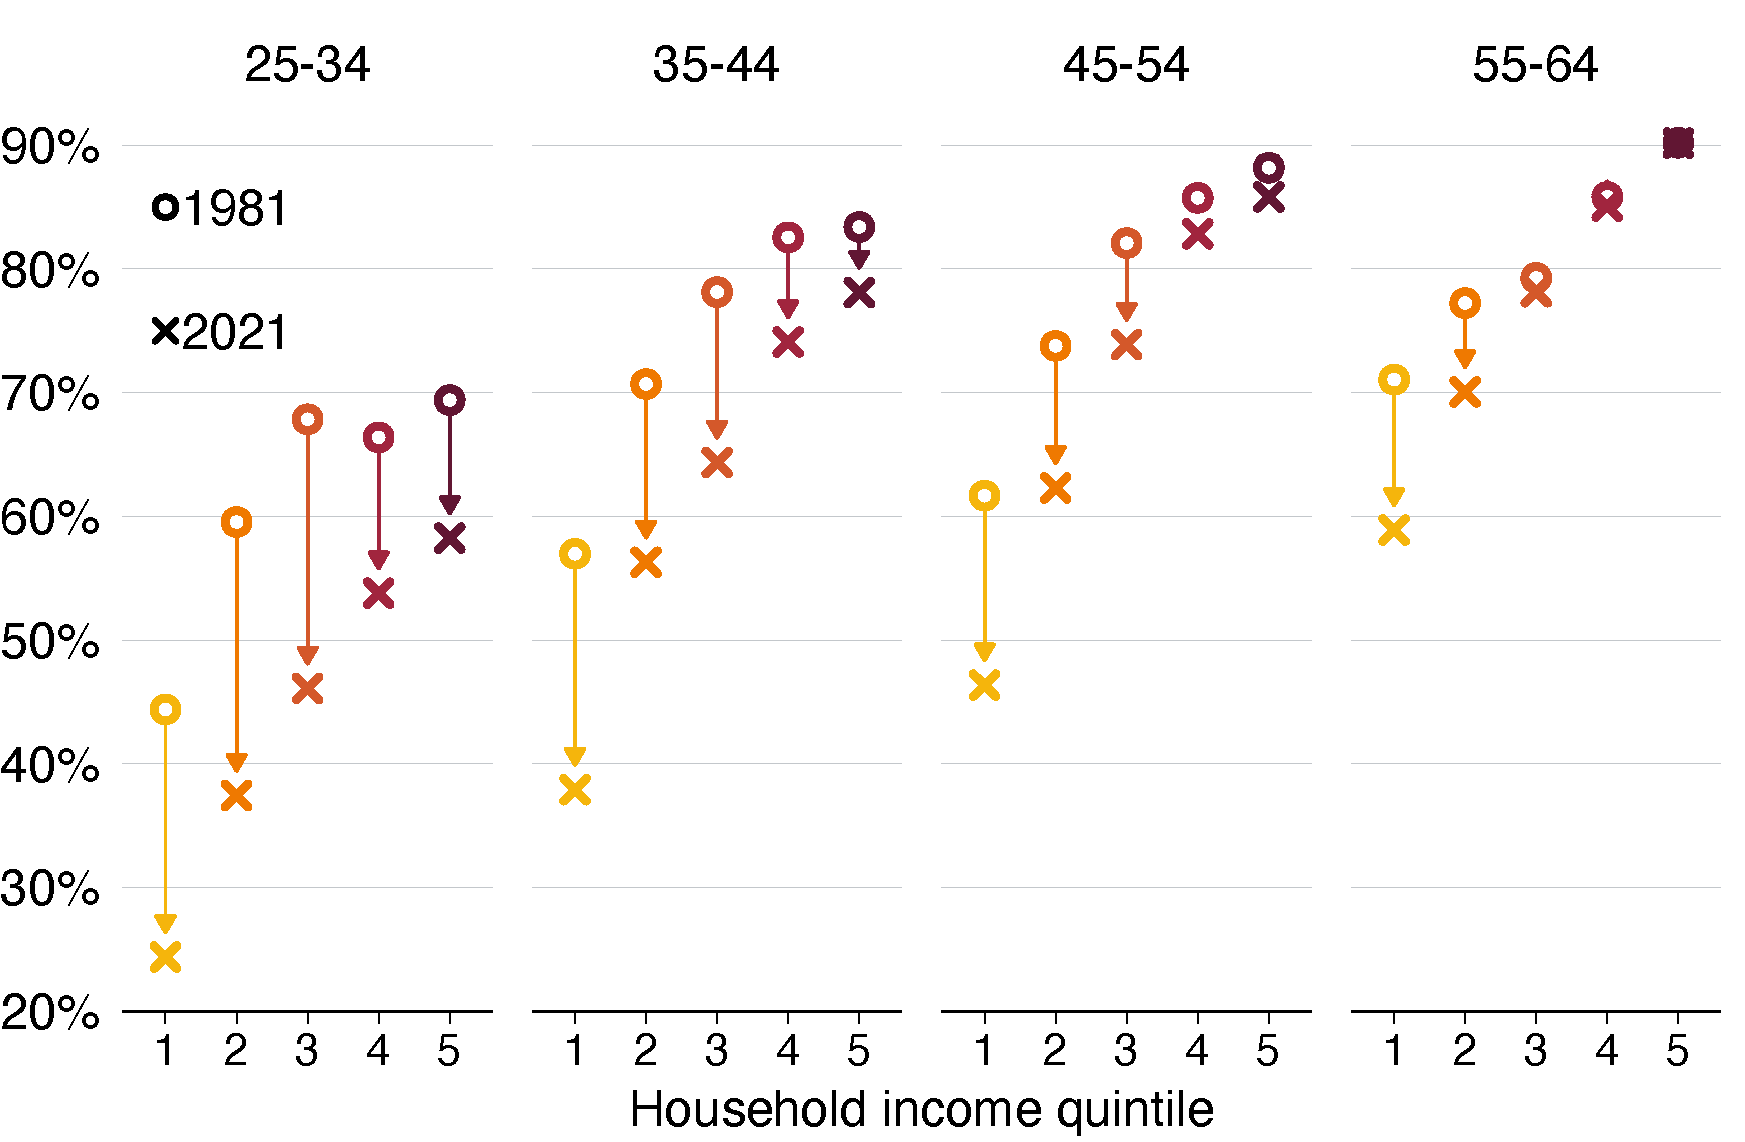
Australia’s housing problems have been decades in the making. Making housing more affordable is a social and economic imperative, and will require relaxing planning constraints, boosting supply, and supporting mobility.

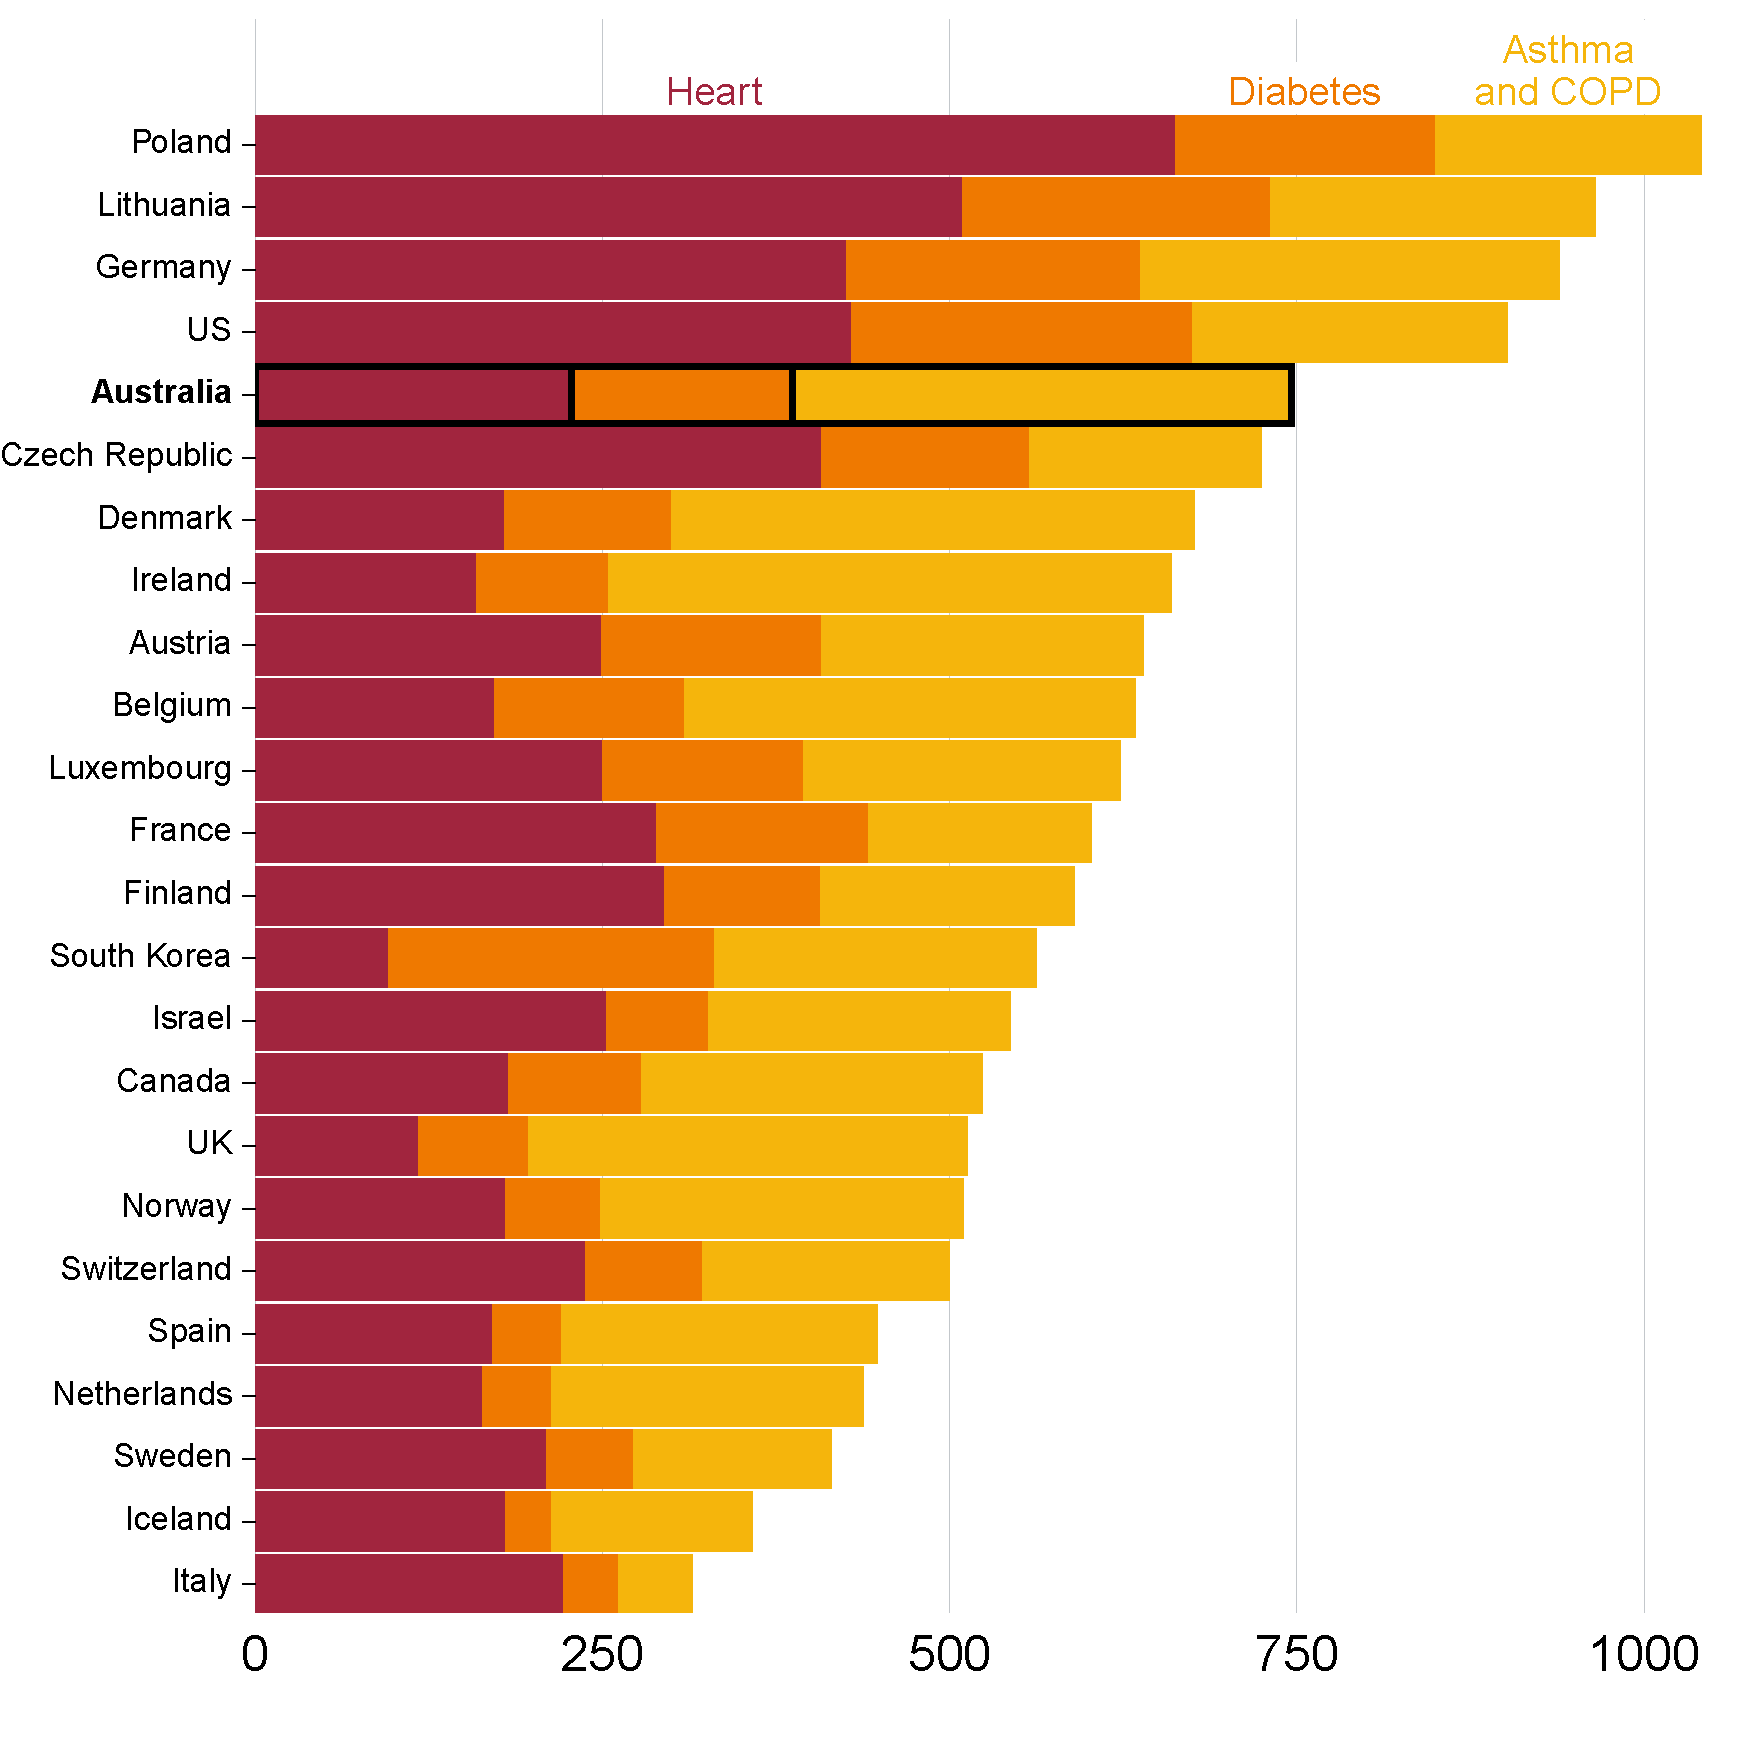
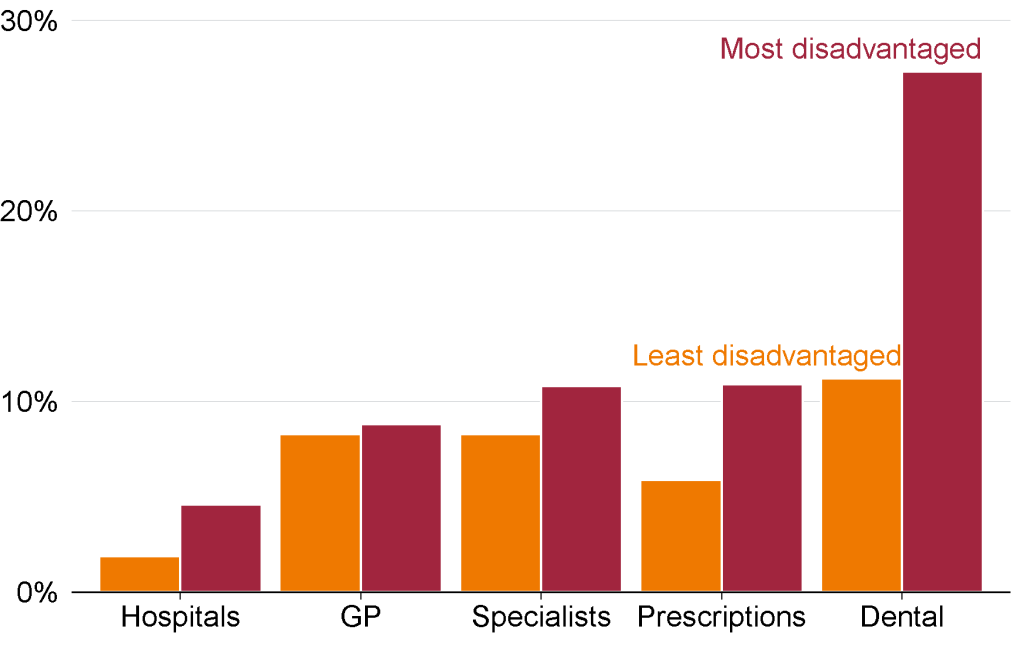
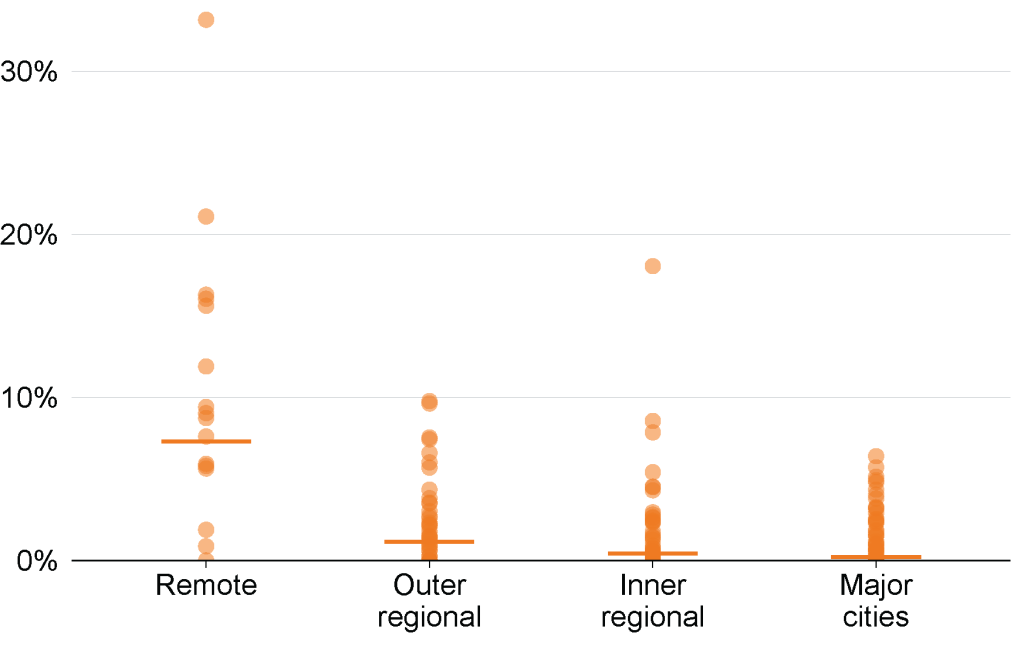
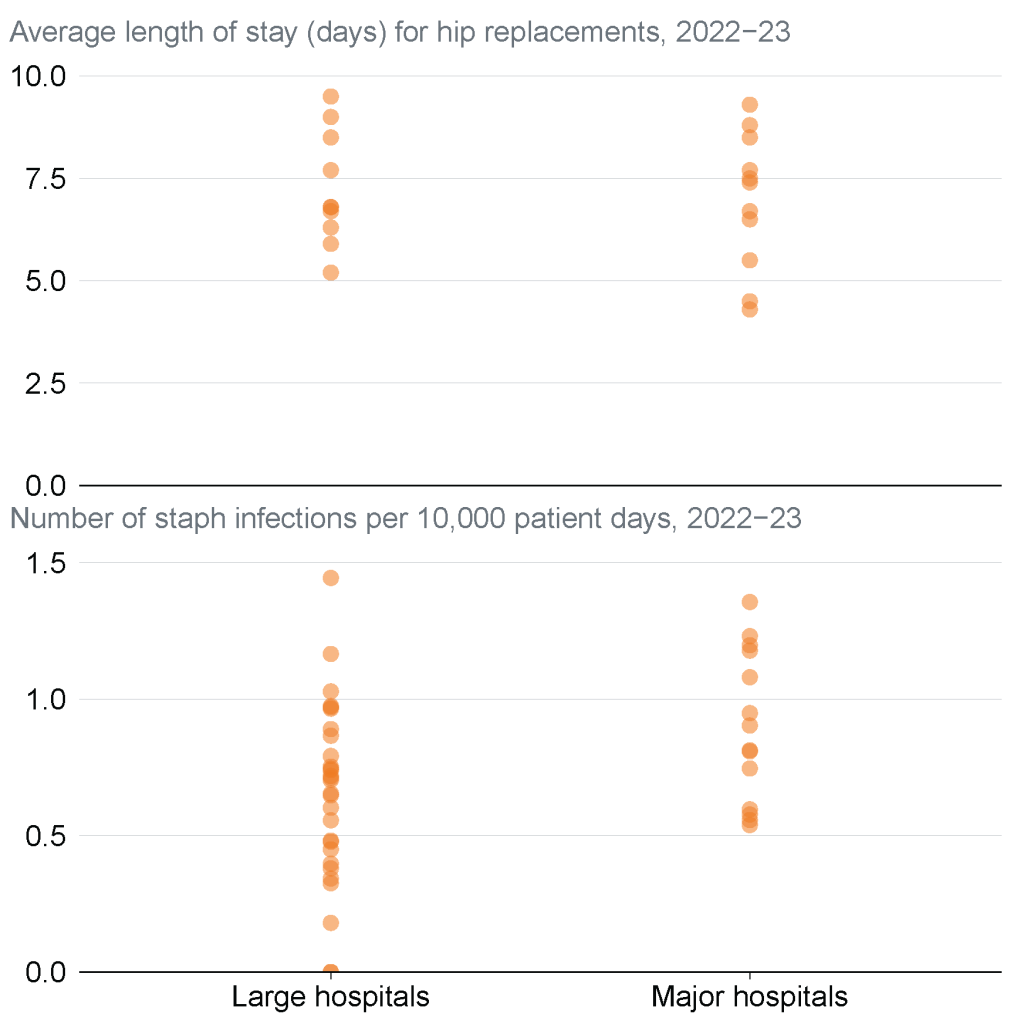
In health, chronic disease is the big system challenge. Australia must adopt a prevention agenda, alongside changes in how GP clinics are funded to support chronic disease management, and a greater focus on hospital efficiency, to help meet growing demand for care.

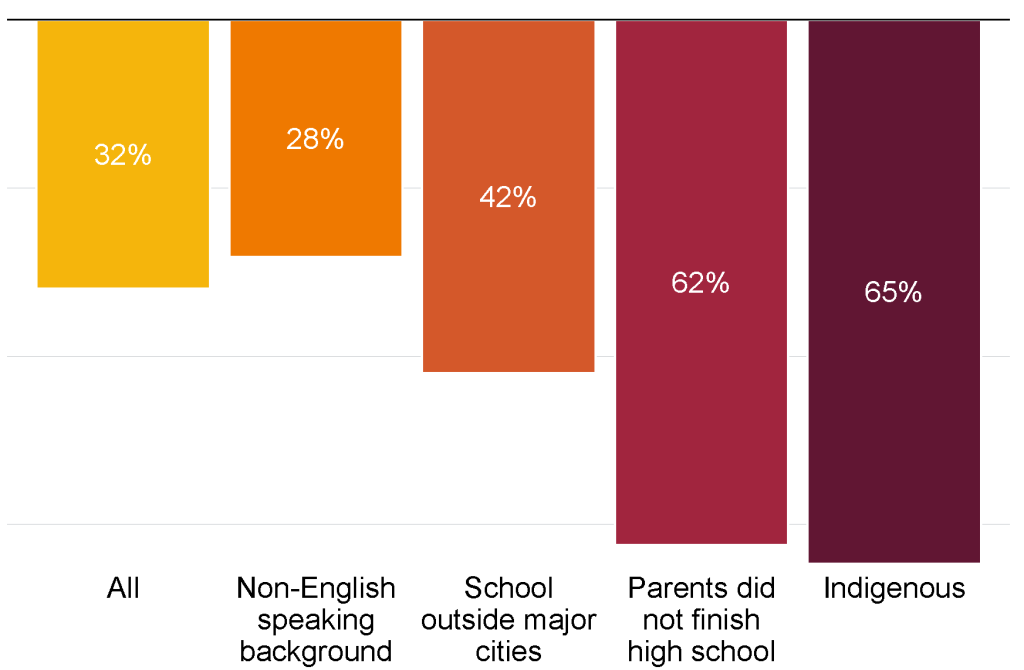
In education, we must lift our game to ensure the next generation of students gains the essential skills.

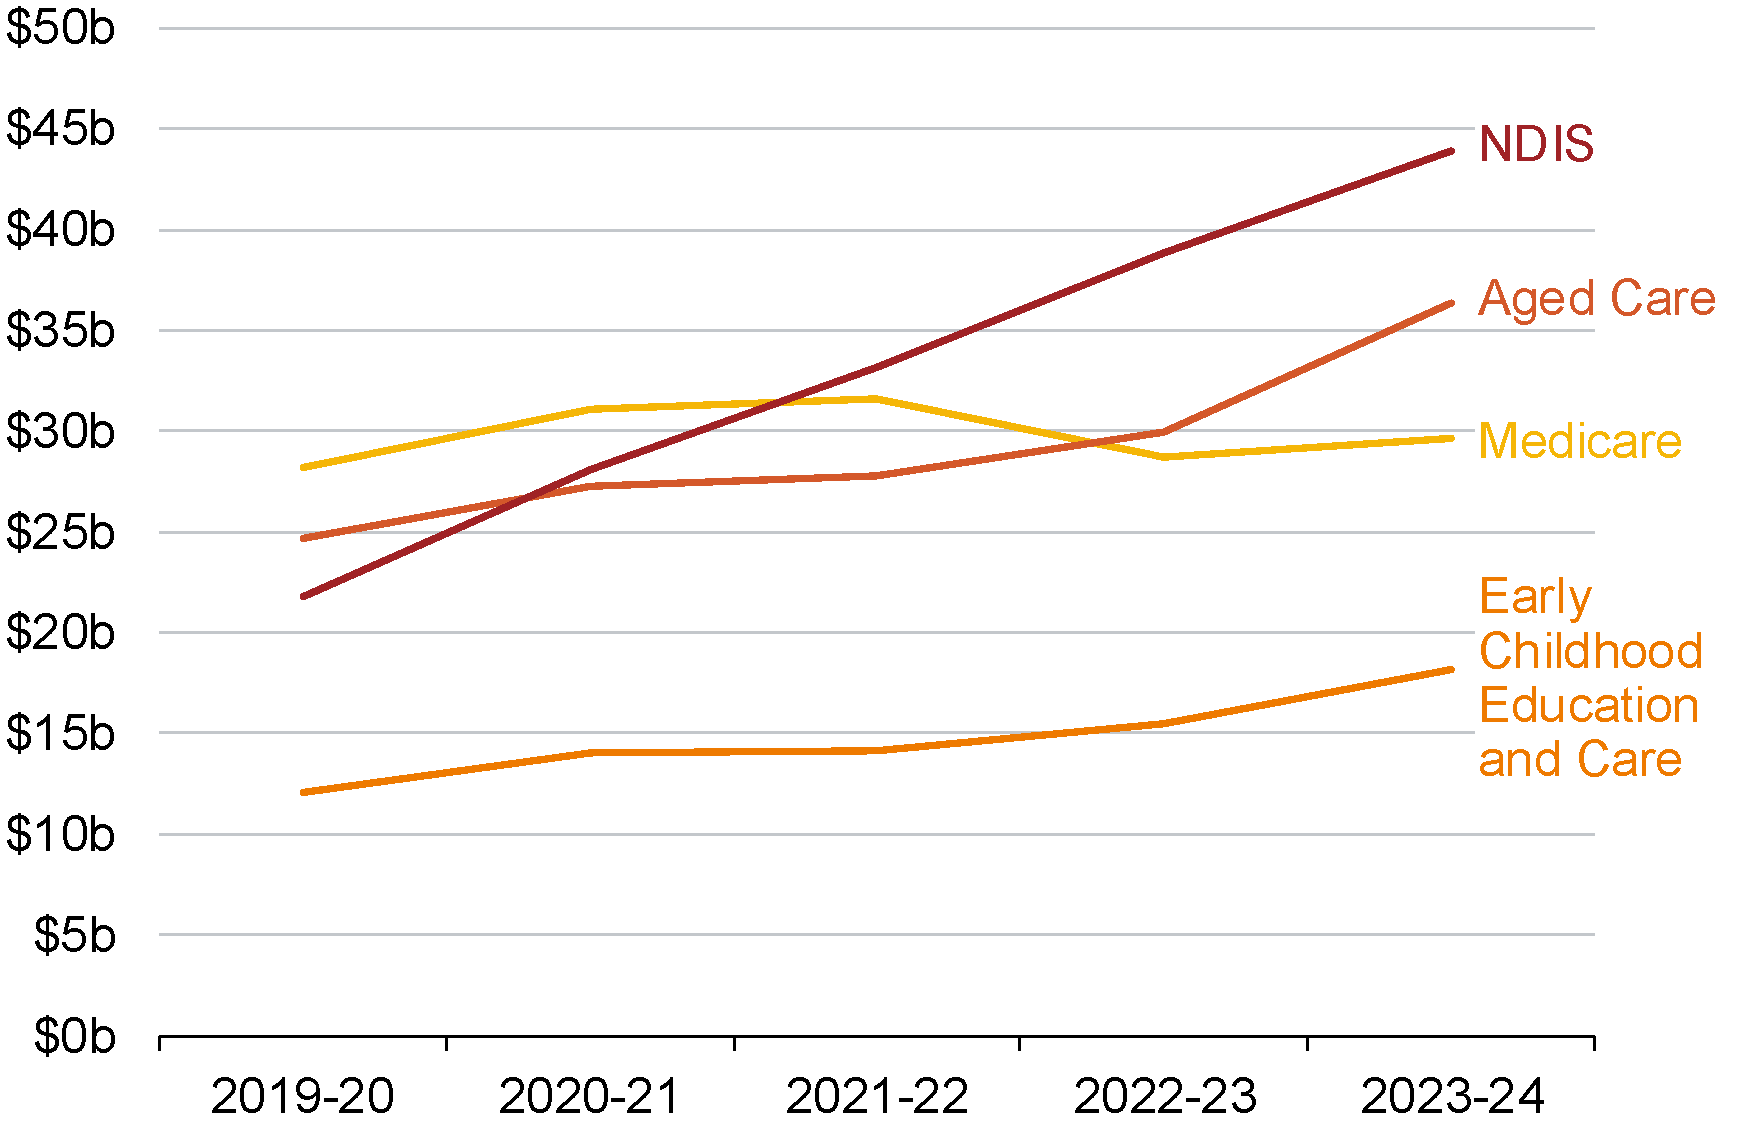
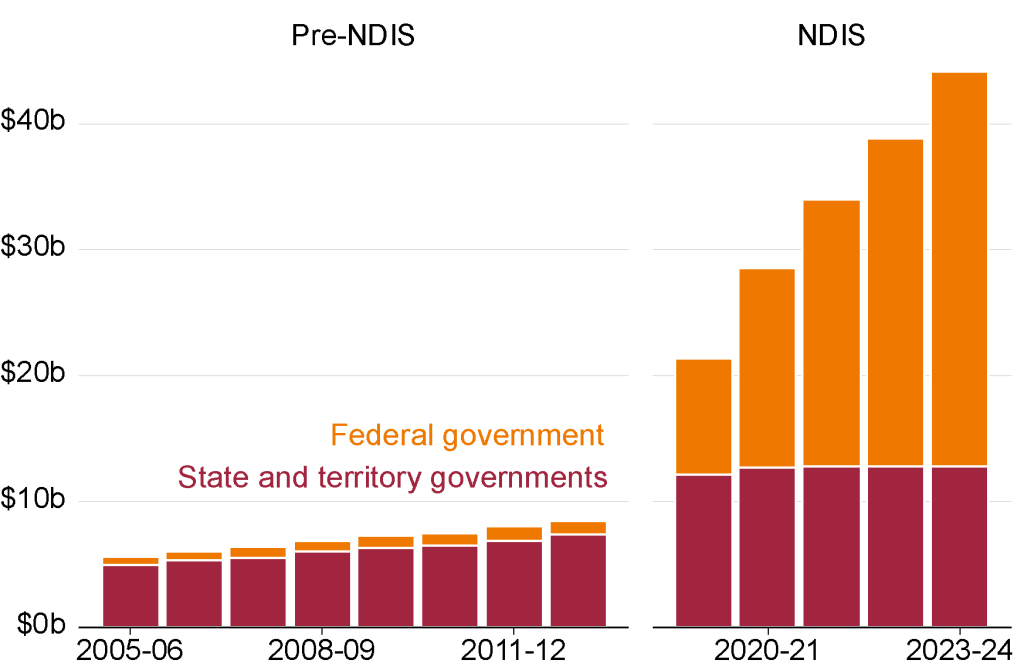
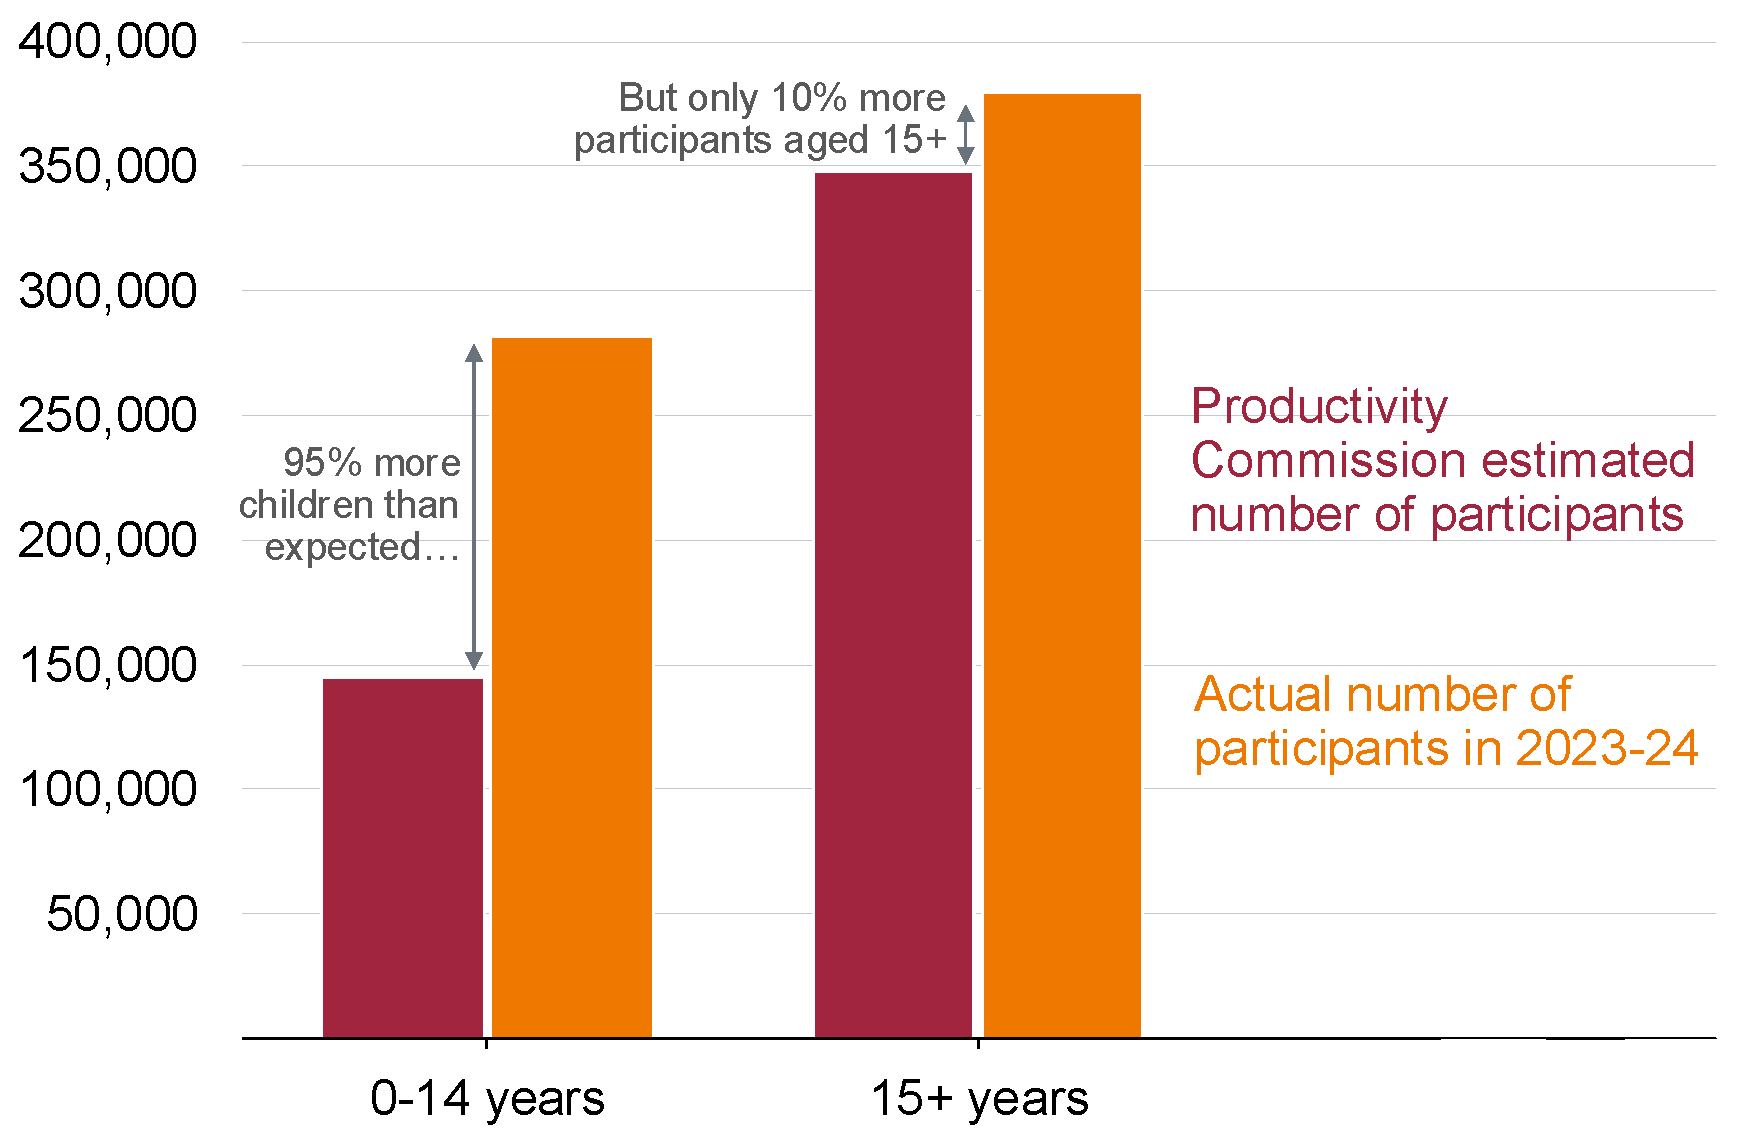
The NDIS provides life-changing support to many disabled Australians, but reforms to build up foundational supports and clarify eligibility for individualised support need to be implemented well to make the scheme sustainable.

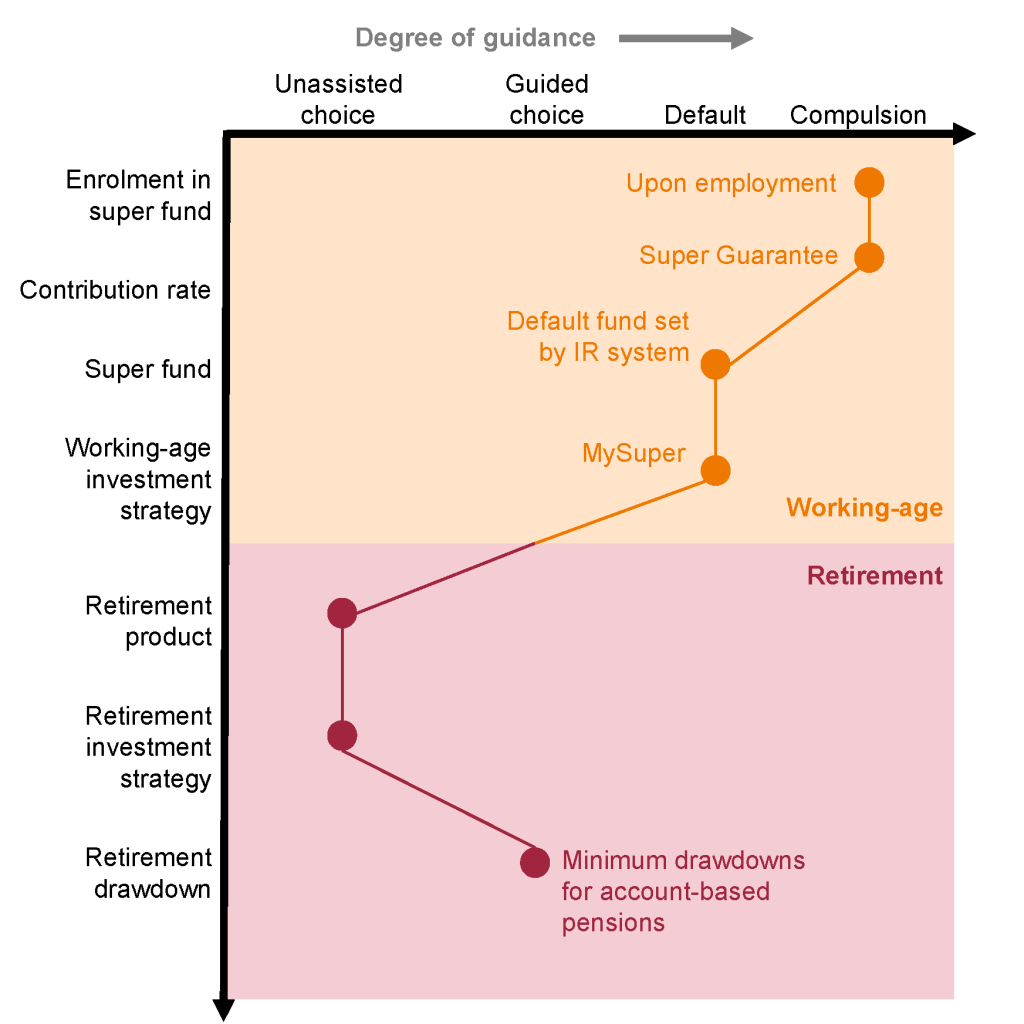
We should also improve our retirement incomes system by simplifying the system for retirees, curbing superannuation tax breaks that cost far too much, and strengthening protections for vulnerable retirees.

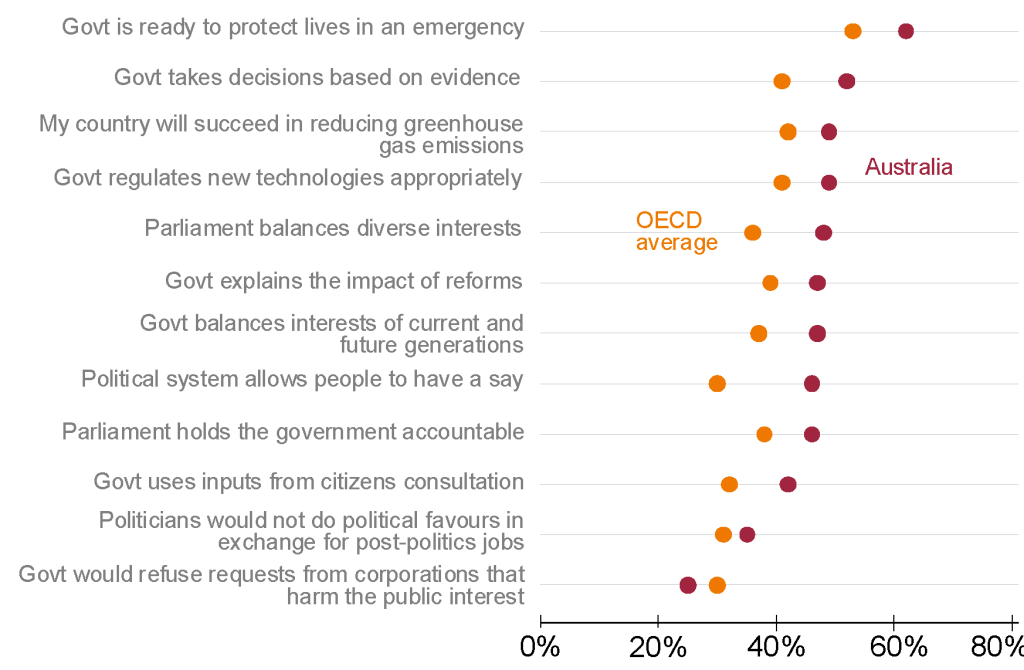
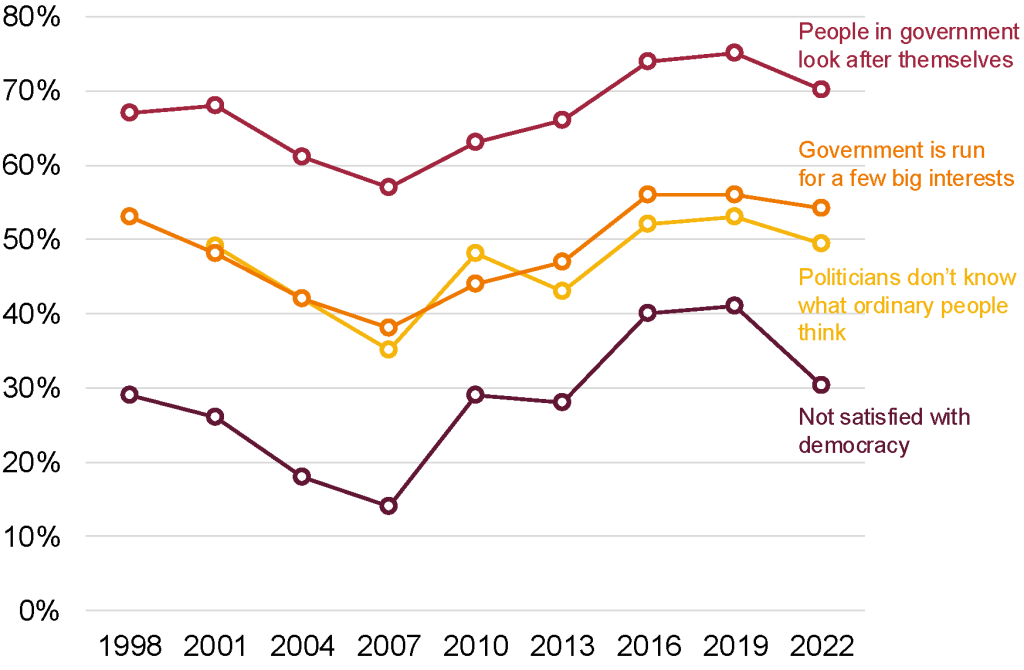
Australia’s institutions remain a real strength. They underpin our resilience to forces we can’t control, and are essential to our future prosperity. But to maintain the trust and confidence of the people, governments should introduce reforms to reduce the influence of vested interests and improve checks and balances on decision-making.

A better Australia beckons. This report shows the way.

A menu of measures to build a more prosperous Australia

Economic growth and budgets

  • Tax reform
  • Simplify skills recognition
  • Pathway to universal childcare
  • Reform skilled migration
  • Increase JobSeeker
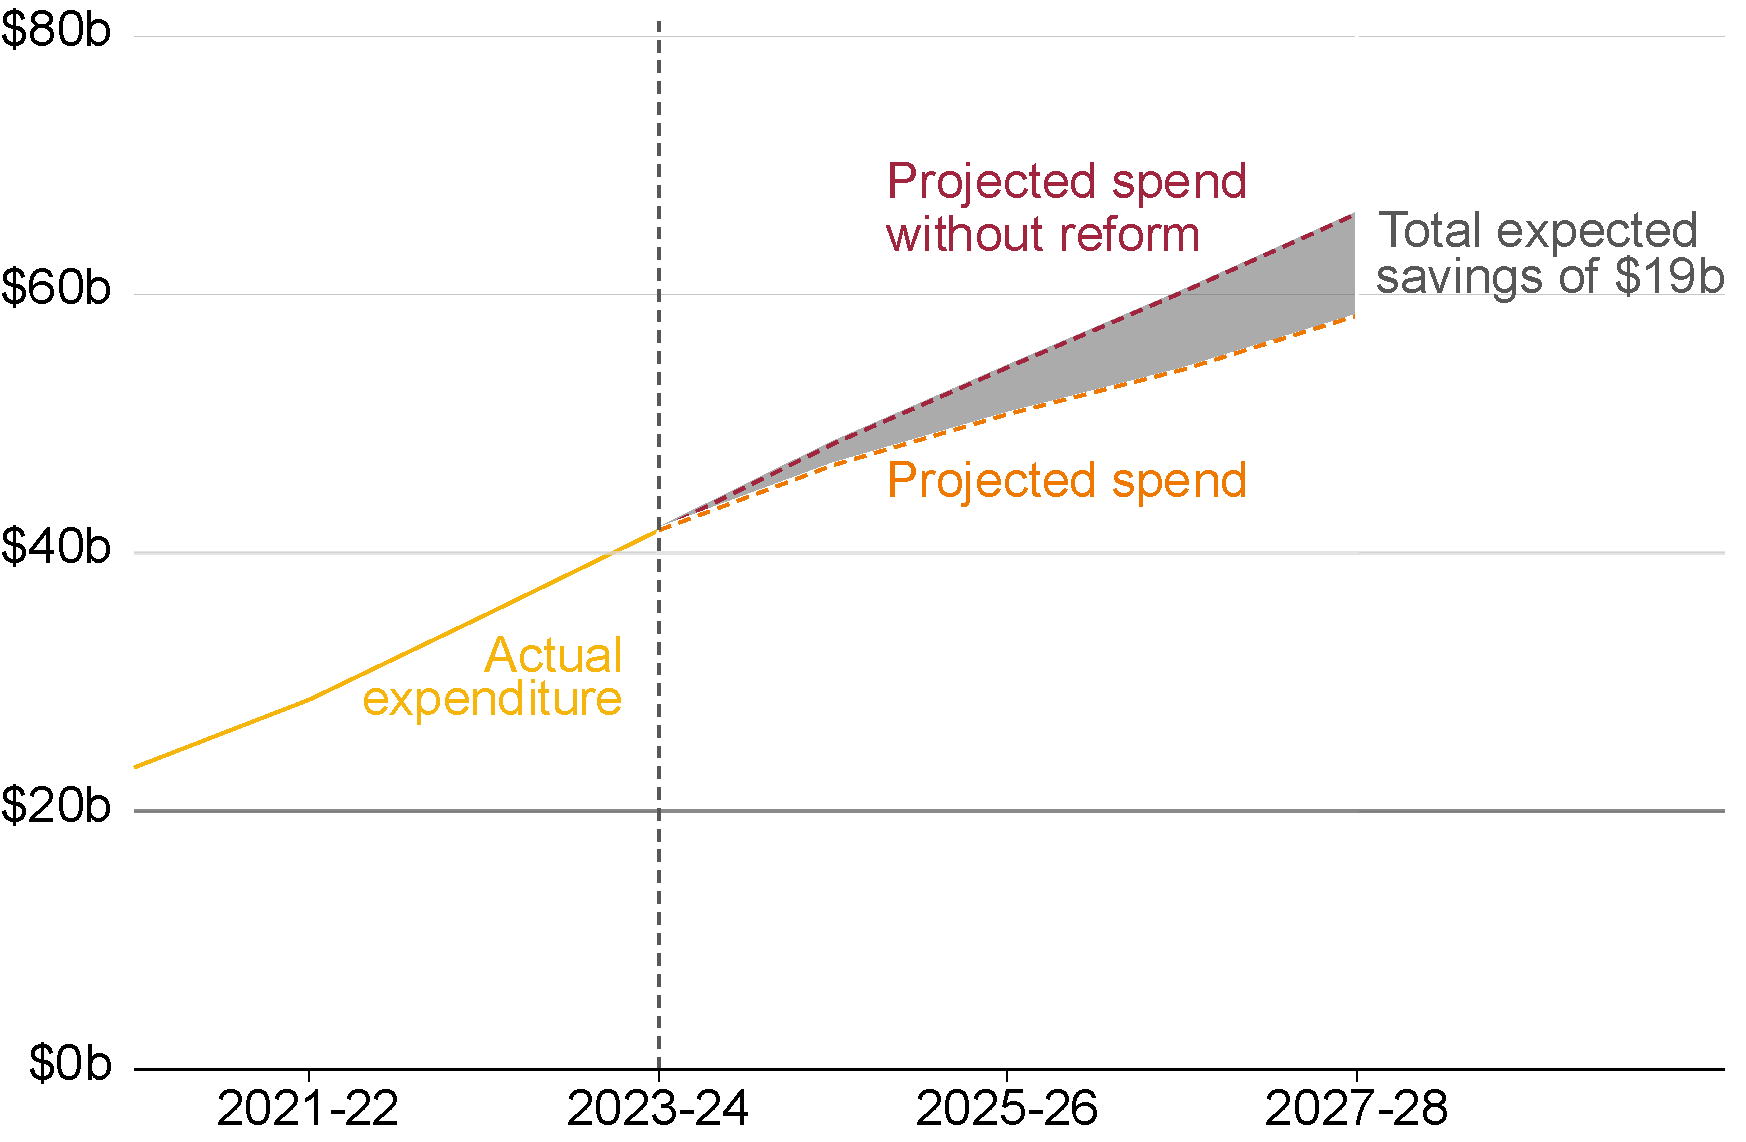
  • Pursue sensible savings
  • Improve infrastructure and defence procurement
  • Unwind the WA GST deal

Net-zero economy

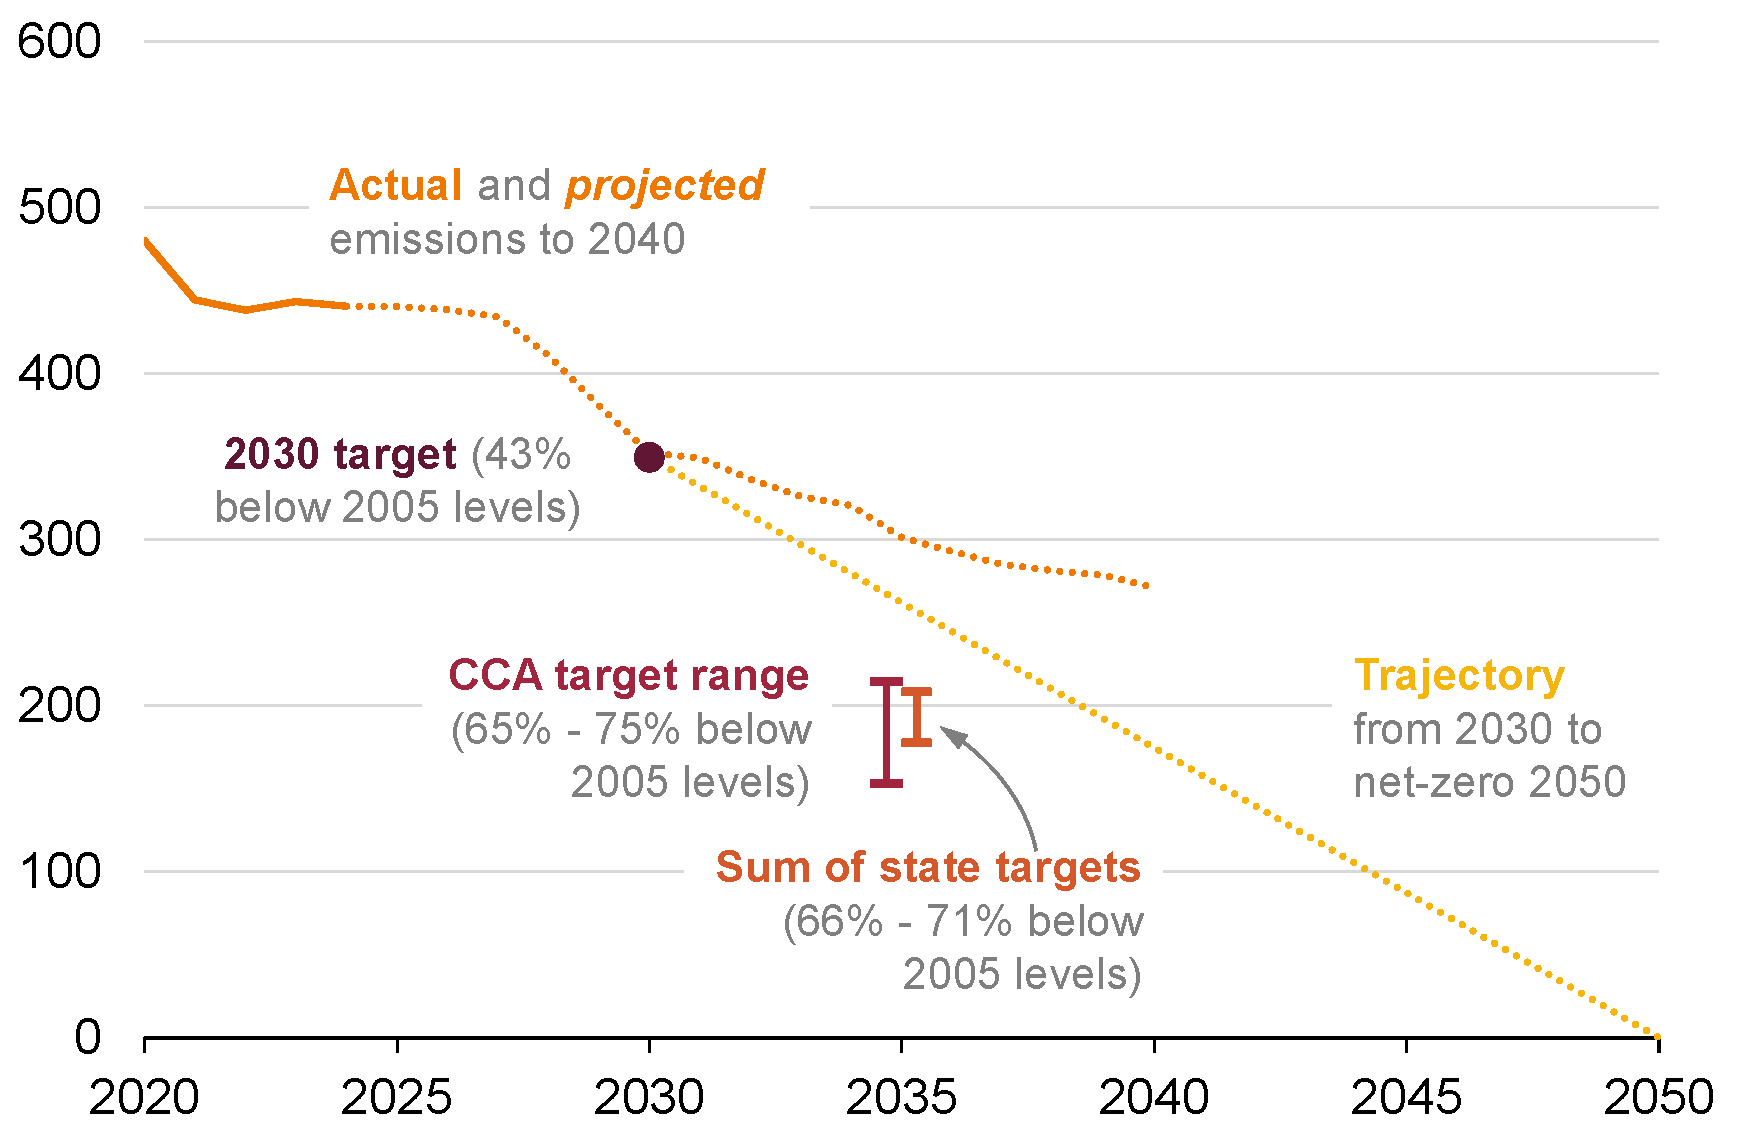
  • Create a national Net Zero Plan
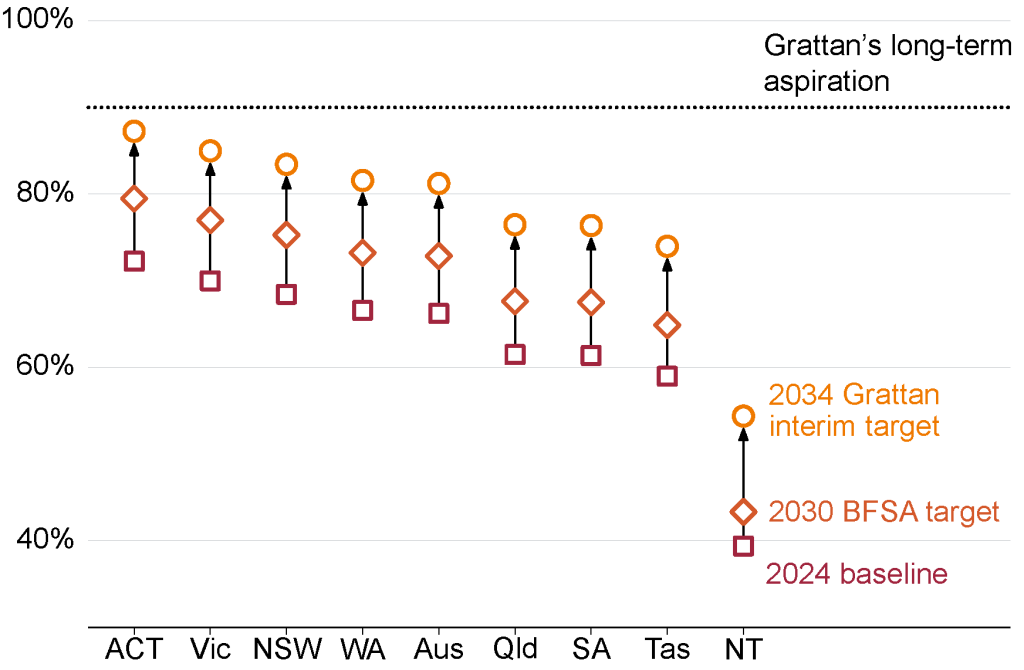
  • Maintain the 2030 target and set the 2035 target at 65-75% below 2005 levels
  • Stay the course on the Safeguard Mechanism
  • Stay the course on the New Vehicle Efficiency Standard
  • Wind back fuel tax credits
  • Make the Future Made in Australia framework a comprehensive industry policy
  • Introduce an economy-wide, enduring carbon price framework

Energy

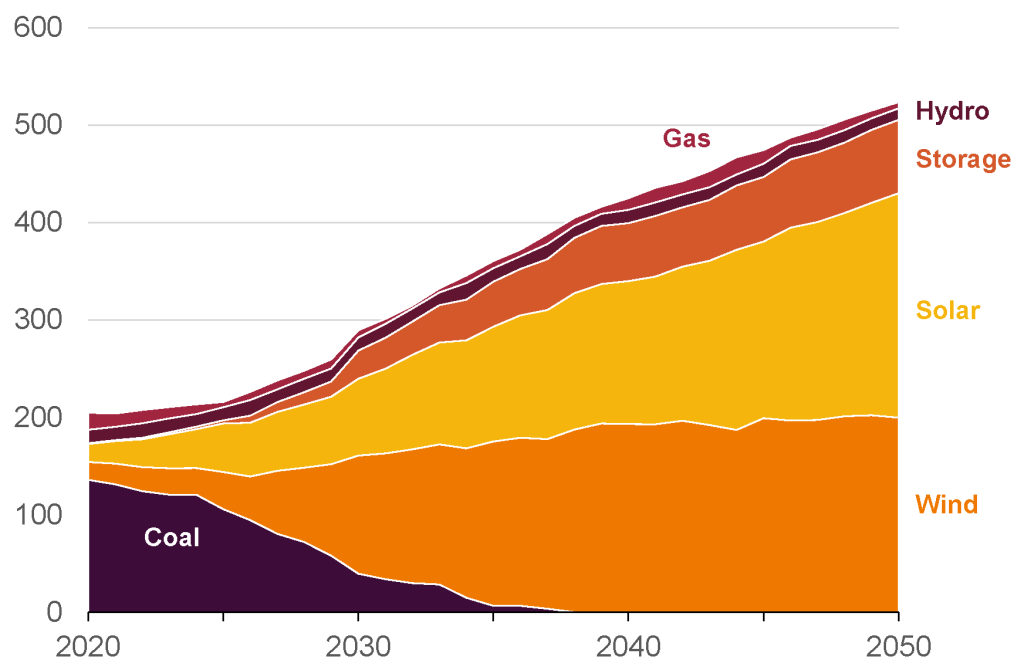
  • Develop the post-coal NEM structure
  • Address barriers to critical transmission infrastructure
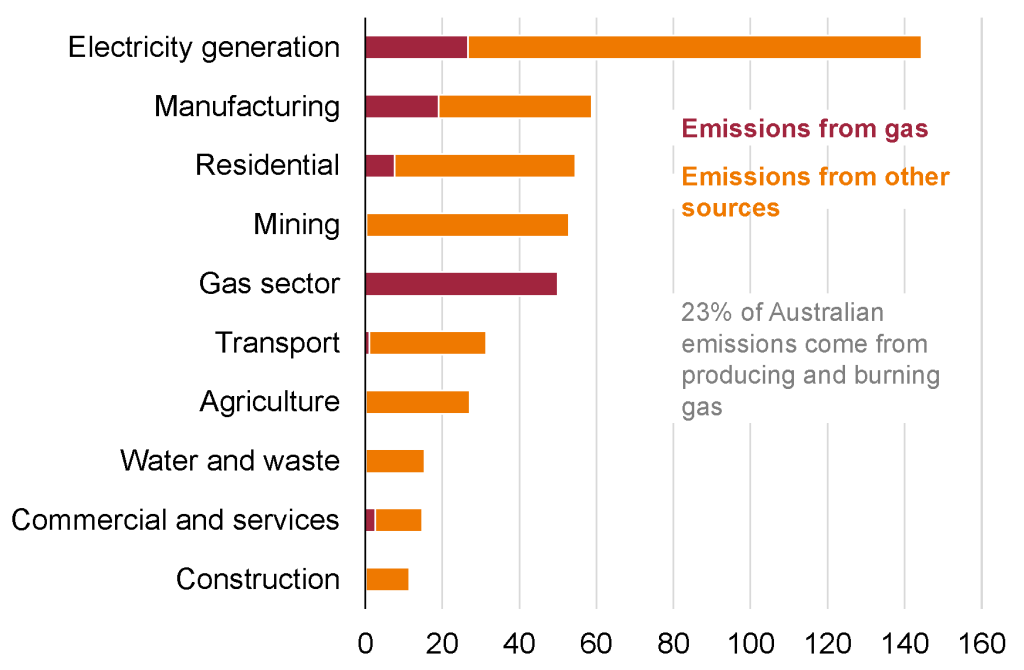
  • Fix the Future Gas Strategy
  • Update the role of gas price caps
  • Signal the case for a carbon price to guide investments
  • Find a fix for the south-eastern Australia gas shortfall
  • Extend the role of the Integrated System Plan
  • Revisit the Petroleum Resource Rent Tax
  • Prioritise under a comprehensive Consumer Energy Resources Integration Plan

Housing

  • Sharpen states’ incentives to boost housing supply
  • Fund states to swap stamp duty for land tax
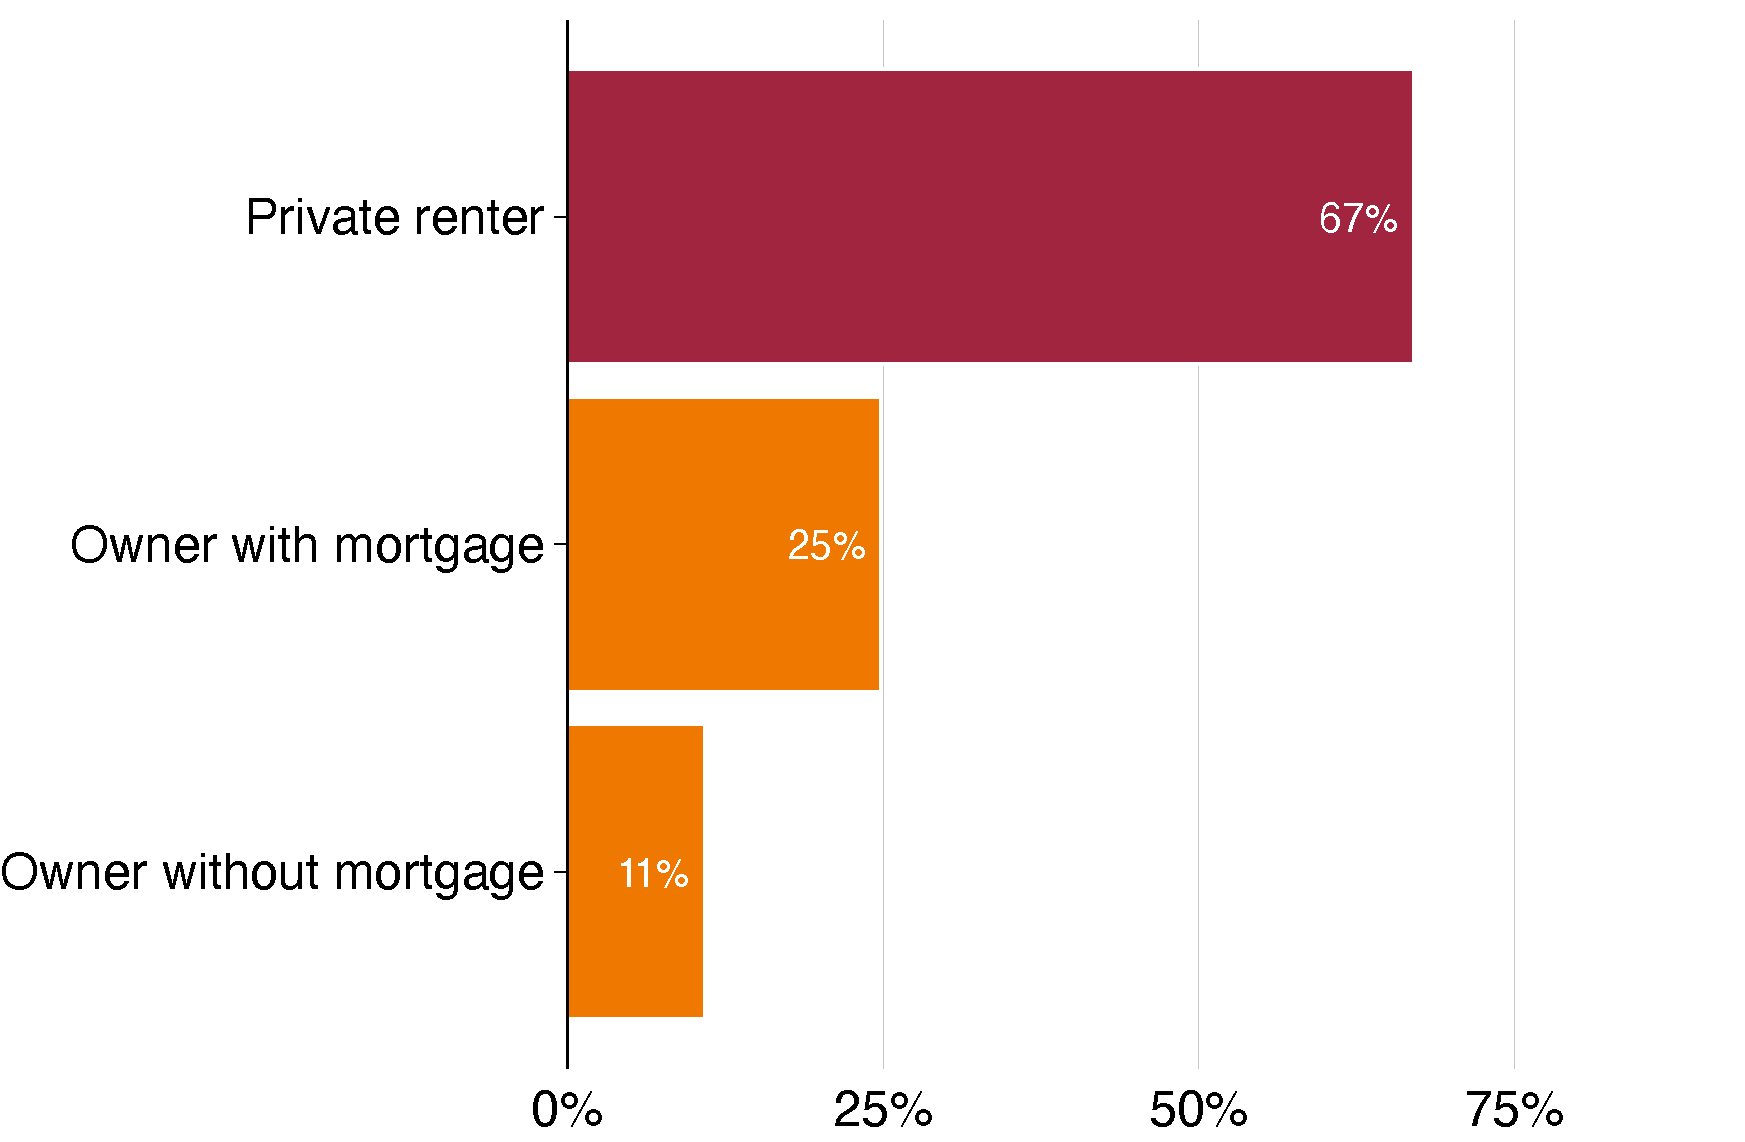
  • Further increase Commonwealth Rent Assistance
  • Increase the Housing Australia Future Fund
  • Work with states to improve tenancy laws

Health

  • Primary care funding reform
  • Pathway to universal dental
  • Prevention governance and funding – Public specialist investment
  • Improve vaccination rates
  • Introduce better food regulation
  • Fund a national secondary consultation scheme
  • Get better value from PBS and pathology spending
  • Establish a health workforce planning agency

School education

  • Raise expectations for school performance
  • Fund evidence-based national professional development courses to upskill schools’ workforce
  • Invest in an independent quality-assurance process for curriculum materials
  • Mandate a Year 1 Phonics Screening Check with a Year 2 re-sit for those students not at benchmark
  • Strengthen the evidence base and guidance on best-practice instruction

NDIS

  • Further moderate NDIS growth
  • Establish a new National Disability Agreement
  • Establish an NDIS innovation fund
  • Invest in foundational supports using NDIS funds

Retirement incomes

  • Offer a government annuity
  • Further curb superannuation tax breaks
  • Create a top 10 list of the best super funds
  • Performance test account-based pensions
  • Assess all retirement products
  • Establish a government guidance service
  • Include more of the value of the family home in the Age Pension assets test
  • Review default insurance in super

Integrity

  • Prevent gambling harm
  • Boost transparency of lobbying
  • Better processes for public appointments, grants, and taxpayer-funded advertising

Media

IN THIS CHAPTER

1 Charting the path to a more prosperous Australia

For many of us, recent years have been hard. The rapid onset of inflation as we emerged out of pandemic-era disruptions, and the necessary policy responses to inflation, have inflicted hardship.

In our previous Orange Book, published in the lead-up to the 2022 federal election, we called on whoever won that election not to waste a crisis, and to build back something better – an ambitious policy agenda for a better Australia.

But policy reform post pandemic has proved to be hard, as a long list of slow-burning issues compete for attention with immediate pressures.

Inflation has now fallen, but recent years have laid bare the effects of our long-standing challenges: growing demand for health and care, weak productivity growth, more frequent and severe weather events, a housing system that doesn’t serve our most basic needs, and the intergenerational inequity that that creates. We are playing catch-up on transforming our economy for a net-zero world, and most sectors are facing supply-side bottlenecks, struggling to get the workers and build the infrastructure they need.

This 2025 Orange Book sets out these core challenges, and offers a policy blueprint for the next federal government – whether Labor or Coalition, majority or minority – to improve living standards for all Australians, now and in the future.

Forging this path won’t be easy. And there is a temptation when the path is hard, to want to believe in some other easy solution, or defer the problems for our future selves to solve. That won’t get us anywhere. Instead, we need to make good collective choices about the kind of country we want to be and want to create for those who follow us.

In this Orange Book, we set out what those choices could be, as well as our thinking on how the next government should prioritise and sequence action.

We are a lucky country and we have the path ahead of us, but whoever forms government after the 2025 election will need more than luck. They will need to stay the course on a number of recent reforms and see them through. And they will need to do more to tackle the slow-burning issues that have been in the too-hard basket for too long.

1.1 This Orange Book is a policy blueprint for the next government

This report aims to help the next federal government identify the policy changes that would improve the lives of Australians.

Like the ‘Red Book’ (for Labor) and ‘Blue Book’ (for the Coalition) that the public service prepares for incoming governments, Grattan Institute’s ‘Orange Book’ sets out our policy recommendations for the incoming government.

This Orange Book focuses on policy reforms to boost economic growth, improve health and education, make housing more affordable, reduce emissions, more sustainably meet the needs of an ageing population, and strengthen our political institutions.

This Orange Book also includes a chapter on Australia’s National Disability Insurance Scheme (the NDIS) for the first time, representing a new area of Grattan’s work and an emerging priority for federal policy reform. The chapter articulates the big challenges facing the NDIS, and points to some options for reform.

We focus on these topics because they are important to Australians, and make a big difference to their lives.1Surveys consistently show that Australians rank health, the economy, education, and the environment among their top priorities for governments: e.g. Cameron and McAllister (2022) and Next25 (2021). For a more detailed discussion of what Australians want, value, and expect from government, see Daley (2020). Together they account for about three-quarters of the federal budget.2Grattan Institute analysis of Treasury (2024a, Table 6A.1).

Some recommendations are major reforms, some offer what we call ‘quick wins’, some would cost money, others would help provide services more efficiently. All are based on detailed research and analysis published by Grattan Institute since its foundation 16 years ago. They are policies that are strongly grounded in evidence and practical to implement.

What we’ve left out

This report does not cover a number of federal government responsibilities, including foreign affairs and trade, defence and security, law and order, industrial relations, higher education, agriculture, Indigenous affairs, and the environment (outside of climate change). These areas are important but are not part of Grattan Institute’s current work program (although they may still interact with topics in this report).3For example, this report makes no recommendations on trade, diplomacy, or security, but as a small, open economy, Australia is highly exposed to international developments, as discussed in Chapter 2.

The report focuses on issues the federal government can influence most directly, rather than those that are essentially state and territory responsibilities. However, it does identify areas where the federal government should increase coordination or cooperation with the states, and where additional federal grants to the states would help facilitate important reforms.


1.2 Meeting the moment

The 2025 federal election comes at a time of significant uncertainty.

Having only recently emerged from a global pandemic, many Australians found themselves in a cost of living crisis. Global shocks hit prices for energy and materials, and our economy has been ‘supply constrained’, with workforce, services, and infrastructure unable to keep up with demand. Younger and poorer Australians have had to cut back, while others have not, and this divergence in financial stress is starting to show up in measures of social cohesion.4See Chapter 10.

Elevated geopolitical tensions, the questioning of long-standing international rules and norms, and extreme weather events, pose ongoing risks to global trade and security, as well as energy and food prices.5The IMF’s World Trade Uncertainty Index is at its highest point since the COVID pandemic: IMF (2025). Global cooperation on shared challenges, including the imperative to reduce global emissions, is fragile, and diplomacy has become critical. Technology is reshaping the nature of work, and also how we engage with each other.

In this environment, it is easy to lose sight of the progress Australia has made.

But we have made progress. Australia has navigated the crises of recent years while avoiding mass job losses and business bankruptcies. Australians are collectively healthier and wealthier than ever. And we are steadily reducing our carbon emissions.

It is not enough. But we are not starting from scratch.

Our future can be bright, if we make wise collective decisions and focus on seeing policy reform through. Neither austerity – cutting the public services and infrastructure that we need – nor profligacy – failing to make tough collective choices on how we sustain an ageing population with high service expectations – will get us to a prosperous future.

Instead, we need to be smarter about how we spend, how we allocate capital, how we design markets, how we tax, and how we regulate. We need to make the most of our strengths: the skills and talents of the people we have and can attract, our institutions, and our natural endowments of sun, wind, and minerals.

We can’t necessarily predict what comes next, so we should be building the resilience of the system:6OECD (2025a). nurturing the fundamentals of education, opportunity, and trust in institutions, while raising our eyes to the horizon.


1.3 A prosperity agenda

To set Australia on a prosperous path, the next government will need to tackle the five big challenges we face:

  • Transitioning to net zero: we need to further bend the curve on emissions, and focus on the economic transformation that accompanies decarbonisation.
  • Tackling the housing crisis: we need to boost supply, relax planning constraints, and support mobility.
  • Deepening talent pools: we need to improve our school systems, early childhood education, skilled migration, and delivery of human services.
  • Meeting the needs of an ageing population: we need to get better at tackling chronic disease, and shore-up sustainable retirement and aged-care systems.
  • Fixing the structural budget problem: we need to introduce bold tax reforms, implement sensible savings, improve productivity in the health system, and rein in NDIS costs to make the scheme sustainable.

None of these challenges is new. And in each case we have already made a start. But the clock is ticking.

Australia will need a stronger focus on productivity to go the next mile: to get from constrained workforce participation to maximising talent (Chapter 2); from rooftop solar subsidies to industrial renewables, storage, and power grid infrastructure (Chapters 3 and 4); from regulation that stifles housing supply to rules that make building homes easier (Chapter 5); from a hospital-focused health system to a focus on primary care and prevention (Chapter 6); from too many students falling behind in literacy and numeracy to high-quality teaching that raises achievement in every classroom (Chapter 7); from unsustainable NDIS growth to a more efficient system that delivers the life-changing support disabled Australians need (Chapter 8).

As a small, open economy, Australia is exposed to the current, volatile global context. At the same time, Australia is better positioned than most countries to forge a path forward. Relative to our international peers, we have a highly-skilled workforce, stronger institutions, less stark demographic shifts, more natural assets, and a more manageable fiscal position.7See OECD (2024a), OECD (2024b), OECD (2024c), Overland et al (2022), and OECD (2024d).

We have proved in the past that we are not just a lucky country, we are capable of adapting our economy and our society to thrive. But from where we are now, a prosperity agenda will require a reset in how we talk about and execute policy.

Politicians will need to make the case for real reform, and be willing to live with trade-offs and the fact that some reforms will create some ‘losers’. Some bipartisanship will be required to see solutions through to impact, because these challenges outlive any one government.

And our public discourse must move beyond simplistic binaries, cynicism, and clickbait, to constructive proposals, and questioning of those who peddle easy solutions.


1.4 A prosperity agenda will require active prioritisation

Without prioritisation, there is a risk that only easy but trivial reforms succeed.8Or worse, that governments invest crucial time and capital on sideline ‘culture war’ type issues that have little bearing on the living standards or day-to-day concerns of most Australians: Daley (2020). It is all too easy for the ‘urgent’ to displace the ‘important’, crowding out improvements that would have made a bigger difference to people’s lives.

Governments have limited fiscal, workforce, and capability bandwidth, that needs to be factored into the extent and timing of reforms. Often the time and focus of senior ministers is the most scarce resource, so their efforts should befocused on the major reforms (that are high value but also inherently difficult because they take time to design, advocate, legislate, and implement).9Daley et al (2012).

The table in the Overview provides a snapshot of the reform priorities in this Orange Book. No government could implement them all in a single term. But if governments were to tackle a reasonable number of them over the next decade, we would be well on our way to a more prosperous Australia.

We divide our proposed reforms into three categories:

Major reforms: These are the big opportunities that will require concerted effort but offer the largest pay-off. Government should apply resources – public service time, ministerial attention, money, and political capital – to make these happen.

Quick wins: These are simpler reforms, with the potential to pay-off within a single term of government. Government should get cracking on them, and use them to build momentum for other more substantial reforms.

Prepare the ground: These are substantial reforms that require longer lead times, with the potential for a large pay-off down the track. Generally, these can be left to an individual minister, department, or agency to gather the evidence, work through the practical problems in implementation, and build public support for change.


1.5 The structure of this report

In this report we set out the case for change in nine key areas:

  • Economic growth and budgets: Australia is a rich country, but real incomes have stagnated and many Australians are doing it tough. The economy slowed to rein in high inflation, meanwhile weak productivity growth and long-term demographic and sectoral shifts are biting. Australia’s labour market remains strong though. Australia has relatively low debt, but budget pressures loom.
  • The net-zero economy: Australia has committed to reaching net-zero greenhouse-gas emissions by 2050. This requires change in every sector of the economy. While the scale of climate impacts and the full economic implications are uncertain, it is already clear that unmitigated climate change would be very bad for Australia. The federal government must do much more to seize the opportunities this transformation brings, and avoid a very disruptive and costly transition later.
  • Energy: Australia’s energy system is being profoundly disrupted by the transition away from fossil fuels, and there are now real risks to affordability and reliability. The federal government needs to act decisively in concert with the states to avoid shortages and blackouts, and bring about efficient investment in the infrastructure we will need to underpin future growth.
  • Housing: Australian housing has become increasingly expensive in recent decades, and public anxiety about housing affordability is high. House prices and rents have grown much faster than incomes, putting home-ownership out of reach for many. Low-income renters are suffering the most, finding it harder to make ends meet. Reform should focus on the key goal: building more homes.
  • Health: Without major reform, our health system will not be able to respond to Australia’s rising rates of chronic disease. The government must adopt a bold prevention agenda, change how GP clinics are funded to support chronic disease management, and promote hospital efficiency to help meet growing demand for care. The government should also make healthcare fairer by reducing out-of-pocket costs for patients, particularly for dental care and non-GP specialists.
  • School education: Too many Australian students are not on track with their learning in the essential skills of literacy and numeracy. Australia’s equity gap in school performance is also larger than average. Policy change is urgently needed to raise the level of ambition for our students and give schools the support they need to provide high-quality teaching in every classroom, every day.
  • The NDIS: The NDIS provides life-changing support to hundreds of thousands of disabled Australians. But the scheme has grown too big and is now one of the fastest growing pressures on the federal budget. Reform has been slow. Critical policy changes are needed to make the scheme sustainable.
  • Retirement incomes: Australia’s retirement incomes system serves most retirees well, but doesn’t work for those who rent in retirement. The federal government gives up more than $50 billion a year in poorly-targeted superannuation tax concessions. Australians also pay too much in superannuation fees, and receive too little guidance on how to use their super in retirement.
  • Integrity: We should be proud of our democracy, but we cannot afford to be complacent. Globally, trust in institutions is declining. Australians are particularly sceptical when it comes to vested-interest influence over public policy. And Australia’s democratic institutions aren’t working for everyone, creating long-term risks for our social cohesion.

Bibliography


IN THIS CHAPTER

2 Economic growth and budgets

2.1 Where we are

Australians enjoy some of the highest living standards in the world, a stable economy, and strong institutions. A strong labour market has meant most Australians who want a job can find one, and we are making progress on tackling gender inequality in economic opportunities and security.

But over recent years, policy makers have worked to intentionally slow the economy to curb the surge in inflation that was sparked by global shocks to energy prices and after-effects of the COVID era, and fanned by a strong recovery from the pandemic.

We have avoided a recession, with the economy hitting a turning point and returning to per capita economic growth.10ABS (2025a), and Hauser (2025). And Australia has preserved low unemployment through this period. Still some Australians have borne more of the financial pain of recent years than others. Rising cost-of-living pressures, particularly housing-related, have put many working-age people under financial stress, with low-income Australians and renters struggling the most. Cost-of-living support has been a delicate balance for governments.

Our slow-burn economic and fiscal challenges awaited us on the other side of the pandemic: a decade of stagnant incomes, the imperative to decarbonise the economy, growing demand in labour-intensive parts of the economy, and a structural imbalance between how much we spend and how much we raise in tax. The global economy is now more volatile and unpredictable, requiring us to think seriously about not just growth but resilience to shocks.

Many of these challenges are common across advanced economies. Australia is well-placed to forge a path through with good policy choices that look beyond the short term. And with a ‘soft landing’ close to being achieved, now is the time to put in place the reforms that are necessary to ensure inclusive and sustainable growth.

2.1.1 Australia is a prosperous country, but income growth has stagnated over the past decade

Australians enjoy some of the highest incomes and living standards in the world (Table 2.1). On most metrics of economic development and living standards, Australia is either near the top or in the middle of the pack of comparable countries.

But real income growth over the past 10-to-15 years has flatlined. Employee wages, adjusted for inflation, have been broadly flat since the mid-2010s.11The real Wage Price Index has fallen since the mid-2010s. Other measures of real earnings, such as average hourly earnings (from the National Accounts) and real median full-time employee earnings have risen slightly. Net national disposable income per person (which captures average household living standards) was flat from 2011 until before the pandemic, and flat again since 2021, after extraordinary household and business support was withdrawn (Figure 2.1).12Per capita incomes have grown faster in other OECD countries than in Australia since the mid-2010s (based on the real gross household disposable income per capita measure that the OECD publishes). See OECD (2025b).

The Australian economy faces risks. The potential consequences of global trade and security tensions, a changing climate, and challenges to liberal democratic principles seen elsewhere in the world could test the resilience of Australia’s economy, and society more broadly.

Table 2.1: International scorecard for economic development and living standards

Selected OECD countries similar to Australia. The darker the colour the worse the performance.

Chart showing Table 2.1 International scorecard for economic development
Notes: The Human Development Index is the average of life expectancy at birth, years of schooling for adults aged 25 and older and expected years of schooling for children of school-entering age, and gross national income per capita. PPP = purchasing power parity. Inflation: CPI = consumer price index. Japan is trimmed mean inflation. Income inequality: P90/P10 refers to the 90th and 10th income percentiles. Australia and Germany are 2020 data. Government debt: South Korea is 2022 data. Grey indicates data not available.
Source: Grattan analysis of OECD (2025b), OECD (2025c), UN (2024), and ABS (2025b).

Figure 2.1: Per-capita income growth has been soft since the mid-2010s

Real net national disposable income per capita, March quarter 2010 = 100

Chart showing Figure 2.1: Per-capita income growth has been soft since the mid-2010s
Note: Real net national disposable income per capita is the income available for a person to spend and save, after tax and interest payments, adjusted for inflation.
Source: Grattan analysis of ABS (2025a).

2.1.2 The ‘soft landing’ has still not been easy

The Australian economy bounced back strongly post-pandemic, and the inflation rate rose rapidly in 2022 and 2023. While the spike in inflation was sparked by global factors (higher energy costs resulting from Russia’s invasion of Ukraine, and supply-chain disruptions due to COVID), inflation was sustained by domestic factors as well, as the supply side of the economy (workers and firms) struggled to catch up to surging demand post-pandemic.

After a prolonged period of high interest rates, headline inflation is now 2.4 per cent. Underlying inflation, which excludes the effects of government subsidies and other large one-off price changes, has fallen to 3.2 per cent and the Reserve Bank has begun to cut interest rates.

This economic ‘soft landing’ is better than a hard one. The economy has slowed, but it has not gone backwards,13Without strong population growth over the past few years, Australia would have experienced a recession. and we appear to have reached a turning point. Australia has achieved this while preserving the low unemployment and high labour force participation achieved as we emerged from the pandemic.

But this period has hit some Australians much harder than others. Many Australians have seen income growth eroded by cost-of-living pressures, particularly housing. Younger and poorer people, who are more likely to rent or have a mortgage, and who rely mainly on wages for their income, have been most affected by rising rents, high interest rates, and falling real wages (Figure 2.2). By contrast, the incomes and spending of older and wealthier Australians have not declined.14In 2024, younger Australians were cutting back on spending while older Australians’ spending grew, in combination with saving more: Commbank iQ (2024).

This divergence in fortunes puts pressure on our social compact and exacerbates Australia’s relatively low but growing wealth inequality (see Box 1).15D. Wood et al (2019).


2.1.3 Australia’s labour market is strong

Australia’s labour market is strong, meaning most Australians who want a job can find one.

Labour force participation, which includes unemployed people looking for a job, is at a record high.16ABS (2025c). Altogether, almost 77 per cent of working-age Australians (15-64 year-olds) are employed, compared to an OECD average of 70 per cent.17OECD (2025c). Promisingly, the share of young Australians who are not engaged in employment, education, or training has fallen over the past decade.18In 2012, the proportion of 15-29 year-olds not engaged in employment, education, or training was 11.7 per cent. In 2022, it was 9.6 per cent: OECD (ibid).

A strong labour market helps marginalised workers the most.19Coates and Ballantyne (2022). Employment supports financial security and independence, skills retention and development, and social connection. For the economy, a strong labour market improves productivity over time, as workers move to better jobs and firms invest in ways to save labour.20D. Wood (2022).

In the short term, strong growth in employment has weighed on productivity growth, because many new workers have been younger, less experienced, and less educated.21Productivity Commission (2024a). Most of the increase in employment in recent years has also been in non-market sector jobs. But this is only a short-term situation – sustained low unemployment remains good for workers and for productivity.22Coates and Ballantyne (2022).

Figure 2.2: Financial stress has risen, and is highest for low-income earners and renters

Share of Australians finding it ‘difficult’ or ‘very difficult’ on their current incomes

Chart showing Figure 2.2: Financial stress has risen, and is highest for low-income earners and renters
Notes: Household income quintile data are from October 2021, housing tenure is from April 2021. Income quintiles based on net income (after tax and government benefits).
Source: Biddle et al (2024).

In 2022, Australia’s unemployment rate fell to 3.5 per cent, its lowest in 50 years. More recently, as the economy has slowed, unemployment has risen to about 4 per cent, but remains around historic lows.

The labour market remains tight despite strong migration postpandemic that helped to fill widespread shortages across the economy.23Migrants helped fill shortages in some sectors, but in aggregate strong migration has had minimal impact on labour market tightness, because migrants add to both demand for and supply of labour: Coates et al (2022a, pp. 28–29). Since Australia’s borders reopened in 2022, migration picked up strongly due to a ‘catch up’ of people coming to Australia, and fewer departures. Net overseas migration was 446,000 over the year to June 2024. As a result, Australia’s population is now around where it would have been without the disruption of closed borders, based on the pre-COVID trend.

Labour market tightness is likely to persist, as it has across OECD countries, with labour and skills shortages especially in healthcare and technology related jobs.24OECD (2024e, Chapter 2).

This means Australia will need to make the most of the workforce that we have, and the workers we can attract from overseas.

The biggest opportunity is in tackling the inequality faced by women in working life.25D. Wood et al (2020). While women’s employment has risen to a record high, it is still 8 percentage points below men’s employment.26An average of 68.1 per cent of men aged 15 and older were employed over the past 12 months, compared to 60.5 per cent of women: ABS (2025c). The gender gap is particularly notable in part-time work: Australia has a far higher rate of part-time work among women than most of our international peers, and is well above the OECD average, with 43 per cent of employed women working part-time, compared to 20 per cent of men (Figure 2.3).27Australia has higher overall employment rates for 15-64 year-old women, at 73.8 per cent in June 2024, compared to the OECD average of 63.5 per cent: OECD (2025c).

Figure 2.3: The rate of part-time work for Australian women has declined since 2015, but remains well above the OECD average

The share of employed people working less than 30 hours per week, by gender

Notes: People aged 15 to 64. Selected OECD countries. OECD incidence of full-time and part-time employment based on OECD-harmonised definition.
Source: OECD (2025c).

Women have higher underemployment rates than men, which suggests this gap is not just due to choice. Instead, barriers such as access to and cost of childcare, an uneven load of caring and domestic responsibilities, and high effective marginal tax rates mean many women would like to but do not try to work more paid hours.28D. Wood et al (2020), and Productivity Commission (2024b).

This reduces the ability of women to continue in the jobs that best fit their skills and experience. And a need for part-time work can result in ‘down-shifting’ to lower paid, less senior roles, that lack career progression. Australia’s gender pay gap has been falling for the past decade or so but still sits at about 20 per cent.29The total remuneration gender pay gap: WGEA (2024, pp. 16–17). In 2023-24, the main driver of the decrease in the gender pay gap was the wage increase for aged care workers.

And while many migrants thrive in Australia, too many are either unemployed, underemployed, or not working to their full potential due to the labour market barriers they face.30About one-quarter of skilled visa-holders worked in a job in a lower-skilled field than their nominated field, or were not working, 30 months after being granted a permanent visa: Coates et al (2024, p. 50). See also Settlement Services International (2024).


2.1.4 The structure of the Australian economy is changing

Australia’s economy has been gradually changing over recent decades.

With life expectancies among the highest in the world, our population is ageing. As the Baby Boomer cohort reaches retirement age, the number of people aged 65 and older for every 100 people aged 15-64 is rising, from 15 in the early 1980s to almost 27 now.31Treasury (2023a, Chart 3.3). While strong migration since 2000 has kept us from ageing even faster,32The 2002-03 Intergenerational Report projected there would be 29 people aged 65 and older for every 100 people aged 15-64 by 2022. the ageing of the population nonetheless profoundly changes the structure of our workforce, our needs and expectations from public services, and our tax base.

The services sector has grown as a share of the Australian economy, and particularly as a share of our workforce, because services are more labour-intensive than other sectors (Figure 2.4). Growth in services is a natural feature of an advanced economy such as Australia’s.33D. Wood et al (2023, pp. 6–7). An older, and wealthier, population has resulted in growing demand for human services: healthcare and aged care in particular. Alongside this, community expectations of service quality have steadily risen, as has the cost of medical technology.34This structural shift has major implications for government budgets (Section 2.1.5). Some previously unpaid care work has also now shifted into the formal economy.

Figure 2.4: Australian jobs are increasingly in the services sectors

Industry share of workforce, employed people

Notes: 1981 to 1983 are interpolated using 1980 and 1984 data. Services includes ‘Electricity, Gas, Water, and Waste Services’.
Sources: Withers et al (1985) and ABS (2025d).

Australia is also in the midst of an economic transformation to decarbonise our economy and make the most of a net-zero global economy. This is an industrial revolution on a deadline, in which no part of the economy, from energy and manufacturing to agriculture and health, will be untouched. Some sectors such as coal mining will disappear and others such as steelmaking will be reinvented, while nascent activities based on minerals and renewable resources provide globally significant opportunities for Australia (Chapter 3).

These structural shifts require the supply side of the Australian economy to strengthen. Australia’s workforce will need to keep up with an ageing population. We will need to be more educated and skilled, to meet demands for more cognitive and less manual work. The energy transition and housing will require substantial construction across the economy, and capacity constraints on new infrastructure means we need to use our existing infrastructure more efficiently.

Slower productivity growth, which has been a feature of the Australian economy for two decades, is related in part to the structural changes above, and to a slowdown in global productivity growth.35Bruno et al (2023). This is weighing down growth in real incomes. Australia’s labour productivity growth has slowed substantially since the 1990s and 2000s (Figure 2.5),36Multi-factor productivity growth, which is a broader measure of productivity across the market economy, averaged 0.5 per cent in the five years to 2022-23, compared to an average of 0.8 per cent over the past 28 years: Productivity Commission (2024c, Table 1). and has been among the slowest of all OECD countries in recent years.37OECD (2024e).

Figure 2.5: Labour productivity growth has slowed since the 2010s and is no higher than it was in 2016

Labour productivity, index March quarter 2000 = 100

Notes: Real GDP per hour worked. The market sector measure is for all market sector industries except agriculture, forestry, and fishing. Non-market sectors are: healthcare and social assistance, education and training, public administration, and safety.
Source: Grattan analysis of Productivity Commission (2024d, Figure 1).

Innovation, increasing human skill, technological development, and more efficient systems and processes are what underpin higher living standards over time, but global progress on these fronts has slowed since the early 2000s.38Productivity Commission (2024a), Productivity Commission (2024d), and Bruno et al (2023).

Some portion of the slowdown is a matter of economic measurement. Economic measures of productivity are more meaningful for the market economy than non-market sectors, where prices are not an effective signal of value or quality, and other methods for measuring output are imperfect. For example, recent Productivity Commission research found parts of the healthcare sector have had robust productivity growth in recent years that is not captured by traditional economic measures.39The Productivity Commission found that quality-adjusted productivity grew by about 3 per cent per year across the subset of diseases studied: Productivity Commission (2024e).

And weak productivity in the mining sector, which makes up a large share of economic output, has dragged down aggregate productivity growth in recent years (Figure 2.5).40Productivity Commission (2024d). The mining sector was a key driver of Australia’s productivity growth in the 2010s.

But the basics of productivity growth remain critical if we are to maintain and improve our living standards: we need good ideas that help us do more with less, across both the market economy and the non-market economy, and we need to ensure that people can make the best use of their talents and skills.

There are green shoots on the horizon: the US – the world-leader in productivity – has had a surge in productivity growth since 2021.41Dao and Platzer (2024), Apricitas Economics (2024), and Productivity Commission (2024d). Some of these gains could spill over to Australia. The growth of artificial intelligence (AI) may also bring a major transformation in how Australians work.42For example, see Autor (2024) and Treasury (2023b, pp. 81–82).

Equally, there are new headwinds to contend with: more frequent extreme weather events, and threats to free and rules-based international trade, are also shaping up as structural shifts facing Australia’s small, open economy in the coming years. These have the potential to make prices more volatile and lower economic growth.


2.1.5 The longer-term budget situation requires work

The past two federal budgets have delivered surpluses, and Australia’s net debt has now returned to 20 per cent of GDP, close to where it was pre-COVID.43Treasury (2024b, p. 6). Between July 2014 and June 2019, net debt averaged around 18 per cent of GDP: Parliamentary Budget Office (2024, 2024-25 MYEFO, Table 2).

But the longer-term budget outlook is more troubling. Although it has improved since our previous Orange Book in 2022, the budget is still projected to be in deficit over the next decade, peaking at 1.2 per cent of GDP in 2025-26.44Treasury (2024b, p. 86).

Payments as a share of GDP have risen since 2000, and are projected to average 26.7 per cent of GDP over the next ten years.45Treasury (ibid, Chart 3.5). Federal and state government expenditure was 29 per cent of GDP in the December quarter 2024, the highest proportion on record (excluding the COVID-19 pandemic): Grattan analysis of ABS (2025a). This reflects changing needs and expectations: as we get richer, our expectations of government services also rise.46This has been a common experience across advanced economies, and largely reflects an expansion of social insurance provided by the state: see D. Wood et al (2023). The composition of government spending has also changed, with less spending on working-age Australians and more on older Australians.47D. Wood et al (2019).

As we have long known, spending pressures will continue to grow in health and aged care to meet the needs of an ageing population (Figure 2.6).

Spending has also risen in recent years to address historical underprovision or under-valuation of services – for example, wage increases for aged-care and childcare workers. This was not only about fairness but necessity to help address worker shortages in these high-demand essential services. As a result, budget estimates now more accurately reflect future spending pressures.48D. Wood et al (2023).

Growing defence spending is another fiscal pressure, as are interest payments. The rapid and unsustainable growth in the NDIS is the final of the ‘Fast Five’ pressures set out in the 2023 Intergenerational Report (Figure 2.6).49Treasury (2023a, Chart 4).

Figure 2.6: Population ageing, more healthcare spending, and the NDIS are projected to drive growth in spending over the long term

Expenses as a share of GDP

Notes: Federal government only. Aged care and NDIS expenditure derived from the Report on Government Services; expenses for other categories are derived from the Historical Fiscal Data. 2062-63 projections are calculated using payment growth rates from Treasury (2023a, Chapter A3), which assumes there are no policy changes. Sources: Productivity Commission (2025a), Treasury (2023a), Parliamentary Budget Office (2024), and Productivity Commission (2003).

This higher spending must be matched by higher revenue if we are to avoid handing the bill to future generations. Yet government receipts as a share of GDP are little changed since 2000, and are expected to be steady at around 25.5 per cent of GDP over the next few years.50Treasury (2024b, Table 3.1). Growth in receipts over the next decade is expected to come only from bracket creep. And this will disproportionally hit working-age households, who typically pay significantly more tax than households older than 65 (even on the same income).51In 2019, Grattan estimated that a working-age household earning $100,000 would pay around two-and-a-half times as much tax as a household older than 65 on $100,000: D. Wood et al (2019).

Without major policy changes, the underlying structural budget problem will grow.52D. Wood et al (2023).

Box 1: Income inequality was steady pre-pandemic but has increased since, and wealth inequality is growing

Australia is about middle of the pack on income inequality among OECD countries.a 2020 data. The income gap between a household at the 10th percentile and a household at the 90th percentile is smaller in Australia than in the US, similar to the UK, and a bit higher than New Zealand: OECD (2025b). Income inequality remained steady in the two decades before the pandemic, and then improved at the start of the pandemic due to substantial government assistance to low income households.bProductivity Commission (2024f, Chapter 2). As the economy recovered and supports were withdrawn, inequality increased and is now slightly higher than pre-pandemic.cThe latest income inequality data is for 2022 from the Household, Income and Labour Dynamics in Australia (HILDA) survey: Wilkins et al (2024, p. 37). The latest Survey of Income and Housing data is from 2019-20.

But wealth inequality in Australia has grown substantially over the past three decades, driven largely by housing and superannuation.dD. Wood et al (2019). The growing wealth disparity between older and younger Australians is particularly stark: in 1994, people aged 65-74 collectively held about three times the wealth of people aged 25-34. By 2020, this gap was almost five times.eABS (2022a). But despite the worrying trend, Australia’s wealth inequality is still below the OECD average.fLatest data is from the late-2010s. See: OECD (2025b).

One in eight Australians lived below the poverty line in 2019-20, as defined by earning less than 50 per cent of the median household income.gACOSS (2023). On this measure, one in six children lived in poverty. HILDA data suggests relative income poverty increased after the pandemic: Wilkins et al (2024, p. 43).


2.2 What we should do

The next government, whether Labor or Coalition, should pursue a variety of reforms to increase Australia’s productivity and reduce the structural budget deficit. While these challenges will not be solved overnight, there are many things the federal government can do to set Australia on a better path. Some are major reforms, some are quick wins, and others will help prepare the ground for future reforms (see Overview table).


2.2.1 Focus on productivity

Stronger productivity growth is the key to raising our living standards in the long term, and keeping inflation down in the short term.

Much of what drives productivity growth in the market economy is beyond the control of governments. Technological leaps are hard to pick. And how individuals and businesses interact, innovate, and are managed, drives productivity at the firm level.

But there are steps the federal government can take to create a conducive environment. In particular, the government can strengthen the foundations that support people to flourish – housing, health, education, and a fair and cohesive society. It can also promote a more competitive economy and a better-functioning labour market, and ensure the right infrastructure, tax, and regulatory settings.

A resilient and flexible economy, supported by strong and inclusive institutions, will ensure we are well-placed to seize opportunities and respond to shocks in the context of greater global uncertainty.53The OECD has published a toolkit for resilient public policy: OECD (2025a). A 2021 Productivity Commission report found that Australia’s supply chains are generally resilient, but that there are ways governments and firms can mitigate
risks of supply-chain disruptions. See Productivity Commission (2021a).

The reforms recommended in this Orange Book will help boost productivity in different sectors. In particular, the transition to net zero presents opportunities to develop new, high-productivity industries that use renewable energy, and to diversify our industrial mix (Chapter 3 and Chapter 4).54Treasury (2023b, Chapter 4) and Garnaut (2022).

Boosting the availability and affordability of housing (Chapter 5) would support people to move and live closer to jobs, enable us to get the most out of our cities (and existing infrastructure), and lower one of the hurdles to greater entrepreneurship in Australia.55Connolly et al (2015).

And governments can directly boost productivity through better delivery of non-market human services, including in healthcare (Chapter 6), education (Chapter 7), and disability support (Chapter 8).

Even beyond the reforms in this Orange Book, technological improvements may play a role, with AI having the potential to enable skilled workers (such as nurses and nurse practitioners) to do higher-value work.56Autor (2024), and Bank for International Settlements (2024, pp. 109–112). Technology may also reduce some of the load of manual work in care services.57For example, there is scope to use technology in aged care facilities in a way that enables workers to focus on ‘human touch’ activities. See Lee et al (2024). We should be open to trying new things, and be quick adopters of what is proven to work elsewhere.

Health, aged care, and disability support are significant and growing areas of the economy and government spending, so more efficient delivery of quality services in these areas would yield broader benefits for living standards, both through better services and by reducing spending pressures into the future.


2.2.2 Promote a more dynamic economy

One of the best ways government can spur innovation, formation of new firms, and efficiency, is by promoting competition, through general and sector-specific measures.

There has been an increase in market power and a decline in competition in Australia since the mid-2000s, and this appears to explain part of the slowdown in productivity growth.58Hambur (2021). Some industries, notably transport and retail, have become more concentrated in recent years: Andrews et al (2023).

Recent competition reforms in relation to mergers and acquisitions are welcome,59See the Treasury Laws Amendment (Mergers and Acquisitions Reform) Bill 2024, which amended the Competition and Consumer Act 2010. and the commitment from Australia’s treasurers to revitalise National Competition Policy to improve living standards should be continued by the next federal government.60Treasury (2024c). The Productivity Commission has estimated that a revitalised National Competition Policy, with a selection of reforms such as lowering barriers to adopting overseas product standards and reforming medicine pricing, could boost GDP by up to $45 billion a year (1.7 per cent of GDP) and reduce prices by up to 1.5 per cent.61Productivity Commission (2024g, p. 2).

Another way governments can enhance competition is through measures that help consumers to make informed decisions. For example, greater transparency of medical specialist fees, and provider-level reporting of quality measures would improve competition in healthcare (see Chapter 6).

Government should also look to how Australian firms can get better at soaking up ideas from the rest of the world. Because the vast majority of innovations occur outside of Australia, there are major gains to be made from emulating the best.62Productivity Commission (2021b). Pre-pandemic, Australian firms had slowed in the rate at which they take up innovative technology and new approaches (Figure 2.7).63Andrews et al (2022).

Skilled migration is also an important channel for importing the best talent, ideas, and processes from overseas. Recent OECD research found that Australian regions with a higher share of migrants tend to have higher levels of innovation and productivity, and that this effect is larger for higher-skilled migrants.64OECD (2023a), and OECD (2024f).

Non-mining business investment has fallen as a share of GDP, dragging on productivity growth.65Bruno et al (2023). Reforming our corporate tax system could boost dynamism by generating more business investment (see Section 2.2.4).

Government should also continuously review whether regulations are holding back innovation, and it should abolish regulations that are no longer fit for purpose, or impose costs that outweigh their benefits.

Figure 2.7: Australian frontier firms have been slower than world-leading firms to adopt innovative technology and new approaches

Units: Cumulative labour productivity growth of Australian and global frontier firms, index 2002 = 100

Chart showing Figure 2.7: Australian frontier firms have been slower than world-leading firms to adopt innovative technology and new approaches
Note: The productivity frontier is defined as the top 5 per cent of high-productivity firms for each year.
Sources: Treasury (2023b) and Andrews et al (2022).

2.2.3 Make better use of our existing talent pool

Our labour market sits at the heart of Australia’s economic prosperity.

Wages and working conditions play a major role in people’s wellbeing. Having a job that is well-suited to your skills, experience, and aspirations is personally rewarding, and at an economy-wide level, a well-functioning labour market enables the growth that comes with making full use of the talents of all Australians.66Hsieh et al (2019) estimate that up to 40 per cent of growth in US living standards from 1960 to 2010 was due to better allocation of talent, as workforce barriers to women and minorities were reduced.

In economic terms, it is not just participation in the workforce that matters, but also that people can work the hours they need and want, that there is efficient matching between jobs, education, and skills, that people can move to higher-paid jobs over time, and that workers are able to adapt to the needs of a changing economy.

Given the growing workforce needs set out in Section 2.1.4, Australia cannot afford for barriers to hold people back from opportunities in the workforce.

Ensure high-quality childcare is broadly available and affordable

There are significant opportunities to use our existing talent pool to its fullest potential, starting with lifting women’s labour market outcomes to match their education and aspirations.

Australian women have among the highest levels of educational attainment in the world (and higher than men),6757 per cent of Australian women aged 25-64 have a tertiary degree, behind only Canada and Japan. This compares to 46 per cent of Australian men: OECD (2024a). and they enter the workforce at the same rate as men. Yet Australia still has highly gender-segregated occupations,68Westmore (2024). and women continue to do more unpaid work than men.69Women spend more than nine hours more per week on unpaid care and work than men: ABS (2022b).

Challenges in returning to work after having a child, including the cost and availability of childcare, can lead to long breaks from paid work, which can constrict future employment opportunities.70Women are much more likely to work part-time or variable hours after motherhood, and there is evidence that time out of work reduces promotions and job mobility, creating a large and persistent increase in the gender earnings gap: Bahar et al (2024).

There is significant human and economic cost to having people segregated between home and work, and within the workforce.71Borland (2022), and Hsieh et al (2019). While it will take a suite of measures, and time, to change the gendered norms that box in women’s and men’s choices in working life, widespread access to affordable childcare is a core labour market tool in the policy toolbox.72Humphries et al (2024).

Australia has made significant progress in recent years. Government investment in early childhood education and care has enabled many of the gains achieved to date, while also providing long-term benefits for children.73For example, the Productivity Commission found that the 2023 subsidy changes reduced workforce disincentive rates by an average of 4 percentage points, due to the higher subsidy rates and slower taper rate: Productivity Commission (2024b).

The relaxation of the activity test, to ensure each child can get three days of subsidised care, is an important step forward.74From 1 January 2026. The activity test will remain in place for the fourth and fifth days. It will particularly benefit disadvantaged households.75The activity test reduces affordability and access for low-income households in particular: ACCC (2024a). Productivity Commission modelling found that removing the activity test would almost exclusively benefit low-income families: Productivity
Commission (2024b).

But fees typically rise alongside subsidy increases,76ACCC (2024a, Figure 1.3). and a lack of accessible, affordable childcare still remains a barrier for many.

In 2024, nearly 300,000 parents reported that childcare-related issues such as cost or lack of availability affected their ability to work and their decisions about how much to work. Almost all of these parents (93 per cent) are mothers.77ABS (2025e). A quarter of these parents would like a job or more hours, but are not currently looking. The remaining three quarters do not currently want a job or more hours, but reducing childcare barriers may still affect their work preferences.

Nearly one quarter of regions in Australia are ‘childcare deserts’, where there are more than three children in competition for every place.78Hurley et al (2024). This compares the location of childcare centres to children, and could therefore understate availability if parents are willing to travel for early childhood education and care. In 2020, 34 per cent of regions were classified as a childcare desert.

There is a consensus across a range of inquiries79Economic Inclusion Advisory Committee (2024), Productivity Commission (2024b), Women’s Economic Equality Taskforce (2023), and Royal Commission into Early Childhood Education and Care (2023). that the federal government should support the uptake of high-quality early childhood education and care. There is also agreement across jurisdictions on universal access to public pre-school, to best prepare children to start school, and to better support working parents.80The Preschool Reform Agreement supports universal pre-school for all children in the year before school, and some jurisdictions such as Victoria and South Australia have committed to two years before school.

The challenge ahead is to design a system that is universally available and steps up from labour-intensive care for 0-to-3 year-olds, to school readiness and social development for 3-to-5 year-olds. Historically, Australia has relied on a system of partial subsidies delivered to parents. This requires the private and non-profit sectors to deliver services to meet demand, with regulations on quality, but no overall system management. But the supply response has not matched population need, and childcare fees have grown faster than inflation.81Subsidy increases typically lead to short-term reductions in out-of-pocket costs, but costs then rise again, usually at a faster pace than inflation. See ACCC (2024a, Figure 1.3).

Beyond the subsidy increases recommended by the Productivity Commission, the focus should be on supply-side measures. Some important steps have been taken, including boosting wages for childcare workers to help attract and retain the necessary workforce, and supply-side subsidies to increase the number of childcare places in under-served areas.82The federal government has announced a $1 billion Building Early Education Fund to expand supply in under-served areas.

The government should take a more active market stewardship role, use different funding models where appropriate to the setting, and consider the role of public provision of preschools or universal pre-kindergarten alongside a better designed and supported market for long day care. The government has already taken steps in these directions, and indicated appetite for further reforms. The next government should stay the course on these measures.

For many households, childcare costs are a major contributor to workforce disincentive rates, especially for secondary earners looking to increase the number of days they work.83Productivity Commission (2024b, Volume 2, pp. 269-273). But the government should also consider other measures to reduce the high workforce disincentive rates faced by mothers (see Section 2.2.5 on the design of family tax benefits).84The Productivity Commission found that high workforce disincentive rates are largely due to the tax and transfer system: Productivity Commission (ibid, Volume 1, p. 74).

Support flexibility in the labour market

A flexible labour market helps more Australians enter and stay in the workforce, and enables them to find work that better suits their needs and circumstances.

Job switching can boost productivity by moving workers into higher paying jobs and more productive firms.85Wong (2024), Buckley (2023), and Deutscher (2019). Pre-COVID, the proportion of workers who changed jobs each year had been declining steadily for decades, and it has been broadly flat in recent years.86D. Wood (2022) and Wong (2024). There was also a decline during the pandemic in productivity enhancing reallocation of workers into new jobs: Buckley (2023).

The federal government should pursue reforms to boost labour mobility, and enable people to more easily move to jobs that better suit their skills and needs. It should:

  • Ensure non-compete clauses do not unnecessarily restrict job switching, particularly for low-wage workers.87About one in five Australian workers are bound by non-compete clauses: ABS (2024a) and Andrews and Jarvis (2023). See also Productivity Commission (2024g).
  • Support states to replace stamp duty with a broad-based land tax and change planning laws and processes to allow higher-density housing in inner-urban areas and established suburbs (see Chapter 5).
  • Improve transport project selection to make it easier for workers to move around our cities,88For example, federal funding should not be committed until projects have been fully planned, costed, and assessed by Infrastructure Australia or the relevant state body: Terrill and Bradshaw (2024). and pursue other reforms to enable more efficient use of our existing infrastructure.89For example, the federal government should encourage the states to introduce congestion charging in our major cities: Terrill et al (2019).
  • Consider a potential role for unemployment insurance alongside Jobseeker (Section 2.2.3).
  • Enable workers and employers to negotiate more flexible workplace conditions. In particular, the government should not try to limit remote working that enables hybrid work practices.

Hybrid working can lift participation among under-represented cohorts, increase happiness, and doesn’t appear to weigh on productivity.90For example, see Birch and Preston (2024), Pabilonia and Redmond (2024), CEDA (2024), and Aksoy et al (2023). Remote working includes both working from home, and from other locations outside of the usual office location. However, there are many jobs for which remote or hybrid work is not feasible, and it is much
more prevalent for managers and professionals.
More innovative firms are more likely to allow remote or hybrid working, and remote working can increase the talent pool available to firms. The ability to work remotely has also helped boost women’s workforce participation and narrow the gender pay gap.91In Australia, remote working has helped narrow the gender wage gap: Birch and Preston (2024). Start-ups are more likely to use remote working: The Economist(2023). Remote work could also help boost participation among older workers and disabled Australians.92CEDA (2024), and Bloom et al (2024).

Improve skilled migration

Skilled migration delivers huge economic benefits for Australia, and there is room to boost these benefits. The current program is slow, expensive, and doesn’t always select the most-skilled candidates. Many migrants face barriers in Australia to maximising their potential and/or reside here with no prospect of gaining permanent residency.

The government has made some progress on improving the system, including abolishing the Business Innovation and Investment Program, reforming temporary skilled visas, and tightening the conditions of the Temporary Graduate visa.93The government has also made important changes to other parts of the migration system, including tackling migrant worker exploitation and addressing integrity problems in the student visa system.

The next government should build on these reforms and further boost the economic benefits of skilled migration by:

  • Reforming the points test by allocating visas to migrants who are likely to make the biggest economic contribution to Australia.94Coates et al (2024, Chapters 1 and 2).
  • Abolishing state and regional points-test visas and expanding the number of skilled independent visas granted each year.95Ibid (Chapter 3).
  • Making permanent employer-sponsored visas available for workers in all occupations, provided the job pays at least $90,000 a year, and temporary employer-sponsored visas to all those earning at least $75,000 per year.96Coates et al (2022a). The government is introducing a streamlined ‘Specialised Skills’ temporary skilled visa pathway for all skilled workers (except trades workers) earning more than $135,000.
  • Investing more in attracting skilled migrants to Australia and supporting them when they arrive.

Reform the skills recognition process

The current skills recognition process is too complex and burdensome.97Parkinson et al (2023, p. 158). It chokes the supply of, and raises the prices of, essential goods and services.98Bowman et al (2024, pp. 21–28).

Under the current system, many skilled migrants have to complete a skills assessment, and then separately meet ‘occupational licensing’ requirements (professional standards to be able to practice in their profession). For some skilled migrants, it can take months or years before they can work in their field of study.99The 2023 Kruk Review found that it can take general practitioners 35-to-130 weeks to be ready to practise in Australia, and they can spend up to $51,000 to be licensed to work: Kruk (2023, p. 6). This slow process is a major contributor to many migrants working in jobs below their skill level.100Coates et al (2024, p. 50).

Occupational licensing requirements also affect Australian workers. Some workers need to be registered and/or hold a licence in the state or territory where they wish to work, which can impede the movement of skilled workers across Australia.101Department of Employment and Workplace Relations (2024). In 2011, about 20 per cent of workers were covered by occupational licensing requirements: Bowman et al (2024, p. 5). Changes to the automatic mutual recognition process have helped improve labour mobility, but it remains imperfect. Occupational licensing is more stringent in Australia than in the best-performing OECD countries.102Bowman et al (ibid). Removing unnecessary occupational licensing requirements would boost GDP by up to 0.4 per cent.103Productivity Commission (2024g, p. 24).

The next government should commission a review to streamline the skills recognition process for skilled migration.104Coates et al (2024, p. 41).

The federal government should also work with state and territory governments to streamline occupational licensing; this could be done as part of the National Competition Policy reforms.105For example, by expanding the automatic mutual recognition process to more occupations and all jurisdictions. See Reform directive 10 in: Productivity Commission (2023, p. 12). See also Productivity Commission (2024g, pp. 23–34)

Increase JobSeeker and review the case for unemployment insurance

The maximum rate of JobSeeker – $389 a week for a single person – does not allow people to meet minimum basic needs.106The Morrison government increased JobSeeker by $25 per week in 2021 and the Albanese government increased it by $20 per week in 2023. A typical single person on JobSeeker receives just $56 a day, about 20 per cent of average full-time earnings.107Grattan analysis of ABS (2024b). Despite successive governments increasing JobSeeker, Australia’s unemployment benefits are among the lowest (and on some measures the lowest) in the OECD.108In 2023, the government increased JobSeeker by $20 per week. Before this increase, in 2022, JobSeeker was 32 per cent of previous in-work income after six months, the 2nd least generous of 34 OECD countries (and compared to an OECD average of 65 per cent of previous in-work income): OECD (2025c).

People on these payments have the highest levels of financial stress in Australia, and the low rate can be a barrier to people finding a job.109Economic Inclusion Advisory Committee (2024). A higher rate could lead to better job matching, because people would have more resources to search for a better, higher-paying job.110Farooq et al (2022).

The government should increase the rate of JobSeeker by at least $60 a week111D. Wood et al (2022a) recommended a $75 a week increase. The government subsequently implemented a $20 a week increase in 2023. Allowing for inflation, the remaining increase required is at least $60 a week. and benchmark the payment to increases in wages, to keep pace with community living standards.112The Economic Inclusion Advisory Committee 2024 report recommended that the government increase JobSeeker to 90 per cent of the Age Pension (and supplements), equivalent to an increase of about $126 per week, and to index the payment in line with wages growth (based on October 2024 payments): Economic Inclusion Advisory Committee (2024, pp. 49–51). Even with a $60 increase, JobSeeker would still be only 23 per cent of average full-time earnings (49 per cent of the full-time minimum wage), so an unemployed person would still have a substantial financial incentive to move into full-time work.

Increasing JobSeeker would reduce inequality and would do more to reduce poverty rates per budgetary dollar spent than other welfare changes.113Phillips et al (2018).

Australia’s approach to unemployment benefits – offering a flat rate regardless of previous income and how long a person has been on the payment – differs from many comparable countries.114One exception is that a single person, 55 or older, receives the highest rate if they have been on an income support payment for nine consecutive months. Most countries offer a higher but time-limited initial payment that is typically linked to a person’s previous income, and then a lower rate after that.115Blueprint Institute (2021). Time-limited unemployment insurance can boost overall productivity by enabling people to find a higher-paying job more suited to their skills, and could encourage people to move jobs knowing there is a stronger safety net.116Ibid.

The federal government should review the case for time-limited unemployment insurance, how to pay for it, and how it could operate alongside Jobseeker to better enable job mobility.


2.2.4 Pursue tax reform

Improving the efficiency of the tax system, by shifting Australia’s tax mix from more-costly to less-costly taxes, could materially boost Australians’ living standards.

In the longer term, more revenue will also be needed to manage the budgetary costs of rising community expectations and an ageing population, especially if economic growth remains lower for longer.

Meaningful tax reform is never easy, precisely because it affects many, if not most Australians.117Daley (2021). This is the ‘grand bargain’: we contribute as we are able, and in return receive services and safety nets when we need them.

Reduce income tax breaks

There are many concessions and minimisation opportunities in Australia’s personal income tax system. Curbing these ‘leakages’ would broaden the income tax base and, over time, reduce governments’ temptation to rely on bracket creep to do the ‘heavy lifting’ on budget repair.

Broadening the income tax base offers a major opportunity for structural reform, would reduce distortion of economic behaviour, and has the potential to raise more than $20 billion a year.118D. Wood et al (2023, Figure 4.3).

Substantive options include reducing the Capital Gains Tax (CGT) discount from 50 per cent to 25 per cent, winding back negative gearing,119Grattan has proposed Australia follow international practice, and not deduct losses from passive investments from labour income. better targeting superannuation tax concessions, and setting a minimum 30 per cent tax on all trust distributions.120As recommended in 1999 by the Review of Business Taxation: Ralph et al (1999). See also ACOSS (2022, pp. 54–56). A 30 per cent tax rate also aligns with some of the income tax changes made as part of the Stage 3 tax cuts.

The CGT discount and Australia’s unusual negative gearing arrangements distort investment decisions, increase price volatility in property markets, and put some upward pressure on house prices (Chapter 5). They provide limited benefit in terms of increasing the rate of new housing development.121Daley et al (2016).

Similarly, superannuation tax concessions go far beyond their intended purpose and should be tightened. Chapter 9 outlines reforms that would better align super tax breaks with the goals of superannuation, while saving the budget at least $10 billion a year today, and much more in future.

Broaden and/or raise the GST

Australia collects less in consumption taxes than similar countries, and our GST tax base is narrow by international standards. The GST base is also being eroded over time as a growing share of consumer spending goes on GST-free items. NSW Treasury estimated in 2021 that by 2029-30 the share of consumption subject to GST would decline to about 50 per cent, down from more than 60 per cent when the GST was introduced.122NSW Treasury (2021, pp. 96–97).

Increasing collections from the GST by broadening the base and/or raising the rate would diversify Australia’s tax base. Raising more tax through the GST would also make Australia’s tax system more efficient, because the GST creates less distortion in incentives to save and invest. It is a hard tax to avoid, and it acts as a lump-sum tax on accumulated wealth by collecting from households such as well-off retirees who are living off savings and otherwise pay little tax.123Daley and D. Wood (2015).

But because it is a flat tax, it hits low-income-low-wealth households hardest, since they spend a larger share of their income on essentials. Some of the income from raising and/or broadening the GST would need to be used to cushion the impact on vulnerable households.

GST reform has been politically challenging because the revenue is passed through to the states and territories, but the federal government wears the political costs of reform and would foot the bill to cushion the impact on vulnerable households.

But the states have limited options to raise revenue efficiently themselves, and face increasing spending pressures, particularly in health and education.

Extra revenue from GST reform could be shared between the federal government and the states and territories to bring everyone to the table.124Ibid.

There are two ways to increase GST revenue. The first is to raise the rate. In 2015, Grattan Institute analysis showed that a 15 per cent GST with a compensation package that on average compensated the bottom 40 per cent of households could raise about $11 billion after compensation.125See Daley and D. Wood (ibid) for the full costing details. If federal and state governments shared the extra revenue 50:50, this would raise about $6 billion (in today’s dollars) for the federal budget.

The second way is to broaden the GST base by removing some of the concessions that currently apply. Growth in exempt items, including private healthcare and education spending, as a share of household consumption, have contributed to the erosion of the GST base over time. Including these areas would help GST revenue keep pace with economic growth.126NSW Treasury (2021, Chapter 5).

Support states to replace stamp duties with general property taxes

The biggest tax reform prize in Australia would be to replace state stamp duties with general property taxes.

Stamp duties are inefficient taxes: they discourage people from moving to housing that better suits their needs, and they discourage people from moving to better jobs.

The federal government should encourage the states and territories to make this reform (see Chapter 5). The principle of federal financial support for state-level reform is well-established. Under the National Competition Policy reforms that started in the mid-1990s, the federal government paid the states nearly $6 billion over 10 years in exchange for much-needed regulatory and competition reform.

Redesign resource rent taxation

Australia is a major producer and exporter of fossil fuels, yet despite the extraordinary profitability of fossil fuel extractors, government revenues from fossil fuels are relatively small.127Burke (2023). Revenue from the Petroleum Resource Rent Tax (PRRT) peaked at $2.4 billion in 2001 but was just $800 million in 2020: Kraal and Heffron (2022, p. 598). Giving Australians a greater share of resource rents offers much less economic downside than increasing other taxes on business.

The government should consider a resource rent tax on non-renewable resources such as coal and iron ore.128Henry et al (2009, pp. 47–48) recommended a uniform resource rent tax set at 40 per cent, administered by the federal government, with the allocation of revenue and risks negotiated between the federal and state governments. The government should also consider including critical minerals such as lithium, cobalt, and rare earths in any future resource rent tax, because these minerals will be in strong demand in coming years to meet the demands of a net-zero global economy.

The Petroleum Resource Rent Tax (PRRT) should be redesigned to raise more revenue and support the energy transition (see Chapter 4).

Consider other tax reform options

The next federal government should consider a range of other tax reforms.

It should consider reform of household savings taxation. About 60 per cent of household savings are concentrated in owner-occupied housing and superannuation, where the returns to savings are taxed lightly, or not at all.129ABS (2022a, Table 3.7). Other savings vehicles, such as bank accounts and international shares, are taxed at much higher rates. A more consistent treatment of household savings would encourage households to seek the best pre-tax return on their savings, and to invest their savings in assets that best suit their circumstances and risk-preferences.130For example, the Henry Tax Review recommended taxing most savings, such as most interest income, net residential rental property income, and capital gains, at marginal tax rates of personal income tax, after applying a 40 per cent discount to that income: Henry et al (2009, p. 62). See also Varela et al (2020).

The next federal government should explore wholesale reform of Australia’s corporate tax system to boost business investment. Potential options include a destination-based cashflow tax or an allowance for corporate equity.131Garnaut et al (2020).

Inheritance taxes have substantial economic merit132Inheritances taxes are less distorting than most other taxes including income taxes: Henry et al (2009, pp. 137–140). so should also be considered. Taxes on inheritances are deeply unpopular though, so it will be necessary to identify the right model, and bring the Australian people along.133Emslie and D. Wood (2019). At the very least, we should stop subsidising inheritances. This means ending rules that feed the size of bequests at the expense of taxpayers, including overly generous tax treatment of the family home (see Chapter 5) and overly generous superannuation tax breaks (see Chapter 9).


2.2.5 Implement sensible savings

The next federal government should pursue some sensible savings to improve the structural budget position.

Improve infrastructure and defence procurement

The single best discipline on government spending would be to adopt better processes for infrastructure and defence procurement.

The federal government spends more than $60 billion a year on defence and transport infrastructure.134$62.5 billion in 2024-25: Treasury (2024a, Tables 6.5 and 6.15). It is critical that this spending is cost-effective. Many individual projects run into the tens of billions of dollars and can run for more than a decade.135For example, Submarines, Joint Strike Fighter, NBN, Suburban Rail Loop in Melbourne, WestConnex in Sydney, and North East Link in Melbourne. See Terrill et al (2020) and ANAO (2023).

One of the biggest cost savings available to the government is to stop making bad decisions – poorly conceived decisions and premature announcements have proved very costly, especially as ‘megaprojects’ have become more common.136Terrill and Danks (2016), and Terrill et al (2020). This includes when deciding which state government projects should receive federal funding.

Given the infrastructure requirements for the net-zero transition (before any consideration of even more expensive plans for nuclear power), the construction requirements to meet our housing needs, and the substantial build up in the public infrastructure pipeline,137Infrastructure Australia estimates the Major Public Infrastructure Pipeline for the next five years to be $213 billion, or 25 per cent of construction activity:
Infrastructure Australia (2024).
it is critical that the government prioritise on major transport and defence projects, including being prepared to delay or ‘mothball’ prior commitments.

The government also needs better upfront assessments of Australia’s transport infrastructure138Infrastructure Australia plays an important role here in identifying projects of national significance – governments should pay more attention to Infrastructure Australia’s guidance. and defence capability needs, to strengthen discipline in decision-making and improve procurement processes.139For example, governments should avoid locking-in early, and signing contracts before the details have been fleshed out. Buying smaller, more regularly, and ‘off-the-shelf’ reduces risks and cost.

Undo the WA GST deal

The ‘WA deal’ – struck in the lead up to the 2019 federal election – made two major changes to the principles on which GST revenue is distributed to states and territories. First, states are now benchmarked to the stronger of either NSW or Victoria, rather than to the fiscally strongest state (WA); and second, the deal guarantees all states at least 75 cents in the dollar of GST revenue on a per-person basis. Both changes primarily benefit WA, hence it is called the ‘WA deal’.140See Eslake (2024) for a full explanation and history.

The federal government agreed to temporarily underwrite the cost of compensating other states, who would otherwise have gone backwards under the WA deal. This compensation now costs the federal budget more than $6 billion a year.141$6.2 billion in 2024-25: Read (2024). And the federal government recently extended compensation for a further three years to 2029-30.

In effect, the federal government spends more than $6 billion a year to support superior government services in the only state that is running a strong surplus, undermining the principles of equalisation on which the GST is distributed.142As the Commonwealth Grants Commission noted in 2022-23: ‘Under the previous GST distribution arrangements, each state’s GST share was calculated so that its assessed revenue (including GST) equalled its assessed expenditure. Western Australia is assessed to have revenue per person greater than assessed expenditure per person. All other states are assessed to have slightly less revenue than expenditure’: Commonwealth Grants Commission (2022, p. 5).

Winding back the deal will undoubtedly raise political challenges in WA, but the current deal is expensive and unjustified. The next federal government should start working towards a new deal in the interests of all Australians.

Abolish the Family Tax Benefit part B for couples

Family Tax Benefits A and B support low- and middle-income families with the costs of raising a child. FTB-A is paid per child and is designed to assist with the direct costs of children. FTB-B is designed to assist parents who are not in paid work because they are caring for children.

FTB-B plays an important role in supporting single parents,143The National Commission of Audit (2014) recommended continuing to pay the maximum rate of FTB-B to single parents with a child under 8. but the case for supporting single-income couple families is weaker. FTB-B for couples increases barriers to workforce participation for the second earner in a couple.144It creates a disincentive to commence work because the payment reduces as income increases and drops out entirely by the time a second earner’s income reaches $33,653 a year (if the youngest child is younger than 5) or $26,207 a year (if the youngest child is 5 to 13). If the primary earner earns more than $117,194, the couple won’t be eligible for FTB-B at all: Services Australia (2024a). See D. Wood et al (2020). It also raises equity questions, because it provides more to families where one parent works very little or not at all, than to families with the same income but both parents working.145Henry et al (2009), and National Commission of Audit (2014).

The government should abolish FTB-B for couples, while maintaining the payment for single parents (or rolling it into the Parenting Payment for single parents). This would save the budget about $1.3 billion a year.146D. Wood et al (2023, p. 30). Some of the families affected would be very low income, so this change may need to be packaged with our recommended increases to other payments such as JobSeeker (Section 2.2.3) and Commonwealth Rent Assistance (Chapter 5).

Mitigate cost growth to sustain fast-growing programs

The government also needs to make changes to ensure fast-growing programs in health, the NDIS, and aged care are sustainable.

Chapter 6 discusses ways to mitigate cost growth in hospitals, and potential savings in pathology and pharmaceuticals. And Chapter 8 discusses how to make the NDIS more sustainable.

On aged care, government expenditure is expected to grow from 1.1 per cent of GDP in 2022-23 to 2.5 per cent of GDP by 2062-63 (Figure 2.6).147Treasury (2023a, Chart 7.5). The new Aged Care Act, which will take effect from July 2025, lays the foundations for a new rights-based model of aged care. The Act also aims to reduce costs by improving access to in-home care services and requiring wealthier people to contribute more to their care.148Via changes to means-testing for accommodation and non-clinical care services,
and raising the lifetime cap on individual contributions to aged care costs.
But more will need to be done to better target public funds to help mitigate significant cost growth. Some options include further expanding home care,149Australians overwhelmingly prefer home care to residential aged care: Royal Commission into Aged Care (2021). And countries with fiscally sustainable
rights-based models typically have a high proportion of at-home aged care: Dyer et al (2020). Expanding home care won’t necessarily deliver absolute savings because of current unmet demand for care, but if people with less-complex needs are cared for at home for longer, it will make aged care cheaper per person and provide better care to more people: D. Wood et al (2023).
counting a greater portion of the family home in the means tests for residential aged care,150While maintaining a generous buffer. See D. Wood et al (ibid). and recouping the cost of aged care from people’s estates.151Again, while maintaining a generous buffer. See D. Wood et al (ibid).

Pursue other sensible savings

Further options for savings are discussed throughout this Orange Book, including winding back fuel tax credits (worth about $4 billion a year, see Chapter 3) and counting more of the family home in the Age Pension asset test (worth about $4 billion a year, see Chapter 9). Better processes for grants and government advertising (Chapter 10) may also deliver savings.

The Australian Centre for Evaluation could also play a role in identifying and reducing ineffective spending.

Bibliography


IN THIS CHAPTER

3 The net-zero economy

Australia is committed to achieving net-zero greenhouse-gas emissions by 2050. Meeting this target will require transformational change across the economy, with no sector being excluded:

  • The electricity system, a key energy supply for more than a century and the largest source of emissions, will become the dominant energy source while being almost totally re-engineered;
  • Fossil-based gas, such as coal gas or natural gas, has been a valued energy source for almost 200 years. It will disappear from most of its traditional roles but play a critical cameo for some years to come;152The energy system in the form of electricity and gas is discussed in detail in Chapter 4.
  • Heavy industry will require significant and fundamental technology developments;
  • Transport, across all forms, will move from oil-based fuels to a mix of renewable-based fuels;
  • Agriculture will need to change in ways yet to be fully identified;
  • Emissions remaining in 2050 will need to be offset by removal of greenhouse gases from the atmosphere.

Unlike the electricity sector, and the ‘land use, land use change, and forestry’ sector, where emissions have fallen dramatically since 2005, other sectors have made little progress towards net zero (Figure 3.1).

Figure 3.1: Australia’s emissions have not declined significantly, except in the electricity and ‘land use, land use change, and forestry’ sectors

Emissions (MtCO2-e) and percentage change, 2005 to 2025

Chart showing Figure 3.1: Australia’s emissions have not declined significantly, except in the electricity and ‘land use, land use change, and forestry’ sectors.
Notes: MtCO2-e: Millions of tonnes of carbon dioxide-equivalent. The Industries category consists of stationary energy emissions from energy, mining, manufacturing, and military sectors, plus fugitives and industrial processes emissions. Agriculture emissions are the sum of agriculture emissions plus the stationary energy emissions of the agriculture sector. Emissions from land use, land use change, and forestry have declined due to policies that encourage a reduction in land clearing and an increase in reforestation.
Source: Grattan analysis of DCCEEW (2024a).

Progress already made and new policies to cover some of these other sectors make the current 2030 target of a 43 per cent reduction below 2005 levels achievable, if challenging. The momentum needs to be maintained. The next government will set Australia’s 2035 target. Based on considerations of climate science, economics, and technology, the 2035 target should be set as a range of 65 per cent to 75 per cent below the 2005 level.

With input from the Climate Change Authority,153Climate Change Authority (2024a). the federal government is developing sector-based plans to support the transition. To be successful, these plans will need to be underpinned by clear policies. Ideally, they will have sector support or endorsement, and in aggregate they will need to align with the above targets.

The consequences of climate change are wide-ranging yet uncertain in the extent of their economic, environmental, and social impact. Of greater certainty is that the consequences of unmitigated climate change will be very bad for Australia.154T. Wood et al (2020).

Over the past decade, we have seen adverse impacts on multiple sectors, including tourism, agriculture, property, mining, and health. And assessments of future impacts now extend across the economy.155Treasury (2023a).

The critical question for Australia’s governments is not whether we should deliver a net zero transformation by mid-century, but whether we do it well or badly. This industrial revolution to a timetable requires a clear Net Zero Plan that is implemented across federal and state governments and in all sectors of the economy; with strong support and active participation across communities.

Australians need the next government to enunciate the necessity for the Net Zero Plan, how it will achieve the targets, and any other consequences. The central element of the current plan – to stay the course to net-zero emissions on a mostly renewables pathway – is neither easy nor cheap. But that is not a reason to present Australians with a seemingly simple promise for a nuclear solution underpinned by questionable assumptions.156Section 4.2.3 discusses what the next government should do about nuclear power. Such a plan risks not meeting emissions targets, higher costs than estimated, and reliability threats as ageing coal-fired power stations becomes less reliable. It creates material uncertainty for investors and offers no relief to immediate cost-of-living pressures.


3.1 Where we are

3.1.1 Responding to climate change will reshape the Australian economy

Australia, along with all parties to the Paris Agreement, has committed to the global goal of holding the increase in global average temperatures to well below 2°C above pre-industrial levels and pursuing efforts to keep warming to less than 1.5°C. There is bipartisan support for a target of net-zero greenhouse-gas emissions by 2050.

Net zero will reshape the economy.157T. Wood et al (2022). Some activities such as fossil fuel extraction, are essentially incompatible with a net-zero economy. Then, there are activities such as steel-making that may be able to transform through economic, low-emission technologies. And there are activities such as low-emissions extraction and processing of critical minerals which are insignificant today but where Australia could capitalise on globally significant comparative advantages.

Patterns of investment will also change, with greater emphasis on carbon-neutral technologies and on reducing exposure to climate-related risks in areas prone to natural disasters. Australians will increasingly adjust their consumption patterns to make decisions in their economic interest, including transitioning away from gas in homes158T. Wood et al (2023a). and adopting electric vehicles.

During this current term of government, there has been growing recognition of the need for structural transformation. Policies such as the Safeguard Mechanism, New Vehicle Efficiency Standards, sectoral emissions reduction plans, and the Future Made in Australia framework, represent significant progress. However, much work remains to be done.

3.1.2 Australia is on track for its 2030 target – provided everything goes right

Australia’s emissions are now about 28 per cent below the level of 2005, the reference year for emissions targets. The government’s most recent projections show achieving the 2030 target of a 43 per cent reduction below 2005 levels is achievable (see Figure 3.2). However, this outcome relies almost entirely on reducing emissions in the electricity sector which, as discussed in Section 4.1, is proving to be a challenging task

Recent policy reforms to reduce emissions outside electricity, such as the Safeguard Mechanism and the Vehicle Efficiency Standard, have not been in place long enough to make a substantial contribution to reducing emissions. In any case, both are designed to achieve gradual reductions over a longer period.

With these policies in place, 83 per cent of industrial emissions and 11 per cent of transport emissions are subject to constraints. This leaves 68 per cent of total emissions unconstrained.159Grattan Institute calculation based on 2023 emissions data. In particular, most transport emissions (88 per cent), all emissions from agriculture and household/commercial gas use, and the vast majority of emissions from waste (97 per cent) are unregulated, as are 17 per cent of industrial emissions.

Figure 3.2: To hit net zero by 2050, Australia will need to cut emissions faster

Emissions (MtCO2-e)

Chart showing Figure 3.2: To hit net zero by 2050, Australia will need to cut emissions faster
Notes: MtCO2-e: Millions of tonnes of carbon dioxide-equivalent. CCA: Climate Change Authority. Projected emissions are the government’s baseline scenario.
Sources: Actual and projected emissions: DCCEEW (2024a). CCA target range: Climate Change Authority (2024b). Sum of state targets: Climateworks Centre (2024).

3.1.3 The 2035 target is critical for staying on track to 2050

The 2035 target will be a critical checkpoint towards achieving net zero by 2050. Policy reversals by the new US administration and global political tension in the lead-up to the 2025 federal election has resulted in neither major party being prepared to make a pre-election commitment to a 2035 target.

The government’s projections suggest that if current policies are implemented successfully, and domestic and international trends eventuate, emissions will fall to 51 per cent below 2005 levels by 2035, and 56 per cent below by 2040.

The Climate Change Authority (CCA) has suggested reductions of 65 per cent to 75 per cent by 2035 are needed to stay aligned with a 1.5°C pathway, the global objective of the Paris Agreement.160Climate Change Authority (2024b).

State and territory governments have their own emissions-reduction targets. These add up to an estimated 66 per cent to 71 per cent reduction in Australia’s emissions from 2005 levels by 2035 (Figure 3.2).161Climateworks Centre (2024).

Australia’s ability to meet its emissions reduction goals relies on aligning federal and state targets and providing a clear, predictable policy environment. Divergent targets and policies across jurisdictions create unnecessary uncertainty for businesses and make investment decisions more complex.

3.1.4 An industrial revolution with a deadline

To meet long-term emissions reduction targets, Australia’s industrial sector must be transformed within two-and-a-half decades. Carbon pricing, via the Safeguard Mechanism, provides some incentive. But this price is too low to bring about the transformation at the scale and pace required. Australia will also need a consistent and sustained framework for an industry policy that is fit for the 21st Century.

The building blocks for this framework have been developed in the form of funding tools and mechanisms. They include the National Reconstruction Fund, Australian Renewable Energy Agency, Clean Energy Finance Corporation, Northern Australia Infrastructure Facility, Hydrogen Headstart, Export Finance Australia, and the Hydrogen and Critical Minerals Production Tax Incentives.

They need to be combined into a coherent framework to manage the risks and deliver the opportunities that can derive from Australia’s competitive advantages in a net-zero world. The Future Made in Australia initiative can form this framework.

Building the framework does bring risk of three classic industry policy traps: over-reaching for competitive advantage, picking losers, and short-term policy thinking. These risks can and should be managed or avoided by including targeted mitigation mechanisms in the governance and decision-making processes of the policy framework.

Where the opportunities lie

Australia does not need to manufacture every clean energy technology domestically. Instead, we should focus on developing and commercialising innovative technologies where we have a comparative advantage.

Australia has resource endowments that create significant opportunities to foster new globally competitive industries that can boost our economic prosperity while supporting domestic and global decarbonisation. These include hydrogen, green iron, green ammonia, and critical minerals.

Demand for critical minerals for clean energy technologies is expected to increase by close to 300 per cent from 2023 levels by 2040 as the world moves towards net-zero emissions.162Grattan analysis of International Energy Agency (2024), Net Zero Emissions by 2050 scenario. These commodities, such as lithium, copper, cobalt, nickel, and rare earth elements, are key components in renewable energy technologies.

Global demand for Australian thermal coal and liquefied natural gas (LNG) exports are expected to decline as our trading partners move toward net-zero emissions. However, Australia is fortunate to have some of the world’s largest reserves of critical minerals such as lithium, cobalt, and rare earth elements.163DISR (2024a).

Australia is already the world’s largest producer of lithium and is well placed to meet future global demand, with a projected 24 per cent increase in Australian lithium extraction by 2026.164DISR (2024b). Additionally, Australia has potential for more undiscovered minerals, with about 80 per cent of the Australian continent largely under-explored.165DISR (2023).

3.2 What we should do

All governments need to plan more directly for the physical and economic consequences of a changing climate, and to integrate climate change issues into all decisions on infrastructure planning, land use, and resource extraction. This will require greater policy coordination across jurisdictions.166T. Wood et al (2021a).

3.2.1 Deliver a consolidated Net Zero Plan

To provide a predictable environment for investors and consumers, the next federal government should maintain the 2030 target. The 2035 target should be set as a range of 65 per cent to 75 per cent below the 2005 level.

Climate science tells us that 65 per cent is the minimum target that Australia should adopt if we are to contribute to the objective of limiting the global temperature rise to 1.5°C above pre-industrial levels. The risks to Australia from unmitigated climate change are very bad and the opportunities in a net-zero world are very good. Australia is a small, open economy and should make the 75 per cent target conditional on similar commitments and actions by our biggest trading partners. The federal government will need to work with the states and territories, which have their own targets, to develop and implement workable policies to meet the national target.

The government is developing plans intended to provide a policy framework to reduce emissions in every sector towards the net-zero goal. These plans should be consolidated into a national Net Zero Plan, and the government must signal that every sector has to reduce emissions from current assets and activities. In particular, action is required in agriculture, industry emissions outside the Safeguard, and transport beyond light vehicles.

The Plan should also lay out a framework such that decisions on future assets and activities are made with net zero in mind. This includes government decisions (for example on infrastructure); and private sector and household decisions, from opening new mines to building new housing or buying a new car. In this way, the costs of achieving net zero will be efficiently distributed, and the national target can be achieved.

The history of carbon pricing policies in Australia means that an economy-wide, explicit carbon pricing mechanism remains beyond practical political acceptability. Although second-best policy, implicit sector-based carbon prices already exist and are growing. As part of a lowest-cost Net Zero Plan, the government should develop the basis of an enduring, economy-wide carbon pricing framework.

The Capacity Investment Scheme, the strengthened Safeguard Mechanism, and the New Vehicle Efficiency Standard are key to regaining momentum. The government must avoid any weakening of the Safeguard Mechanism or the New Vehicle Efficiency Standard, and put the electricity market on a footing to allow it to exit the Capacity Investment Scheme (see Section 4.2.2).

The Safeguard Mechanism should be progressively strengthened

The Safeguard Mechanism is due for review in 2026-27. The review should focus on sharpening signals to transform the industrial sector to one that can flourish in a net-zero global economy. In particular, this focus should include considering a carbon border adjustment mechanism to level the playing field between imports and local production;167For more detail, see T. Wood and Reeve (2024a). increasing the cost-containment cap price to one more aligned with the global carbon price required to meet next zero;168The carbon price imposed by the Safeguard is insufficient to drive the deployment of new, green commodity production. This is explored in detail for steel, alumina, and ammonia in T. Wood et al (2023b). lowering the participation threshold progressively to cover more facilities; and potentially expanding coverage to the electricity sector.

The review should also propose a revised methodology for setting performance benchmarks for new facilities. Current rules require new facilities to achieve world’s best practice, as measured against existing global facilities. The result is to merely encourage more efficient versions of incumbent technology, and disadvantage new low- or zero-emissions technologies which will be needed for a vibrant net-zero economy – akin to setting a standard for new cars based on the best performance of horses.169This is explored in detail in T. Wood and Reeve (2024a).

Finally, as noted in Section 4.4.2, a Net Zero Plan requires a plan to get off gas.

3.2.2 Reform fuel tax credits to reduce transport emissions and fuel budget repair

Fuel tax credits are gnawing away an ever-growing share of fuel tax revenue: a decade ago, credits reduced gross fuel tax revenue by 30 per cent; by 2023, this was almost 40 per cent.170Terrill et al (2023). These credits are an implicit subsidy on consuming fossil fuels – an outcome that is at odds with both parties’ goal of reaching net-zero emissions.

In 2023, Grattan Institute estimated that winding back fuel tax credits could reduce the structural budget deficit by about 10 per cent, or $4 billion a year.171Ibid. The impact on households would be extremely small: prices at the supermarket would increase by an average of about 0.35 of 1 per cent – or 35 cents on a $100 grocery shop. In the absence of a carbon price, the change would go towards recognising the environmental impact of the vehicles’ emissions.1722023 dollars. Proposed reforms included adjusting the rate paid by heavy vehicles to match that paid by light vehicles, and reducing the rate for off-road vehicles and machinery: Terrill et al (ibid).

3.2.3 Build a comprehensive industry policy on the Future Made in Australia framework

Realising the vision of a sustainable manufacturing renaissance based on renewable energy, hydrogen, and critical minerals requires three elements:

  • A disciplined approach to identifying and supporting those industries that will build on Australia’s comparative advantages in a low-emissions world.
  • Differentiating where overcoming supply chain challenges genuinely requires local manufacturing, and where other means are more economic.
  • A high level of cooperation between government and industry, and a strong governance structure.

Billions of dollars and clear and consistent policy are needed. Done well, and with bipartisan commitment, the Future Made in Australia framework could underpin realising Australia’s opportunities in a cooperative, strategic partnership between government and industry, while avoiding valid concerns about traditional industry policy.

Progressing Future Made in Australia has meant three activities: introducing the National Interest Framework, a formal process for assessing where and how the government could apply industry policy, including public funding to unlock private investment; connecting the bundle of disconnected funding measures described in Section 3.1.4; and selling the framework via a publicity campaign. The next government should use the National Interest Framework to reorganise, streamline, and refocus industry policy, so that funding flows only to sectors that build on Australia’s comparative advantages, are compatible with a net-zero global economy, and are capable of delivering sustained and substantial net benefits to the Australian economy in return for assistance.173See T. Wood et al (2022) for more detail on prospective sectors. Gas, LNG, and coal are not candidates.

3.2.4 Develop and improve social licence for the transition

The transition to net zero will reshape every part of the Australian economy. We will all be affected, and we all have a part to play. For this transformation to be successful, governments must frame it as something that is done by, and with, ordinary Australians, not done to them. Inclusive processes and clear communication will be central to securing public trust and engagement.

The first priority is to ensure that energy remains reliable and affordable for everyone. Governments must combine clear policies, effective communication, and targeted support to households and businesses during the transition. Simultaneously, governments must communicate clearly and consistently over time about the changes required, such as getting off gas, so that individuals and communities can plan and adapt effectively.

The costs of a changing climate are already accumulating and often impose a greater burden on those least able to afford them. The next government should make this the basis of its honest narrative with Australians: the Net Zero Plan is not simple or cheap and there are consequences and sometimes-difficult trade-offs – but failing to address climate change is not an available choice.

Regions hosting carbon-intensive industries and new renewable electricity infrastructure will be most affected by the transition and should be empowered to take charge of their economic futures. Governments should work closely with these regions to help them decide how and when to diversify their economic base. The Net Zero Economy Authority should include regional leadership as part of its remit, ensuring that communities lead their own transitions.174T. Wood and Reeve (2024b). This will help build local ownership of the process and ensure solutions are tailored to regional needs.

Bibliography

IN THIS CHAPTER

4 Energy

The energy transition is crucial to achieving net-zero emissions by 2050, and the federal government’s legislated 43 per cent reduction in emissions below 2005 levels by 2030. The current government is relying heavily on decarbonising the electricity sector to achieve these targets.

The primary drivers of electricity sector decarbonisation have been policies to increase renewables, and a central marker is the federal government’s further target of 82 per cent renewables by 2030.

At present, coal plant owners are closing their generators faster than replacement capacity – renewables, storage and gas back-up, and transmission – can be built, in part because market signals are insufficient for investors to commit to these new assets. Poor coordination, community opposition, and outdated market designs threaten reliability, affordability, and decarbonisation of the energy system. Governments have resorted to contracts with individual coal generators to protect against early closure. Reform is urgent to align market design, governance, and planning with the demands of a net-zero energy system.

The task ahead for the electricity sector is threefold: build sufficient new renewable generation, storage, and transmission to replace coal generation as it is retired; continue to expand the system beyond that, to provide sufficient electricity to support electrification; and through both stages, keep the system affordable and reliable.

The federal government should not invest any more time or energy in nuclear power, beyond positioning Australia to be a fast adopter of small modular reactors if they become economically feasible.

The government also needs to begin restructuring the gas market so gas can play its diminishing, but critical, role in the transition.175In this chapter, ‘gas’ refers to natural (fossil-fuel) gas. The government should find an immediate fix for the southern states’ impending gas shortfall. It should revise the Future Gas Strategy to coordinate a pathway to get most of the economy off gas.

The Australian Domestic Gas Security Mechanism (ADGSM) and Mandatory Code of Conduct should be updated to reflect these changing circumstances. And the government should consider redesigning the Petroleum Resource Rent Tax to maximise the revenue from it while gas is still a material part of the economy.

4.1 Electricity: where we are

4.1.1 We are in a period of rapid change

The technology mix in the electricity market is changing rapidly, driven by state and federal policies to encourage greater use of renewable electricity and thereby decarbonise the electricity sector. As discussed in Chapter 3, this has meant the electricity sector has been the main driver of Australia’s emissions reductions over the past 10 years.

The changes in physical characteristics of renewable technologies have also brought changes in market risks, both operational and financial.

Ownership of coal generators is becoming less attractive. Higher maintenance costs and greater competition from renewable energy in the wholesale market are accelerating retirement rates. In a scenario where state and federal renewable energy targets are achieved, it is possible that all coal generators in the National Electricity Market (NEM) will be retired by 2038.176Australian Energy Market Operator (2024a).

Demand in the NEM has been flat for more than 10 years. But over the next 25 years, demand is projected to grow significantly as transport and gas use electrifies, and the number of energy-hungry data centres grows (Figure 4.1).

Figure 4.1: Electricity demand is forecast to grow dramatically to 2050, and most of this demand will be met by renewables

Generation mix 2020 to 2050, terawatt hours

Chart showing Figure 4.1: Electricity demand is forecast to grow dramatically to 2050, and most of this demand will be met by renewables
Notes: National Electricity Market (NEM) only. Biomass excluded as insignificant (0.4 per cent of demand in 2050).
Source: Grattan analysis of Australian Energy Market Operator (2024a).

4.1.2 The most immediate challenge is new capacity

To keep electricity supply reliable, there can be no gap between coal retirement and new generation taking its place. Such total system planning takes more than just building solar and wind farms: these assets must be able to connect to the grid to dispatch their electricity. To date, investment in wind and solar farms took advantage of available capacity on the existing transmission system. This capacity has now been largely exhausted, so new transmission lines must be built to link the best renewable resources to the existing grid and demand centres.

Replacing coal also means replacing the grid security and reliability services it supplies, with firming capacity such as batteries, pumped hydro, or gas.

The NEM is not delivering on this goal. Attempts to reform the market have failed over and over again, leaving successive federal governments to patch together ad-hoc measures such as committing to Snowy 2.0 without a feasibility study; attempting to underwrite new gas generation; underwriting new transmission, renewable generation and storage; and funding batteries. Each of these interventions may have been necessary to address immediate problems with the performance of the market, but collectively they have not materially improved resource adequacy and have created more uncertainty for investors.

4.1.3 Co-ordination is needed

Renewables’ share of electricity generation has grown from 10 per cent early this century to about 40 per cent today. The federal government’s Capacity Investment Scheme (CIS) is focused on lifting this to 82 per cent by 2030. This is achievable if everything goes smoothly.

The Integrated System Plan (ISP)177Ibid. is meant to set out the lowest-cost mix of generation, transmission, and storage to reliably meet consumers’ energy needs and Australia’s emissions targets. It takes into account federal, state, and territory policies but does not assess the practicalities of such policies. Despite the existence of the ISP, building new transmission and new generation to support the energy transition is running behind schedule. Issues such as cost overruns, cost-sharing arrangements, and securing social licence from regional communities are big challenges. Planning and regulatory approvals are too complex and too slow.

4.1.4 The rise of the consumer

The NEM was designed to supply passive consumers. But about 44 per cent of households now have rooftop solar,178Four million household solar installations (DCCEEW (2024b)) divided by nine million households across the NEM (DCCEEW (n.d.)). and increasing numbers are buying electric vehicles. Smart appliances now allow load to follow generation, whereas the market was designed for the opposite.

Unless well-managed, consumer enthusiasm for smarter, cleaner technology could cause higher costs for all electricity users, even while the technology saves money for individuals.

4.2 Electricity: what we should do

4.2.1 Overhaul system planning

The role of the ISP should be extended to help solve the coordination problem, with a clear, credible plan for delivering a least-cost, reliable, net-zero energy market.

Currently, the ISP incorporates federal, state, and territory policies without critically analysing their suitability to the NEM. The government should ask the Australian Energy Market Operator (AEMO) to advise on a single optimal development path to guide investments in generation, storage, and the network to transition to net zero by 2050.

Monitoring progress against an optimal pathway allows for early warning when things are going off-track. Scenarios can be used to stress-test the pathway and identify and manage risks to success. Businesses would also have more certainty and could make investment decisions aligned with the preferred pathway.

The optimal pathway should be the reference point for preferred investment in the transmission system, and drive the regulatory assessment for specific projects. The time that elapses between planning and project approval must be tightened.

The federal government should hold state governments accountable for improving the planning and permitting processes for transmission and generation projects. While the federal government does not have responsibility for planning and permitting, it does hold the purse strings. Further CIS tenders in each state should be conditional on material improvement to speed up planning and approval processes.

4.2.2 Make the governance fit for a net-zero economy

The federal government has commissioned a review of the National Electricity Market,179DCCEEW (2024c). to report by the end of 2025. The terms of reference are to develop market settings to promote investment in firmed, renewable generation and storage capacity in the NEM following the conclusion of CIS tenders in 2027.

This is a critical issue for the future of the NEM, and will include dealing with the emissions and reliability characteristics of the future technology mix. The review should coordinate with work of AEMO and the Australian Energy Market Commission (AEMC) looking at the back-up role of gas or other technologies to complement a high level of intermittent renewables.

Other fundamental issues also need attention.

Firstly, energy ministers need to update the respective roles of market bodies, consumers, and governments in the future market; and decide what rights and responsibilities each of these groups should have. Without this, it’s difficult to go beyond making small tweaks to existing frameworks, limiting the scope of reform.

Once ministers have defined the roles and responsibilities of each party, the technical detail of designing rules and operating procedures that reflect these can then be passed to the market bodies to develop.

The three laws governing energy markets180The National Electricity Law, the National Gas Law, and the National Energy Retail Law. should be merged into one, to best serve the interests of consumers. And governments must give better policy direction so that market bodies can make better, faster decisions.

Ministers, regulatory bodies, and the market operator need to work with industry stakeholders and experts to develop the case for, and design of, a market structure that will help ensure adequate energy resources in a post-coal, high-renewables electricity system. This should include an enduring carbon price for the electricity sector, to guide investment decisions, including gas plant entries and exits. An exit strategy from Rewiring The Nation is also required. The federal government should rigorously prioritise the actions in the Consumer Energy Resources (CER) roadmap, to focus effort and resources on a small number of reforms that will have the greatest system-wide benefit.

4.2.3 What to do about nuclear power

Getting to 100 per cent renewable energy over the next two decades would be expensive unless there were major technological advances to back up renewable supply during rare, weather-related renewable energy droughts.181T. Wood and Ha (2021). That’s one reason it’s sensible for Australia to continue its current strategy of net zero emissions in the NEM by the 2040s.

Gas generation with negative-emissions offsets will be the lowest-cost ‘bridging’ technology back-up until a zero-emissions alternative, such as hydrogen generation, pumped hydro storage, or carbon capture and storage, becomes an economically competitive alternative.

It is theoretically possible that nuclear energy, in the form of small modular reactors, could play this role in the 2040s. But this technology is far from commercial reality, its promised benefits are unrealised, and its costs are unknown with any level of confidence.

Australia should position itself to be a fast adopter of small modular reactors if they look like becoming economical. Preparatory work on legislation and regulations could begin ahead of that time if justified by emerging circumstances. Those circumstances do not exist today.

4.3 Gas: where we are

Nearly one quarter of Australia’s emissions come from producing and using gas (Figure 4.2). Achieving net-zero emissions by 2050 means resetting the role of gas in the energy system. Gas will be a residual fuel, potentially used for back-up in the electricity system where other options are not economic,182In 2020, Grattan Institute concluded that gas would be the best back-up for a high-renewables electricity system (T. Wood and Ha (ibid)). The most recent ISP estimates less than 2 per cent of generation in 2040 would come from gas (Australian Energy Market Operator (2024a)). and for a few industrial uses where technology to replace gas is not commercially viable. LNG exports will shrink as destination markets also remove fossil fuels from their economies.183T. Wood et al (2021b).

Governments have been reluctant to articulate this reality and reach a national agreement on the role of gas, and thus are without a pathway to manage this reset smoothly.

Australia now faces a potential shortage of gas in southern states beyond 2028, while lagging in policy to reduce gas use. Despite years of warnings, neither governments nor industry have acted to avert this situation. The Energy and Climate Change Ministerial Council referred the task of addressing the gas supply issues to senior government officials and AEMO. This referral does not meet the urgency and seriousness of the problem.

Figure 4.2: Australia must get off gas to reach net zero

Emissions (MtCO2-e in 2023)

Chart showing Figure 4.2: Australia must get off gas to reach net zero
Notes: MtCO2-e = Millions of tonnes of carbon dioxide-equivalent. Totals are scope 1 (direct) emissions. Gas totals are for natural gas only.
Source: Grattan analysis of DISR (2024c) and DCCEEW (2022).

4.3.1 Upgrading to electricity is the best option for many gas users

For most gas users, upgrading to use electricity is likely to be the best way to reduce emissions. Most households would save money by doing so.184Grattan Institute estimates household savings over 10 years of $7,000 in Sydney, $14,000 in Melbourne, $8,000 in Perth, and $10,000 in Adelaide, for an all-electric home versus an all-gas one (in 2022 dollars): T. Wood et al (2023a, p. 15). Substitutes such as hydrogen and biomethane are likely to remain expensive, meaning their use should be targeted at industrial users where electrification is not currently an option.185T. Wood et al (2023b).

The electricity sector is projected to use less gas in 2040 than it does now, even though the number of gas power stations will grow.186Australian Energy Market Operator (2024b). Gas will increasingly be used for short bursts at peak times, and as back-up during ‘renewable droughts’, when wind and solar resources are not adequate.187‘Renewable drought’ refers to cloudy, cold, still weather in winter (dunkelflaute); and cloudy, humid, still weather in the tropical wet season (cyclonic depression periods). Both lead to a prolonged coincidence of high demand for electricity (for heating/cooling) and low renewable resource availability.

4.3.2 Shrinking demand will challenge markets

Meeting a changed demand profile makes investment in gas power generators more challenging. It also demands a different market structure, particularly if most of the rest of the economy has moved away from using gas.

The most challenging part of resetting the role of gas is managing the assets involved. The gas distribution networks, which service mostly households, have a book value of $11.2 billion in the southern states alone.188Total economic value of network assets used to provide regulated network services for NSW, Victoria, South Australia, and the ACT: Australian Energy Regulator (2024). The economic regulation that has applied to these monopoly businesses was based on their recovering these costs from consumers over 80+ year lifetimes. Phasing out gas means these returns will not be realised unless they are brought forward and paid for much earlier. Doing so risks creating a death spiral: gas prices rise in order to recoup capital over a shorter period, price-sensitive users switch to electricity, prices must rise again to recoup capital from a diminished number of users, and so on.

It is likely to be the most disadvantaged users, who find it difficult to switch to electricity, who are left paying higher and higher bills.189These include renters (private, social, and public), residents of multi-storey buildings, and homeowners with low incomes: T. Wood et al (2023a).

4.3.3 Links to international markets are poorly managed

The final piece of the wicked policy problem is gas exports. East coast gas exports link domestic gas and electricity prices with international prices. In 2021, the war in Ukraine triggered high global energy prices, and Australia was not immune. Domestic gas prices rose from about $10/GJ to $36/GJ, causing the federal government to intervene with a fixed price cap. Prices have since fallen and may fall further this decade, although that is by no means certain.190Grattan analysis of ACCC (2024b).

The impact of international prices on the Australian economy is being managed through ad-hoc and poorly coordinated interventions, via the Australian Domestic Gas Security Mechanism (ADGSM) and the Gas Market Code of Conduct.

Meanwhile, despite the extraordinary profitability of fossil fuel extractors,191D. Wood et al (2023). the poor design of the Petroleum Resource Rent Tax (PRRT) means that insufficient benefit has flowed to government revenues.192Treasury (2023c). Time is running out to benefit from exports of our gas.

4.4 Gas: What we should do

The federal government must take four immediate actions: fix the looming shortfall, redesign the Future Gas Strategy, update market controls, and make the most of the Petroleum Resource Rent Tax.

4.4.1 Fix the looming shortfall

There is no cost-free, easy solution to the gas shortfall. The best solution should be able to be implemented in time to avert a material gap and deliver sufficient volumes when demand is highly variable and shortfalls can emerge with little notice. It should also minimise pressure on gas and electricity prices for consumers; and avoid locking in gas use for longer than currently forecast, to be consistent with climate targets.

The best solution during the next 5-to-10 years is a combination of LNG regasification terminals to allow gas to be brought to the southern states from other parts of Australia; and active demand response (where big users agree to reduce their demand at peak times if requested and paid to do so).

Terminals are the most urgent and complex part of the solution. The Port Kembla regasification facility is effectively complete, and there are possible terminals in Victoria. The former has to date failed to secure commercial agreements from shippers and/or consumers, and the latter have struggled with regulatory approvals and the same financial hurdles.

The federal government should convene a working group with the task of making LNG regasification terminals work for the southern states. The working group should include existing gas producers, regional gas traders, major customers, terminal proponents, relevant state governments, and the ACCC. The objective should be to agree on the fundamental structure as quickly as possible, such that southern states can begin receiving cargoes by mid-2026.

The federal government should also initiate a rule change to create a demand response mechanism in the National Gas Market, akin to the Reliability and Emergency Reserve Trader mechanism in the NEM. This would give AEMO the capacity to manage small unexpected shortfalls in a more structured way.

4.4.2 Redesign the Future Gas Strategy

The Future Gas Strategy should be reworked to provide clarity on the future role of gas in the transition to net zero, including coordinating degasification plans with the states and territories.

Gas users and producers need more predictability about where gas might be used, by whom, for what, and for how long. Without this, consumers will continue to be worse off, and producers will run the risk of being left with stranded assets, and their associated costs.

The sector plans for net zero, currently under development by federal government departments, should set out which parts of the economy will be using gas, and for how long. The Future Gas Strategy should then be revised to guide the winding down of gas infrastructure in the financial interests of consumers. Many of these decisions will need to be made by state governments.

The federal government has committed significant financial resources to assist industry and households to upgrade from gas to electricity.193For example, through the industrial transformation stream of the Powering the Regions fund, funding to electrify social housing, and the Household Energy Upgrades fund. It should strike a bargain with the states to make access to this finance contingent on states setting end dates for gas use, and grappling with an equitable way to write down gas networks that appropriately shares financial losses and protects vulnerable users. Otherwise, federal money will be wasted if gas networks continue to expand and users continue to install new gas appliances.

As part of broader energy market reform (see section 4.2.2), the federal government should work with the states to ensure that the right market structures are in place to support the limited, but essential, role that gas will play in a net-zero energy system. This should build on the work underway in the AEMC,194Australian Energy Market Commission (2024). but needs to include how to optimise the infrastructure and market regulation to deliver gas to residual gas users in the electricity and industrial sectors, when the rest of the economy has moved on.

4.4.3 Update market controls

The east coast gas market is now operating under two controls: one on volume (the Australian Domestic Gas Security Mechanism, or ADGSM) and one on price (the Gas Market Code of Conduct). Both will need to be revised to allow for interstate transfers of LNG.

The ADGSM does not imagine that gas would be made available to the domestic market in the form of LNG, or that suppliers to the domestic market may need to use LNG facilities in order to do so. This should be amended.

The Code of Conduct currently excludes all LNG from the domestic price cap. If this isn’t changed, then LNG transfers between states could result in very expensive gas for domestic users. However, if LNG is subject to the price cap, government may find itself having to subsidise interstate LNG transfers in order to make regasification terminals viable.

The review of the gas code of conduct, which must be initiated no later than 1 July 2025, is the best forum to unpick both these problems. The long-term export contracts for Queensland LNG producers are due to expire from the mid-2030s.195ACCC (2024b). The next federal government should use the opportunity created by this window for broader and longer-term policy considerations than were possible in recent years.

4.4.4 Make the most of the Petroleum Resource Rent Tax

The Petroleum Resource Rent Tax (PRRT) has been regularly criticised for failing to deliver the benefits to Australians that should accrue from our petroleum and gas resources.196Freebairn (2016).

There have been several reviews that have led to changes,197Treasury (2017). yet these changes have been accompanied by major resistance from the industry that resulted in incremental changes rather than fundamental redesign.

Most recently, the Treasurer responded to a Treasury review to bring forward significant PRRT amounts by reducing the deductibility of costs.198Treasury (2023c).

It is unclear whether more fundamental options identified by Treasury should have been adopted. Treasury’s analysis suggested its selected arrangement could deliver higher PRRT receipts to 2033-34 than more fundamental changes to the transfer pricing arrangements preferred by some independent economists.199Kraal (2022). This conclusion relies on future oil price assumptions. With current and projected oil prices at around US$70 per barrel, revisiting arrangements could be justified.

The outlook for LNG exports over the next 25 years depends on geopolitical outcomes, most specifically the Ukraine conflict, and the pace at which the world meets the objectives of the Paris Agreement. The federal government should closely monitor these developments and consider further reform of the PRRT.

Bibliography

IN THIS CHAPTER

5 Housing

5.1 Where we are

Australia’s housing problem has been building for decades. But housing has become even more expensive since the pandemic. House prices have grown much faster than incomes in most cities and most regional areas. Rental vacancy rates are at record lows and rents have risen sharply. Low-income renters are suffering the most, finding it harder to make ends meet.

In the early 1990s it would take the average Australian about seven years to save a 20 per cent deposit for a typical dwelling. Now it takes 12 years. And first home buyers are now having to spend a larger share of their income to pay the mortgage than at any time in the past decade. Unsurprisingly, home ownership is falling fast among younger Australians, and poorer Australians of all ages.

Housing has also become more expensive to build in recent years, and the pace of new housing construction has slowed sharply. The rising cost of building materials, the cost and availability of labour, and the recent spike in mortgage interest rates are constraining new housing supply. And states’ land-use planning regimes continue to constrain new housing supply where people most want to live.

5.1.1 Australians are spending more of their incomes on housing

Median house prices have increased from about four times median incomes in the early 2000s to more than eight times today, and about 10 times in Sydney (Figure 5.1).

Figure 5.1: House prices have risen much faster than incomes since the early 2000s

Ratio of median house price to median household income

Chart showing Figure 5.1: House prices have risen much faster than incomes since the early 2000s
Note: Based on modelled median household income from the ANU Centre for Social Policy Research.
Source: CoreLogic (2024).

House prices have increased even further since the pandemic. For instance, house prices in Brisbane, Perth, and Adelaide have risen by more than 80 per cent since 2020, and the prices of units have risen by more than 50 per cent. While house prices have grown more slowly in Sydney and Melbourne since the pandemic, prices are still up 49 per cent in Sydney and 19 per cent in Melbourne since 2020.200PropTrack (2024).

Of course, not all Australians own their own homes – nearly one in three households rent privately.201The proportion of households renting has steadily increased from about 28 per cent in 1996 to 31 per cent in 2021, excluding dwellings with tenure type not stated: ABS (2021a). Rental vacancy rates are at record lows, and asking rents have risen fast (Figure 5.2).

Figure 5.2: Rents have risen sharply since the pandemic

Asking rents and CPI rents, January 2020 = 100

Chart showing Figure 5.2: Rents have risen sharply since the pandemic
Notes: Asking rents are those reported on new advertised rentals on realestate.com.au. CPI rents are the ABS measure of movements in the rent paid across the whole rental stock.
Source: Grattan analysis of ABS (2024c) and PropTrack (2024).

The pandemic and the ensuing work-from-home revolution spurred a ‘race for space’, with some people moving out of the family home or share house, or using an extra bedroom as a home office.202The Reserve Bank of Australia estimates that the number of people living in each home in Australia fell from an average of 2.55 people in late-2020 to 2.48 people by mid-2022, a change which has created demand for an extra 275,000 homes. See Agarwal et al (2023); Coates (2023a). And net overseas migration has spiked as migrants return to Australia in record numbers after the reopening of the borders, while fewer residents than usual are leaving.203McDonald (2023).

5.1.2 Home ownership is falling, especially for younger, poorer Australians

Home ownership rates are falling fast among low-income earners of all ages. Between 1981 and 2021, home ownership rates among the poorest 40 per cent of 45-54 year-olds fell from 68 per cent to 54 per cent, and among the poorest 40 per cent of 25-34 year-olds it fell from 52 per cent to 31 per cent. The overall home ownership rate among 2534 year-olds fell from more than 62 per cent to 44 per cent (Figure 5.3).

Figure 5.3: Home ownership is falling particularly fast for younger, poorer Australians

Home ownership rates by age and income, 1981 and 2021

Notes: Private dwellings only. Excludes tenure or income not stated. ‘Other’ tenure is counted as a non-owner. Household incomes are reported in ranges, so sorting into quintiles is an approximate exercise. This means small changes in ownership rates may not be significant. Income not equivalised due to data limitations.
Source: Grattan analysis of ABS (1983) and ABS (2023).

It is harder to save a deposit for a home

Home ownership is falling because it takes much longer to save for a deposit. In the early 1990s it took about seven years to save a 20 per cent deposit for a typical dwelling for an average household. It now takes more than 12 years.204Based on households saving 15 per cent of their gross annual income: Coates (2022). In addition, many young households are finding it harder to save for a deposit because they face larger higher education debts and are required to save more of their income into superannuation than their parents did 25 years ago.

The mortgage burden has increased as interest rates have jumped

The mortgage burden on a first home, assuming a person borrows 80 per cent of its value, had been historically low in the decade leading up to the pandemic. But that burden has jumped sharply as interest rates have risen.205The official cash rate rose from 0.1 per cent to 4.35 per cent between March 2022 and December 2023. Today, a first home buyer needs to spend a larger share of their income to pay the mortgage on a median-priced home than at any time in the past decade.206Coates et al (2025a).

5.1.3 Homelessness is rising

Rising housing costs have contributed to increased homelessness.207Johnson et al (2018), Glynn et al (2021), and Kushel and Moore (2023). In 2021, there were 48 homeless people for every 10,000 Australians, up from 45 in 2006. More than 122,000 people were homeless in Australia on Census night in 2021 – up from 116,000 in the 2016 Census and 102,000 in the 2011 Census. Over the same period, the number of people sleeping rough – on the streets, or in improvised dwellings or tents – grew by about 820 people, to 7,600.208ABS (2021b).

Data from specialist homelessness services suggest that homelessness rates – particularly rates of rough sleeping – have risen further since the pandemic.209Pawson et al (2024).

5.1.4 New housing starts have fallen to near decade-lows and housing is more expensive to build

New housing construction has failed to keep pace with rising demand in recent decades. Prescriptive state land-use planning regimes have made it too hard to build more homes in the established suburbs of our major cities.

Since the pandemic, housing construction has slowed even further. New building approvals for housing have fallen to near decade-lows of just 171,000 in the year to December 2024. Building approvals for apartments have fallen particularly sharply.210ABS (2024d).

There are currently three constraints on the pace of new housing construction:

  • The cost of construction materials has jumped sharply since the start of the COVID pandemic.211The cost of timber and cement products used in construction has risen by about 40 per cent, and concrete and steel products by about 30 per cent, since December 2019. Grattan analysis of ABS (2024e).
  • The cost of labour has jumped, with low unemployment (Chapter 2) and the infrastructure construction boom.
  • Sharply higher interest rates have slowed housing approvals, especially for higher-density developments.212Each 100-basis-point cut in real mortgage rates boosts dwelling approvals by nearly 7 per cent within 12-to-24 months. See Tulip and Saunders (2019, Figure 4).

The cost of constructing new housing has risen by 34 per cent since March 2020, outpacing rents, which have risen by 17 per cent over the same period.213Grattan analysis of ABS (2024e) and ABS (2024f). And productivity in the housing construction sector has fallen by 12 per cent since 1994, whereas productivity across the economy as a whole has increased by 49 per cent.214Productivity Commission (2025b).

5.2 What we should do

5.2.1 Reform tax and pension rules to reduce demand for housing

Demand for housing would be reduced a little if the federal government reduced the capital gains tax discount and curbed negative gearing – and there would be substantial economic and budgetary benefits (Chapter 2).215Daley et al (2016).

Property prices would probably fall by about 1 per cent, and would-be homeowners would win at the expense of investors.216Updated from Daley et al (2018a, pp. 97–98) for growth in total value of housing stock to $11.5 trillion, and tax concessions on residential property of $7 billion a year. House prices at the bottom of the market would probably fall by more, since these tax breaks have channelled investors into low-value homes that are lightly taxed under states’ progressive land taxes.

The dominant rationale for these reforms is their economic and budgetary benefits. The current tax arrangements distort investment decisions and make housing markets more volatile. Our proposed reforms – halving the capital gains tax discount and curbing negative gearing so that rental losses could no longer be offset against wage and salary income – would boost the budget bottom line by about $11 billion a year.217Figure is for the 2025-26 budget year. We estimate that halving the capital gains tax discount would raise around $6.5 billion, and curbing negative gearing would raise $4.5 billion. Estimates account for a 20 per cent reduction in net
capital gains from sale of investment properties due to carry-forward of rental losses. Estimates are higher than those in D. Wood et al (2023), reflecting recent increases to interest rates and improvements to forecast net capital gains. Grattan analysis of Treasury (2024d, pp. 18, 38), ATO (2024, Individuals Table 26 and CGT Table 1), ABS (2024f), and PBO (2024).
Contrary to urban myth, rents wouldn’t change much, nor would housing markets collapse.218Analysis of CoreLogic price data after the 2019 federal election showed that, rather than the election result, it was APRA’s post-election loosening of lending restrictions that spurred a recovery in house prices: Coates and Cowgill (2019).

We estimate that if implemented in full, our proposals could decrease the number of new homes being built by about 16,500 over the five years to 2030. That would result in a tiny – around $1 per week – increase in median rents across Australian capital cities.219Assumes a 1 per cent decline in house prices results in a 0.07 per cent (from Tulip and Saunders (2019)) decline in the housing stock over a five-year period. This impact on housing supply, and rents, could be offset if even a small portion of the proceeds from the reforms was used to fund a further boost to Australia’s social housing stock (Section 5.2.4). Including more of the value of the family home in the pension assets test would also marginally reduce housing demand. Under current rules, only the first $252,000 of home equity is counted in the pension assets test; the remainder is ignored.220Services Australia (2024b). The maximum assets to qualify for a full Age Pension for single homeowners is $314,000 (excluding the value of their own home), compared to $566,000 for single non-homeowners. A homeowning couple can have $470,000 in assets (excluding the home), compared to $722,000 for couples that do not own their own home.

Almost 40 per cent of the government’s spending on the Age Pension goes to people with more than $750,000 in assets.221D. Wood et al (2023, p. 27). The exclusion of most home equity from the assets test means well-off households – provided their wealth is largely in the family home – can continue to qualify for the pension. As a result, taxpayers end up underwriting future inheritances.

Changing the pension assets test so that all the home equity above $750,000 is counted would be fairer and would contribute about $4 billion a year to the budget, growing over time (Chapter 9).222D. Wood et al (ibid, p. 28). This reform would also encourage a few more senior Australians to downsize to more appropriate housing, although the effect would be limited given that research shows downsizing is primarily motivated by lifestyle preferences and relationship changes.223Daley et al (2018b, p. 38), Productivity Commission (2015), and Valenzuela (2017).

The exemption of owner-occupied housing from capital gains tax, and the (non) taxation of imputed rent, remain the largest distortions in the tax system favouring investment in housing. But, although the policy merits of taxing owner-occupied housing are sound, the politics are likely to be intractable.224Investment would be less biased towards housing, where any capital gains and imputed rents – the value of owning the home that you live in – are untaxed, compared to investing in other more productive assets. But it would be difficult to resist calls to allow deduction of interest payments and the cost of any capital improvements made to the home such as renovations, which could wipe out much of the benefit to the budget: Daley et al (2018a, pp. 101–102).

5.2.2 Sharpen states’ incentives to boost housing supply

Australia has a shortage of housing, especially close to the centres of our capital cities

Housing in Australia has become increasingly expensive for many reasons. Incomes rose, while tax and welfare settings and migration fed price growth. But housing costs – especially rents – would have risen much less if there had been more housing. Australia has among the least housing per person of any OECD country, and is one of only four OECD countries where the amount of housing per person went backwards over the past two decades (Figure 5.4).

Figure 5.4: Australia’s growth in housing stock in the past two decades has been among the lowest for developed countries

Dwellings per 1,000 people, 2000 and 2021 or latest

Notes: Figures are for total occupied and unoccupied dwellings. Data for 2020 series refer to: 2021 for Australia; 2020 for Austria, Denmark, Estonia, Finland, France, Ireland, Lithuania, Luxembourg, Netherlands, Norway, Poland, Portugal, Romania, Sweden, UK, and US; and 2018 for all others. Data for 2000 series refer to: 1998 for Italy; 2001 for Australia, Austria, Bulgaria, Canada, Croatia, Czech Republic, Hungary, Luxembourg, New Zealand, Norway, Portugal, and Spain; 2002 for Chile and Latvia; and 2005 for Malta.
Source: Grattan analysis of OECD (2024g) and ABS (2022c).

The historical shortage of housing in Australia is largely a failure of housing policy. Australia’s land-use planning rules are highly prescriptive and complex. Current rules and community opposition make it very difficult to create extra residences in the inner and middle-ring suburbs of our capital cities.225See Daley et al (2018a, pp. 56–58) on how regulations affect housing supply.

Experience abroad shows that relaxing planning constraints leads to materially more housing being built. In 2016, Auckland – a city of 1.5 million people – rezoned about three quarters of its suburban area to promote denser housing. Researchers later found that the rezoning had boosted the housing stock by up to 4 per cent.226See Greenaway-McGrevy (2024).

Planning rules that constrain development in Australian cities have especially led to a shortage of medium- and high-density housing compared to what Australians actually want. Many people would prefer a townhouse, semi-detached dwelling, or apartment in an inner or middle suburb, rather than a house on the city fringe.

Semi-detached dwellings, townhouses, and apartments made up 44 per cent of Sydney’s and 32 per cent of Melbourne’s dwelling stock in 2021, up from about 39 per cent and 27 per cent respectively in 2011.227ABS (2022c). This is still well short of the 59 per cent and 52 per cent respectively that residents say they want.228Daley et al (2018a, Table 3.2). These preferences were also reflected in work by Infrastructure Victoria which found that 20 per cent of Melburnians would trade house and land size to live in an established suburb in a medium-density home, if it was available at a more comparable price.229Infrastructure Victoria (2023).

This is primarily a problem for state governments: they set the overall framework for land and housing supply and they govern the local councils that assess most development applications. And state governments, especially in Victoria and NSW, have made some progress in reforming land-use planning rules to allow more homes to be built around activity centres and existing transport links.230See Coates (2024) and Coates and Bowes (2024).

Federal incentives to encourage states to get more housing built need reform

The federal government has committed to building 1.2 million homes over the next five years, with this target being backed by $3.5 billion in incentives for states and territories to actually deliver the extra homes.231Albanese (2023).

The plan, if fully achieved over five years, could reduce rents from what otherwise would have been by 4 per cent, saving renters $8 billion. If those higher rates of construction are sustained for a full decade, rents could fall by 8 per cent, saving renters $32 billion over those 10 years.232Coates and Moloney (2023a, p. 15).

But these incentives need to be re-worked. The National Housing Supply and Affordability Council expects net new housing supply to total 903,000 homes over the five years to 2028-29, below the 1 million home baseline over five years at which most states can expect to be paid the New Homes Bonus.233National Housing Supply and Affordability Council (2024, Table 4.1).

Most states are likely to substantially undershoot their per-capita share of the national baseline. The federal government should therefore:

  • Adjust the baseline housing targets for states at which the New Homes Bonus becomes payable to better align them with cyclical housing conditions. For example, the targets could be adjusted each year in line with factors known to affect housing starts, such as changes in interest rates and house prices.234The Reserve Bank of Australia’s model of the Australan housing market provides a guide for how targets should be adjusted for changes to market circumstances. See Tulip and Saunders (2019).
  • Bring forward the New Homes Bonus to be paid in instalments, subject to progress towards meeting the recalibrated baseline rather than at the end of the five-year period.235Any discrepancies between annual pre-payments made to states and states’ final performance over the five-year period could be reconciled via the annual GST distribution from the federal government to the states.

The federal government should also extend its new National Competition Policy to cover reforms to residential land-use planning rules, such as setting minimum national standards for residential zones to allow more townhouse and duplex developments, reforming the process for new heritage listings and overlays, and limiting third-party appeal rights to block residential construction.236The policy is backed by a $900 million National Productivity Fund, that will pay states for reforms that boost competition and productivity. See Chalmers (2024).

And the federal government should reform permanent and temporary employer-sponsored visas to ensure Australia can find the skilled workers needed to build these extra houses, including by streamlining pathways to skilled migration for scarce skilled trades workers.237For example, opening up temporary employer sponsorship to workers in any occupation earning more than $70,000 a year, and abolishing labour market
testing, would simplify and speed up the sponsorship process for skilled trades workers. As would streamlining skills assessments. Coates et al (2022b).

5.2.3 Boost Commonwealth Rent Assistance

Commonwealth Rent Assistance is the most effective way to help lowincome renters with their housing costs. As a demand-driven housing payment, Rent Assistance has expanded to meet the growing need for income support as home ownership has fallen among lower-income Australians.238The proportion of income-support recipients who receive Rent Assistance has increased from 12 per cent in 2008 to 21 per cent in 2020. Grattan analysis of ABS (2010) and ABS (2022d).

The federal government has raised the maximum rate of Rent Assistance by 27 per cent in real terms over the past two budgets.239The maximum rate was increased by 15 per cent in September 2023, and by a further 10 per cent in September 2024.

Yet Rent Assistance remains inadequate. After covering basic living expenses, a single pensioner who relies solely on income support has just $300 per week left for rent, enough to afford just 11 per cent of one-bedroom homes across all capital cities.240Grattan analysis of ABS (2021a) and ABS (2024c). Assumes a minimum non-housing budget of $379 per week: see Coates et al (2025a, Figure 1.7).

The federal government should increase the maximum rate of Rent Assistance by a further 50 per cent for singles and sharers, and 40 per cent for couples. And Rent Assistance should be indexed to changes in rents for the cheapest 25 per cent of homes in capital cities.

Boosting Rent Assistance as we recommend would cost about $2 billion a year.241Coates et al (ibid, p. 36). These increases would boost the incomes of single renters by up to $53 a week ($2,750 a year), and couples by up to $40 a week ($2,080 a year).242Figures are for households without children.

International evidence, and Australian experience, suggests that more than five in six dollars of any extra Rent Assistance paid would benefit renters, rather than landlords.243Coates et al (2025a, p. 26).

5.2.4 Boost the supply of social housing to reduce homelessness

The federal government should increase funding through the National Affordable Housing Agreement244Treasury (2018). for social housing, provided that the money is tightly targeted to help people at serious risk of homelessness.

The best Australian evidence shows that social housing substantially reduces tenants’ risk of homelessness.245Prentice and Scutella (2018) studied the benefits of social housing, comparing people who entered social housing to similar individuals in the private rental market. They found that 7 per cent of residents placed in social housing subsequently become homeless, compared to 20 per cent of similar renters in the private market.

Yet Australia’s stock of social housing – currently about 446,000 dwellings – has barely grown in 20 years, while the population has increased by 33 per cent.246Coates and Moloney (2023a, p. 12). About 6 per cent of housing in Australia was social in 1991. It’s now just 4 per cent.247Grattan analysis of AIHW (2024a) and ABS (2024g).

But boosting social housing is expensive. Social housing provides a big rental discount, or subsidy, to vulnerable tenants. If governments and community housing providers were going to try to recoup these costs over time, as private landlords do, the rents would be higher than vulnerable residents can afford to pay. This ‘subsidy gap’ is now estimated to be about $24,000 a year.248Troy and Nouwelant (2023, p. 15). Assumes availability payments are made over 25 years. Once this subsidy gap is filled, developers of social housing – either community housing providers or state governments – will be able to finance the upfront construction of social housing dwellings.

Boosting Australia’s stock of social housing by 200,000 dwellings – almost sufficient to return social housing to its historical share of the total housing stock – would require an ongoing government subsidy of $4.8 billion a year.249Alternatively, 200,000 social dwellings would require an up-front capital contribution of about $80 billion, assuming an up-front capital contribution of $400,000 per home: Troy and Nouwelant (ibid, p. 14).

Given its costs, social housing should be reserved for those most in need, and at significant risk of becoming homeless for the long term.

Additional federal government subsidies should prioritise boosting social housing and raising Rent Assistance over the provision of ‘affordable housing’ – where rents are set at a discount to the market rate. Affordable housing is typically not targeted at people most in need, with eligibility typically extended to people on above-median incomes.250Many low-income households are also ineligible to rent affordable housing dwellings if doing so would require them to spend more than 30 per cent of their income on rent. See DSS (2018), ACT Suburban Land Agency (2024), and NSW Government (2024).

Triple the Housing Australia Future Fund to $30 billion

The federal government should triple the Housing Australia Future Fund (the HAFF), from $10 billion to $30 billion, which could help build up to a further 37,500 social housing units in the next five years, at a cost of $850 million.251The HAFF makes use of the equity risk premium to generate a higher return to meet federal government obligations or commitments than if the capital of those funds was otherwise used to retire debt. See Coates (2023b). Alternatively, an expanded HAFF could deliver an extra 2,250 social housing units each year in perpetuity via the provision of capital grants.252Assuming a capital grant per dwelling of $400,000.

Tripling the HAFF would also help boost housing supply. Given financing frictions are a key cause of the slowdown in the construction sector, much of the increase to social housing investment in the current economic climate is likely to be ‘additional’, rather than coming at the expense of private sector construction.253National Housing Supply and Affordability Council (2024, p. 6).

5.2.5 Support the states to abolish stamp duty

More state and territory governments should abolish stamp duty and replace it with a broad-based land tax.

Stamp duties are among the most inefficient taxes available to the states and territories. They discourage people from moving to housing that better suits their needs, and sometimes they discourage people from moving to better jobs.254Coates and Moloney (2023b). Grattan Institute has previously estimated that shifting from stamp duties to a broad-based property tax would improve housing affordability and raise rates of home ownership, while making Australians up to $20 billion a year better off.255Daley and Coates (2015).

Stamp duties are also unfair. They especially penalise young people, who tend to be more mobile.

Stamp duties also act as a de facto tax on divorce. When the family home is sold to allow assets to be split, the separating couple each need to pay stamp duty if they purchase again. It’s a big reason why more than half of divorced women who lose their home don’t buy again.256Coates and Moloney (2023b).

One recent study found that replacing stamp duty with a property tax could boost the share of Australians owning their own home by 3 percentage points, from 67 per cent to 70 per cent, in the long term.257Warlters (2023).

Removing stamp duty could also accelerate housing construction, helping meet the federal government’s target of 1.2 million homes over the next five years, and put downward pressure on rents.

In contrast to stamp duties, property taxes – which are levied on the value of property holdings – are the most efficient taxes available to states and territories. If they are designed well and applied broadly, they do little to change people’s incentives to work, save, and invest. Property taxes are also a more sustainable revenue source than stamp duties.258Coates and Moloney (2023b).

However, the politics of this transition are fraught. Property taxes are often unpopular precisely because they are highly visible and difficult to avoid.

Ultimately, it is hard for the states and territories to make the transition without significant revenue impacts.259Coates and Moloney (2023c). The federal government should ease the transition by giving temporary revenue guarantees to any state making the switch. For example, it could commit to covering one third of the states’ revenue from stamp duty (i.e. up to $13 billion a year across all states) for a period of up to five years. These payments would be offset by the extra tax revenue the federal government would collect on the larger economy that would result from replacing stamp duty.

5.2.6 Continue to work with states to improve rental tenure security

The typical renter in Australia is changing. More people are renting for longer, more people are raising families in rentals, and more people are retiring as renters. This puts a premium on rental tenure security and quality.

Grattan Institute has previously recommended that tenancy laws be reformed to make renting more secure, such as by abolishing ‘no-grounds’ evictions, and extending the minimum notice periods that apply when landlords terminate a lease.260Daley et al (2018c, Chapter 5).

Rental tenancy regulation sits with the states, but the federal government can, and has, played a role in encouraging reform. Notably, in 2023 at National Cabinet, all states and territories committed to ending ‘no-grounds’ evictions and implementing a national standard of no more than one rent increase per year.261Albanese (2023). Western Australia and the Northern Territory are yet to fully implement these reforms. See Shelter (2024).

This is a promising step. But more will be needed to provide renters with the tenure security they deserve. National Cabinet should next focus on narrowing the grounds on which a landlord can end a tenancy, and ensuring states better enforce existing tenancy laws.262Coates et al (2025a, p. 41).

Policies to improve supply (Section 5.2.2) would also improve tenants’ security. The more homes there are relative to renters, the less inclined a landlord will be to move a tenant on.

Bibliography

IN THIS CHAPTER

6 Health

6.1 Where we are

Australians live longer than people in almost any other country.263Dattani et al (2024). Our healthcare spending is slightly above the average for rich countries.264As a share of GDP: OECD (2023b). Overall, our health system performs well compared to other countries.265According to one analysis, we rank the highest among 10 countries assessed, but come second last for access to care, an issue discussed in this chapter of the
Orange Book: Commonwealth Fund (2024).

But we are getting older and sicker. Longer lives, an ageing population, and higher rates of chronic disease add up to rapidly growing illness, healthcare demand, and healthcare spending.

Six in every 10 Australians now have a chronic disease, such as cardiovascular disease, diabetes, or dementia.266AIHW (2024b). Each year, we lose an estimated 4.4 million years of healthy life to chronic conditions. This accounts for 85 per cent of Australia’s total disease burden.267Ibid.

The burden is much heavier for some groups, including Indigenous Australians, poorer people, and rural communities. People from these groups are more likely to have chronic diseases, die younger, and spend more years living with ill health.268AIHW (2016), and AIHW (2024c).

The health system is under strain after decades without structural reform to respond to chronic disease, compounded by the pressures of the COVID pandemic. Many people are struggling to get timely, coordinated care, and patient and government spending continues to rise. Spending on the top three chronic conditions alone is more than $50 billion a year.269In 2022-23, we spent $51 billion on musculoskeletal conditions, cancer and other neoplasms, and cardiovascular disease. This amounted to 30 per cent of total health spending: AIHW (2024d).

The health and financial impact of chronic disease is only expected to rise (Figure 6.1). In the upcoming term of government, there must be rapid progress on systemic reforms to respond to these growing pressures.

Figure 6.1: Government spending on health is projected to increase

Federal government spending on health as a proportion of GDP

Chart of Figure 6.1: Government spending on health is projected to increase
Source: Treasury (2023a). Note: Dashed line indicates projection

Important foundations have already been laid. Money has been set aside for an Australian Centre for Disease Control (ACDC), which can help prevent chronic disease. Early steps have been made to reform general practice funding and workforce models, to support the sector and make chronic disease management easier. And experiments have shown how gaps in rural access to primary care can be overcome.

In this coming term, the government must build on this foundation, moving from commitments, planning, and experimentation to systemic reform.

6.2 What we should do

The federal government should pursue a four-pronged strategy to address the causes and consequences of chronic disease. It should build a system to prevent chronic disease, improve chronic disease management in general practice, make sure everyone can afford and get the care they need, and make healthcare more productive to reduce growth in costs for governments and consumers.

6.2.1 Stop chronic disease before it starts

Many chronic diseases can be prevented through better diets, more physical activity, fewer drugs, less alcohol, and more social connection.270Breadon et al (2023). But, with a few exceptions (such as tobacco), Australia’s prevention efforts are piddling. We’re leaving big potential health gains on the table.

Few countries in the OECD spend less on prevention, as a share of overall health spending, than Australia (Figure 6.2). The OECD average share is about a third higher than Australia’s. Four peer countries – Canada, the UK, Italy, and Finland – spend at least double what Australia spends on prevention.271As a share of health spending: OECD (2023c).

Figure 6.2: Australia is near the bottom of the prevention pack

Prevention expenditure as a proportion of health expenditure, 2019

Chart showing Figure 6.2: Australia is near the bottom of the prevention pack
Notes: High-income OECD countries only. ‘OECD average’ is the average for the countries shown. The latest comparable data available is from 2021, but pandemic-related spending skewed the data for that year, so we used 2019 instead.
Source: OECD (2023c).

It’s not just Australia’s spending that lags far behind. Australia has not implemented many proven regulatory and tax measures that make it easier for people to stay healthy. These include a tax on sugary drinks272Breadon and Geraghty (2024). (a policy adopted in most countries around the world), mandatory salt limits for manufactured foods,273Breadon and Fox (2023). mandatory front-of-pack nutrition labels, and restrictions on junk food advertising.

Australia should introduce these policies as soon as possible (Section 6.3). But the government must also set up the architecture for better prevention policy in the future.

Prevention is politically hard. The impact of prevention policies takes time to appear. Many prevention policies require, or at least work best with, coordination between different levels of government. And powerful vested interests, such as the ultra-processed food industry, actively work to block reform.274Breadon et al (2023).

Strong institutional guardrails can help overcome these reform blockers. Providing those guardrails should be a central role for the ACDC. It should advise governments on which prevention reforms are the best value for money, including health impacts and savings across government portfolios.

The government should strike a national prevention funding deal with the states, increasing investment in prevention, but only for initiatives supported by strong evidence and that the ACDC endorses as good value. The role and independence of the ACDC should be legislated.275To read more on how the ACDC should be designed to tackle chronic disease, see Breadon et al (ibid).

6.2.2 Support general practice to manage chronic disease

Even with the best prevention policies, complex chronic disease is likely to increase.276Due to population ageing. Chronic disease rates rise sharply with age: AIHW (2024b).

General practice plays a unique and central role in diagnosing chronic conditions, and helping patients manage them. But there are worrying signs of problems in chronic disease management. Compared to other wealthy countries, patients in Australia are more likely to end up in hospital for conditions that are potentially avoidable through primary care (Figure 6.3).

Figure 6.3: Australia has more potentially avoidable hospitalisations than many other wealthy countries

Hospital admissions per 100,000 adults, 2019

Chart showing Figure 6.3: Australia has more potentially avoidable hospitalisations than many other wealthy countries
Source: OECD (2023c). Notes: Congestive heart failure, diabetes, and asthma and chronic obstructive pulmonary disease (COPD) hospital admissions are potentially avoidable through effective primary care: OECD (2023b). High-income OECD countries only. The latest comparable data available is from 2021, but the COVID pandemic affected hospitalisations for that year, so we used 2019 instead.

Broad, multidisciplinary primary care teams are the best way to help patients manage chronic disease.277Breadon and Romanes (2022), and Strengthening Medicare Taskforce (2022). But GPs in Australia are less likely to work in teams than their peers in many other countries.

The government should implement the recommendations of the 2024 review of workforce roles in primary care.278Cormack (2024). Primary Health Networks should be funded to expand multidisciplinary teams in under-served areas, and to help clinics successfully integrate new workforce groups.279This support could include advice on scope of practice, workflows, supervision arrangements, teamwork practices, and financial modelling for different team configurations.

Australia’s outdated way of funding GP clinics must change too. As well as blocking multidisciplinary care, it penalises clinics with poorer and sicker patients, making it hard for the GPs in those clinics to spend enough time with the patients who need care the most.

Three expert reviews have recommended a shift away from predominantly fee-for-service payments,280Strengthening Medicare Taskforce (2022), Review of General Practice Incentives Expert Advisory Panel (2024), and Cormack (2024). and the government has taken some initial steps. But a bigger change is needed.

The government should introduce a new, opt-in funding model that is fairer and more flexible.281To read more about GP funding reform, see Breadon and Romanes (2022). Most of the funding should be patient budgets that reflect each patient’s need. New practice payments to promote bulk billing282Minister for Health and Aged Care (2025). This policy has bipartisan support. could be expanded to achieve this, with clinics free to choose a larger practice payment, and shift away from fee-for-service funding.

GPs should also get more support from other specialists, helping them manage complex chronic disease with less need for costly and time consuming referrals. The government should fund a national secondary consultation scheme to enable GPs to easily and quickly get advice from non-GP specialists in public hospitals. Unlike now, doctors would not have to rely on their own personal networks to get advice, and there would be funding for both doctors’ time.283Drawing on best-practice systems in Australia and overseas, we recommend an electronic written system that provides advice within three business days, covering a comprehensive range of specialties: Breadon et al (2025).

6.2.3 Repair the holes in the safety net

Healthcare is essential to help prevent, diagnose, and manage chronic disease, but too many Australians routinely miss out on care.

Out-of-pocket costs in Australia are higher than in most wealthy countries (Figure 6.4), and they stop many people from getting care (Figure 6.5). According to one assessment of health systems in 10 wealthy nations, Australia has the best health system overall, but the second worst for access to care.284Commonwealth Fund (2024).

Without reform, people missing out on general practice, dental, and specialist medical care will only compound the challenges of chronic disease. It will mean growing health and budgetary costs from missed opportunities for prevention, early intervention, and effective chronic disease management. It will also keep hitting the most disadvantaged the hardest, making it much harder to close gaps in health and life expectancy between different groups in the community.

Figure 6.4: Australians pay for a larger share of health spending out of their own pockets than people in many similar countries

Out-of-pocket expenses as a percentage of health expenditure, 2023

Chart showing Figure 6.4: Australians pay for a larger share of health spending out of their own pockets than people in many similar countries
Notes: High-income OECD countries only. GDP is nominal GDP, current purchasing power parity.
Sources: OECD (2023c) and OECD (2023d).

Figure 6.5: Poorer Australians miss out on essential healthcare because of cost

Proportion of people who missed care because of cost, 2023-24

Chart showing Figure 6.5: Poorer Australians miss out on essential healthcare because of cost
Notes: People aged 15 or older. ‘Most disadvantaged’ is people living in the bottom fifth of areas for the Index of Relative Socio-economic Disadvantage. ‘Least disadvantaged’ is people living in the top fifth.
Source: ABS (2024h).

Fix GP deserts

Most Australians go to the GP each year, but a small number of areas have too little GP care to go around (Figure 6.6). These ‘GP deserts’ typically also have low bulk-billing rates, creating a double barrier to people seeking care: long wait times and high fees.285Gravelle et al (2016).

Areas that are GP deserts are more likely to be rural. They also tend to be sicker and poorer. People living in these areas are more likely to go to hospital for a condition that might have been avoided with good primary care.286Breadon and Hu (2025).

The problem has persisted for decades, with independent inquiries finding systemic failures in rural primary healthcare, which have flow-on effects for health, hospital demand, government budgets, and equity.287Parliament of NSW (2022), and Parliament of Tasmania (2022).

A new approach is needed. We know what works, thanks to years of experiments and trials, including local ‘single employer model’ initiatives in most states. Under this model, GPs are directly employed to train and work in both GP and hospital settings.288Australian College of Rural and Remote Medicine (2024). In rural Tasmania, local councils have subsidised clinics with a levy on ratepayers.289Cornes (2022).

These approaches acknowledge that in persistently under-served areas, top-up subsidies through Medicare simply won’t work. Instead, tailored local efforts are needed to employ clinicians, ideally with federal and state governments working together to make the best use of scarce funding, infrastructure, and workforce.

The federal government should set a minimum level of GP services per person.290Breadon and Romanes (2022). For regions that persistently fall below that level, funding should be available to fill the gap. It should be contingent on a contribution from the state government. The amount should be determined by the Independent Health and Aged Care Pricing Authority. Plans for spending it should be agreed to by the Primary Health Network and the state, drawing from a range of broad options agreed to by the nation’s health ministers.

Figure 6.6: Older people in remote areas are more likely to miss out on primary care

Proportion of residents older than 65 who did not see a GP at all during 2022-23, by small area (SA3)

Notes: Each point represents one small area (SA3). An SA3 is an area that typically covers a population of between 100,000 and 300,000 people. The bars represent the population-weighted average for each category of area.
Source: AIHW (2024e).

Fill a cavity in Medicare

Like general practice, dental care is primary care. Unlike general practice, it was left out of Medicare from the start. As a result, patients pay much more, and are far more likely to delay or skip dental care because of cost than any other major type of healthcare (Figure 6.5).

This has to change. Australia’s dental health is getting worse, with more decay, more cavities, and more than 80,000 potentially preventable hospital visits a year for dental health problems.291AIHW (2024f).

The government should introduce universal coverage for dental care. Because of the workforce required, and the cost, it should be phased in over 10 years, starting with people who are most disadvantaged.292See Duckett et al (2019) for our proposal on phasing in universal dental coverage.

Expanding universal healthcare coverage is also an opportunity to avoid repeating the mistakes of Medicare. Medicare’s design means there is too little care in some communities, the cost of care is growing fast, and it is not always clear that care is high value.

Public dental clinics should be established or expanded in under-served areas, based on the local gap between supply and demand for care. To avoid over-servicing and low-value care, funding should be restricted to high-value treatments, with a per-person funding cap.

To make sure people are getting the care they need, and that it’s working, clinics that get government funding should record their treatments, patient satisfaction ratings, and oral health outcomes.

Ensure everyone can get specialist treatment

Specialist healthcare is out of reach for too many Australians. Fees for private clinics can quickly become unaffordable, and public clinic wait times are often far longer than is clinically recommended.

The result is delayed or missed diagnoses and treatments, causing worse illness, more hospital admissions, and more government spending. The solution is a package of reforms to improve workforce supply, fill holes in the safety net, and crack down on excessive fees.293To read more about our recommendations to make sure all Australians can get specialist care, see Breadon et al (2025).

To build the workforce Australia needs, the government should unblock and reshape the supply of specialists. The government should model future workforce needs. Funding for training should shift to the specialties and regions that are under-supplied, and training site accreditation should be simplified. The government should also streamline the process for overseas-trained specialists to move here.

Specialist clinics aren’t providing enough care in under-served areas, meaning there are holes in the safety net. Through an agreement with the states, public specialist clinics should be expanded in areas that have too little care. At the same time, all public clinics should be required to become more efficient, by adopting best practices and through stronger accountability for cutting wait times.

And to drive down fees in private clinics, the government should publish the fees charged by all specialists, and claw back Medicare subsidies from the small minority of specialists that charge extreme fees.

6.2.4 Spend new health dollars wisely

Evidence-based prevention, better chronic disease management, and fairer access to care will make Australians healthier and more productive, and reduce demand for hospital care. But these reforms will require upfront spending. Governments should design the reforms to get the maximum benefit out of every extra dollar, and reduce growth in spending.

New investment is an opportunity to set new standards for productivity. As a large and growing sector of the economy, improving healthcare productivity is important for Australia’s long-run prosperity.294Productivity Commission (2023). To achieve this, governments should systematically do three things in all the reforms: target the greatest need, pay for value, and increase accountability for impact (Figure 6.7).

Figure 6.7: New investments can set new standards for productivity

ReformTargeting
Focus resources where they are most needed
Funding
Pay for value
Accountability
Measure, report, and set targets for access, equity, and outcomes
Building a prevention systemRestrict to measures that contribute to national preventive health strategy goals (according to Australian
Centre for Disease Control (ACDC) analysis)
Restrict funding to
highly cost-effective measures
recommended by the
ACDC
ACDC to evaluate all funded measures and estimate contribution to national targets
Making funding for general practice more flexibleAdjust patient budgets according to needs
(including demographics, clinical needs, and social determinants)
Require participating practices to adopt best-practice multidisciplinary teamsRequire participating practices to share data on treatments and quality of care
Co-commissioning general practice in underserved areasInvest in areas that fall below a specified threshold of services per personIndependent Health and
Aged Care Pricing Authority (IHACPA) to price salaried care based on best practices, including skill mix
Require minimum standards of access and patient satisfaction for co-commissioned services
Achieving universal dental coveragePhase in coverage over 10 years, starting with cohorts that are missing out on the most careExclude cosmetic and orthodontic treatments and set a per-patient cap to avoid overservicingRequire participating clinics to collect patient reported outcome and experience measures
Expanding access to specialist careExpand public clinics based on regional supply-demand mismatchIHACPA to adjust  outpatient prices to reflect best practicesReport outpatient wait times, with regional targets for states
Source: Grattan Institute.

6.2.5 Make hospital care more efficient

Even with these changes, hospital demand and spending will rise. Reforms are needed in hospitals so they can keep up with demand, get the best value from hospital infrastructure, and reduce cost growth.

One priority should be to make hospital care more efficient. There is a lot of variation in the quality and cost of care (Figure 6.8).295Length of stay is an important driver of the cost of admissions. Cutting excessive costs,296In the public sector, this can be achieved by ensuring that price signals cut through to hospital management: Duckett and Breadon (2014a). In the private sector, by adopting activity-based funding and other reforms: Duckett (2019). reducing avoidable complications,297Duckett and Jorm (2018). and scaling up efficient workforce models can reduce this variation.298Duckett and Breadon (2014b).

Governments should also divert more people from hospital by providing care virtually and in new, alternative settings in the community. These reforms should be at the heart of the next National Health Reform Agreement.299Breadon (2023).

Figure 6.8: There are big differences across hospitals

Note: Each point represents one hospital.
Source: AIHW (2024g).

6.3 Quick wins

The reforms detailed in this chapter will be complex to plan and, in some cases, costly to fund. But within these themes there are some quicker, easier, and cheaper reforms:

  • Introducing food regulations, such as mandatory labeling and advertising restrictions.
  • A strategy to boost vaccination that includes setting targets, simplifying guidance, sending SMS reminders, and providing a small amount of funding for tailored local promotion.300Breadon and Burfurd (2023).
  • Funding a national system that makes it easy for GPs to get advice from other specialists.301Breadon et al (2025).
  • Fixing the implementation of an existing policy that charges patients more for choosing less cost-effective PBS drugs, which could save hundreds of millions of dollars each year.302Duckett and Breadon (2015).
  • Changing the way the government pays for pathology testing, and negotiating so taxpayers share in the industry’s efficiency savings, which could save up to $175 million each year.303Duckett and Romanes (2016).

Bibliography

IN THIS CHAPTER

7 School education

7.1 Where we are

Improving the quality of school education should be a national priority. Better academic results would improve students’ lives, lift workforce productivity, and support Australian prosperity.

National and international assessments suggest we have significant work to do.

There is an urgent need to set more ambitious targets for student learning, provide schools and teachers with the robust guidance, curriculum materials, and professional development they need, and ensure teaching and other staff roles are structured in ways that maximise their impact, given persistent concerns about workforce shortages and unsustainable workloads.

7.1.1 Too many Australian students are behind in their learning

No matter the measure used, far too many Australian students are falling short of national expectations in literacy and numeracy.

In the 2024 NAPLAN tests, about one in three students did not meet proficiency benchmarks across tests of numeracy, reading, writing, and language conventions (spelling, grammar and punctuation) in Years 3, 5, 7, and 9.304Students are proficient if they are categorised as either ‘strong’ or ‘exceeding’ in 2024 NAPLAN data. See ACARA (n.d.). One in three is the average number of NAPLAN tests scored as ‘developing’ or ‘needs additional support’ across domains and year levels. This underestimates the true proportion of students scoring below proficient in at least one domain. This indicates that at least 1.3 million students across the country are at risk of leaving school without the essential foundations they need for their future.

The problem exists in all states and territories.305Grattan analysis of ACARA (2024a). Even in Victoria and the ACT – Australia’s most advantaged jurisdictions – at least one in four students were not proficient in NAPLAN reading.306Grattan analysis of ACARA (2024b).

International assessments tell a similar story. In the 2023 Trends in International Mathematics and Science Study (TIMSS), 28 per cent of Year 4 students and 36 per cent of Year 8 students were below Australia’s proficiency benchmark in maths.307Wernert et al (2024). And in the 2022 Program for International Student Assessment (PISA), an alarming 49 per cent of Australian 15-year-olds fell short in maths, and 43 per cent fell short in reading.308De Bortoli et al (2023). This puts our average performance well behind top-performers – we lag Singapore by a staggering four years in maths. We are also well behind our own historic PISA performance – in maths, our Year 10 students in 2022 were 20 months behind their 2003 peers.309We have restricted our analysis to Year 10 students because of changes in the Australian PISA sample over time. See Ainley et al (2020).

Disadvantaged students are especially let down. On the NAPLAN reading and numeracy tests, the share of students below proficient was nearly twice as high among students whose parents did not finish high school, students in regional and remote schools, and Indigenous students (Figure 7.1). But advantaged students aren’t immune either: for example, nearly one in five students whose parents have a bachelor’s degree or higher were below proficient in reading.310Grattan analysis of ACARA (2024b). PISA also lays bare the inequities that dog Australian education. There is a nearly five-year maths achievement gap between Australian 15year-olds from the lowest and highest socio-economic quartiles.311De Bortoli et al (2023, p. 79). This disparity is worse in Australia than in Canada or the UK.

Excellence is scarce too. TIMSS 2023 revealed that just 13 per cent of Year 4 students and 11 per cent of Year 8 students in Australia excel at maths.312Excelling refers to the TIMSS ‘Advanced International Benchmark’. See Wernert
et al (2024).
By comparison, 49 per cent of Year 4 students in Singapore excelled, along with 38 per cent in Hong Kong, 32 per cent in Japan, and 22 per cent in England. These economies surpass even our states with the highest share of high-performers: NSW (where 18 per cent of students excelled) and Victoria (where 13 per cent excelled).313See Wernert et al (ibid). The Year 8 trends are similar: in Singapore 46 per cent of Year 8 students excel in maths, 37 per cent in Japan, 32 per cent in Hong Kong, and 15 per cent in England. In NSW and Victoria, only 13 per cent and 12 per cent of Year 8 students excel respectively.

7.1.2 Despite recent improvements, an evidence-to-policy to-practice gap holds back student performance

Reliably translating evidence about effective teaching into actual practice across all of Australia’s 9,500-plus schools is no small feat. At a minimum, schools need clear, robust, and detailed guidance on what works best to create secure learning foundations for all students, while also encouraging excellence.

Unfortunately, guidance provided to schools is often not based on a rigorous review of the research evidence, which means teachers are sometimes given ineffective – or even counter-productive – advice. And often different teams inside the same education department adopt inconsistent approaches, which means advice given to schools by one part of the department contradicts the advice given by another part.

Figure 7.1: About one in three students are not proficient in reading and numeracy – and double that for some disadvantaged groups

Proportion of NAPLAN tests below proficient by cohort, averaged across reading and numeracy and Years 3, 5, 7, and 9

Chart showing Figure 7.1: About one in three students are not proficient in reading and numeracy – and double that for some disadvantaged groups
Notes: Percentages are the average proportion of tests below proficient across Years 3, 5, 7, and 9 for NAPLAN reading and numeracy, weighted by the number of participating students in each test. The actual number of students who scored below proficient on the reading test, the numeracy test, or both tests is higher. Percentages are taken from ACARA. ACARA includes students exempt from NAPLAN as part of the total from which percentages are calculated.
Source: Grattan analysis of ACARA (2024b).

And when guidance does point in the right direction, it is often too vague to inform decision-making in schools. For example, even well-grounded advice on reading instruction often falls short of concrete recommendations on the appropriate screening assessments teachers can use to track learning over time, despite a wealth of robust evidence on this subject.314See Section 4.2 in Hunter et al (2024) for further detail.

7.1.3 Schools struggle to find the time to focus on the highest-impact teaching tasks

Effective teaching requires high levels of knowledge and skill, and substantial time for preparation. Developing and sustaining effective teaching day in, day out, does not ‘just happen’.

Over the past few decades, our expectations about what schools should deliver have increased, while the student population in mainstream schools has become more complex.315See Hunter et al (2022b, Chapter 1) for further detail. These shifts have increased the demands on school staffs’ time and expertise. The way existing resources in the school system are deployed has not kept pace with these changes. As a result, we risk pulling school staff in so many different directions that they find it hard to deliver.

In a 2021 Grattan Institute survey of more than 5,400 teachers and school leaders across Australia, the vast majority of teachers (92 per cent) said they ‘always’ or ‘frequently’ do not have enough time to prepare for effective teaching. A large majority (77 per cent) of school leaders agreed. These findings are troubling. If teachers are not well prepared, student learning suffers.316Ibid.

7.1.4 Schools don’t have the high-quality curriculum materials and assessments they need

A whole-school approach to curriculum planning and delivery is vital to ensure every student has the best chance of developing deep knowledge and skills mastery during their 13 years at school.

But schools need more support to do this well. A 2022 Grattan Institute survey of 2,243 teachers and school leaders showed that a whole-school approach to curriculum planning is the exception, not the rule. Half of Australia’s teachers are planning their classes on their own.317Hunter et al (2022a). Only 15 per cent have access to a shared bank of high-quality curriculum materials for all their classes, and this is even less likely for teachers in disadvantaged schools.318Ibid.

Where high-quality, externally-developed curriculum materials are available, such as early years reading programs, making the best choice isn’t always easy. Governments tend to take a ‘hands-off’ approach and don’t provide advice on quality.

7.2 What we should do

7.2.1 The federal government should provide national leadership, but keep its role well-targeted

Most of the reforms needed to improve school education are the direct responsibility of state governments. And all governments should be cautious of intervening too directly into school operational matters.

But the federal government can still provide leadership and support, including through the targeted funding of initiatives that fill genuine gaps and are likely to have cross-jurisdictional and sectoral benefits. The federal government also has an important role to play in encouraging states to become more ambitious and commit to hard reforms.319Sonneman and Goss (2018, p. 20).

As part of the Better and Fairer Schools Agreement 2025-2034 (BFSA), which sets out the Commonwealth-state funding and reform commitments for schools, the states that have signed on have agreed to new arrangements that will see the federal government’s contributions for government schools increase from 20 per cent to 25 per cent of the Schooling Resource Standard by 2034.320Commonwealth Department of Education (2024).

The federal government should ensure these funds are spent well and improve student performance.

7.2.2 Set ambitious targets to improve learning

As part of the new BFSA, the states that have signed on have agreed to lift reading and numeracy performance. These commitments include:

  • increasing the proportion of students who meet NAPLAN proficiency benchmarks for reading and numeracy by 10 per cent by 2030.
  • ensuring an upward trend in the performance of disadvantaged students, including Indigenous students; students from outer regional, remote, and very remote areas; and students whose parents only completed Year 11 or below.
  • annual public reporting on progress via an online dashboard.

While this is a clear improvement on the vague goals in the 2018 National School Reform Agreement, governments should raise their level of ambition and commit to a long-term target that at least 90 per cent of Australian students reach proficiency in reading and numeracy.321Not all students sit NAPLAN. Non-participation rates should be tracked closely to ensure performance is not artificially inflated through lower participation rates among weaker students. The target should be a weighted average across Years 3, 5, 7, and 9. See Section 4.1 of Hunter et al (2024) for further detail.

To make this goal immediately tangible for all jurisdictions, especially those with a long way to go such as Tasmania, South Australia, and the Northern Territory, the federal government should encourage the states to set an ambitious but realistic intermediate target to lift the proportion of students who meet the NAPLAN proficient benchmark in reading and numeracy by 15 percentage points over the next 10 years (see Figure 7.2).

Achieving this target for reading, for example, would mean that an extra 46,500 Year 3 students across Australia would be able to read proficiently in 2034. This translates to about six more Year 3 students per primary school, on average, hitting the benchmark in 10 years time.322Grattan analysis of ACARA (2024b).

This is significantly more ambitious than the current target, which only requires a 10 per cent – as opposed to percentage point – increase. The current approach effectively locks in inequity for longer. The Northern Territory, for instance, has the most need – and the most room for improvement – but its existing target will benefit far fewer students. To meet the existing target, the NT needs to increase the number of students who reach proficiency in numeracy by only 3.8 percentage points, whereas the ACT needs to improve by 7.1 percentage points.

Annual public reporting on progress should be tabled in the federal Parliament and include analysis of both state and sector performance, as well as the performance of high-achievers.

7.2.3 Develop robust, evidence-informed guidance for schools

There is no way an individual doctor can stay on top of all the emerging research evidence and the implications for practice in their field. Neither can teachers. But unlike in healthcare, Australian governments have not tried hard enough to ensure systems are in place to tackle this challenge in education.

The federal government should lead development of a nationally consistent process for establishing robust teaching practice guidelines, with the support of the Australian Education Research Organisation (AERO).

The guidelines should be developed through a rigorous and transparent process. They should be informed by an expert panel, including researchers and practitioners, be transparent about the development process and evidence standards that are used, and be regularly reviewed to stay up-to-date. The guidelines should also include an implementation plan and be linked to practical materials, such as off-the-shelf curriculum materials and assessment tools for teachers.323See Chapter 4 in Hunter et al (2024) for further detail. This process would extend the work already undertaken by AERO in secondary literacy intervention.324See Australian Education Research Organisation (2024). This suite of guidance provides teachers with a summary of the evidence and theoretical frameworks for understanding effective reading instruction and multi-tiered systems of support in secondary school, alongside examples of decisions trees, reading assessment tools and interventions.

Practice guidelines should be developed in areas of greatest need first, where the research evidence is the most robust, such as reading and numeracy instruction and intervention. Once developed, guidelines should be used to focus further investments in curriculum materials, assessments, and professional development, and should inform school review processes.

7.2.4 Strengthen the evidence base on current and best practice

It is hard to improve large, distributed systems, such as schooling, and complex organisations, such as schools, without having a clear understanding of existing conditions and the most cost-effective ways to change practice at the front-line.

Figure 7.2: Grattan’s proposed targets would lift the level of ambition

Proportion of students proficient in NAPLAN reading and numeracy

Chart showing Figure 7.2: Grattan’s proposed targets would lift the level of ambition
Notes: Baseline percentage is the proportion of test scores which were in the ‘strong’ or ‘exceeding’ proficiency levels, averaged across reading and numeracy in Years 3, 5, 7, and 9 and weighted by the proportion of students who took each test. Percentages are taken from ACARA, which includes students exempt from NAPLAN in the totals from which percentages are calculated.
Source: Grattan analysis of ACARA (2024b).

Australian governments need to increase their understanding of what happens inside schools, including how schools organise their workforces, how teachers’ time is actually spent, and the instructional approaches and the curriculum materials and assessments that are used.325Hunter et al (2022b).

Immediate priorities include strengthening policy-relevant research on:

  • how best to use and integrate the wider schools’ workforce, including specialists and support staff, so teachers can focus on high-quality classroom instruction;
  • how to streamline the work involved in core teaching activities, to reduce the need for teachers to ‘re-invent the wheel’ in curriculum and lesson planning; and
  • how to increase school leaders’ flexibility to strike a sensible balance between class sizes and teachers’ face-to-face teaching time, and to smooth out workloads over the school year, by scheduling more time for teachers to work together in term breaks on professional development or preparation activities.326Ibid.

7.2.5 Mandate a Year 1 Phonics Screening Check with a Year 2 resit for struggling students to ensure they catch up

Universal screening is the most effective and cost-efficient way to ensure any student at risk of falling behind in their learning is identified early and given the help they need to catch up.

It is critical that students who struggle with word decoding in the first few years of school are identified early and provided with additional learning opportunities, such as targeted instruction.327Castles et al (2018), and Machin et al (2016). If these students still do not progress, additional diagnostic assessments might be necessary to identify any underlying learning difficulty or disability.

In Australia, there is currently no national measure of reading performance until Year 3 (via NAPLAN), by which time most students should already be well on their way from ‘learning to read’ to ‘reading to learn’.

Grattan Institute recommends that all Year 1 students – government, Catholic, and independent – be screened using the Australian Government Year 1 Phonics Check. This check is freely available, accurate, and efficient, only taking about seven minutes to administer one-on-one with a teacher.328Department of Education (2023).

The check quickly assesses students’ decoding skills by evaluating their ability to decode 40 words and pseudo-words of increasing complexity.329Phonics is understanding the connection between individual sounds of spoken language (phonemes) and letters (graphemes) that represent those sounds: Education Endowment Foundation (2021). A mandatory Year 1 Phonics Check in all schools, irrespective of state or sector, would provide a national picture of students’ early progress towards reading proficiency before the Year 3 NAPLAN assessment. Students who do not meet the ‘expected level’ in Year 1 should be re-assessed in Year 2 to make sure they are on the way to catching up.

Aggregate state-wide results for the Year 1 assessment and the Year 2 resit should be reported publicly, with sector and cohort breakdowns, to help identify best practice and areas most in need of additional support.

Governments should set a target of at least 90 per cent of students achieving the ‘expected level’ by Year 2, with appropriate interim targets established once baseline data are collected. England has been able to hit 90 per cent of students meeting the benchmark by Year 2;330UK Department of Education (2024). Australia should be able to do the same.

Most states and territories have committed to or already implemented the Australian Government Year 1 Phonics Check, but only Tasmania has done so across all school sectors.331Queensland and WA are the only states that have not committed to or implemented the Australian Government Year 1 Phonics Check. The NT and the ACT have announced that government schools will complete the check from 2025. It will be mandatory in Victorian government schools from 2026. While the new BFSA requires states to introduce a phonics check, it is not clear which specific assessment will be used and no Year 2 resit process is mentioned.332For instance, Tasmania’s bilateral agreement makes clear that all Tasmanian students will complete the ‘National Year 1 Phonics Check’, whereas Western Australia’s agreement states that government school students will sit a ‘Year 1 phonics check’, but schools can choose which specific assessment they use. See
Commonwealth Department of Education (2024).

Implementing the check and the resit process should be a priority for all governments, to boost equity in school education and ensure struggling students catch up.

7.2.6 Develop a suite of national professional development courses to build teachers’ expertise

The federal government should work with the states and territories to develop and roll out a suite of quality-assured specialist professional development courses, to up-skill teachers and school leaders.333The federal government has recently invested in a course on phonics, which is designed for Foundation-to-Year 2 teachers and includes seven modules of 20-to-45 minutes each.

The government should look to the UK’s National Professional Qualifications (NPQs) as a model. The NPQs are a suite of micro-credentials focused on key areas of practice, such as literacy and maths instruction, behaviour management, and school leadership. The ‘Leading Primary Maths’ NPQ, for instance, is aimed at teachers and leaders who are aspiring to or currently lead maths instruction in their school. It is a fully-funded 12-month program, with a mix of face-to-face and online learning for one-to-two hours a week. It is delivered by six accredited providers across England. Schools receive £200-to-£800 for every teacher who starts a NPQ, and participants need to pass a written assessment to gain the qualification.334For further detail see UK Education and Skills Funding Agency (n.d.).

NPQ content is quality assured by an independent body – the Education Endowment Foundation – and independent reviewers also inspect providers’ delivery every two years.

An Australian suite of professional development courses should:

  • be developed for different skills and roles. For instance, in the area of literacy instruction, there should be options designed for school leaders, instructional specialists, and early years teachers.
  • require participants to pass a final assessment on the knowledge and skills covered by the course.
  • be quality-assured against rigorous guidelines by an independent body.

7.2.7 Invest in an independent, non-government body to quality-assure curriculum materials

The federal government should fund an independent quality-assurance body to review comprehensive curriculum materials, including text books and web-based curriculum materials, that are aligned with the Australian Curriculum, the NSW Syllabus, and the Victorian Curriculum.

A robust quality-assurance process would significantly lift the standard of curriculum materials available to Australian schools. In turn, this would improve the quality of instruction and reduce teacher workloads involved in creating curriculum materials from scratch.335Hunter et al (2022a).

The new body should have a narrow focus on quality assurance, and be genuinely independent. Given the complexity of Commonwealthstate relations and the fact that governments are themselves active participants in the creation of curriculum materials that vary widely in quality, the new body should be established as a not-for-profit, non-government organisation, to ensure integrity and confidence in its reviews, irrespective of whether the curriculum materials were created by a government or private publisher.

There are several international examples of robust, independent quality-assurance mechanisms.336In addition to the example from the US described in detail here, there are curriculum quality-assurance mechanisms in Singapore, South Korea, Poland,
and Japan. See Minister of Education Singapore (n.d.), Jensen et al (n.d.), and Tarkowski and Voicu (n.d.).
One is EdReports, a US not-for-profit established in 2015. EdReports reviews the quality of comprehensive curriculum materials, such as textbooks and web-based curriculum materials, and publishes the results on its website. Reviews are conducted by accomplished teachers – with 17 years of experience on average – who receive more than 25 hours of training.337See Hunter et al (2022a, p. 48) for further details on the EdReports model.

EdReports’ quality reviews are thorough. Its teams spend four-to-six months reviewing each set of materials, in a process that takes hundreds of hours. Teams evaluate materials against detailed, evidence-informed criteria on quality and usability in the classroom. The criteria for reviewing Foundation-to-Year 8 Math curriculum materials, for example, are set out in a 100-page guide. This requires reviewers to closely examine materials page by page.338For example, when assessing Year 1 Maths curriculum materials, one criteria reviewers have to assess against is whether materials provide students with
enough opportunities to practise so that they can fluently add and subtract numbers below 20: see EdReports (2023).

EdReports has improved the quality of curriculum materials available to US teachers. It has reviewed more than 550 comprehensive curriculum materials across Foundation-to-Year 12 English and Maths, covering 97 per cent of the market. Of the Maths curriculum materials reviewed, 49 per cent fully passed EdReport’s quality benchmark.339EdReports (2024).

An external review process with transparent quality criteria encourages publishers to invest in improving the quality of their materials. EdReports’ robust and independent quality assessments also give governments confidence that they are spending public money well. US teachers also report regularly using more high-quality materials than before.340In 2018, 31 per cent of US Maths teachers surveyed reported regularly using curriculum materials that had passed EdReports’ quality-assurance process. By 2023, this was 51 per cent: Doan and Shapiro (2023).

A similar model would work well in Australia’s federal system. In the US, different state governments and school districts use EdReports’ reviews to inform which curriculum materials they purchase, subsidise, or recommend to schools.

The federal government should help fund a not-for-profit, nongovernment body to establish a similar, independent, quality-assurance process for curriculum materials in Australia.341One potential way to ensure the body’s independence would be to set it up as a
not-for-profit with endowment funding.
The annual cost of conducting quality reviews would be infinitesimally small in the context of governments’ annual spending on schooling.

The federal government, alongside the states and territories, should also commit to ensuring that any comprehensive curriculum materials they develop in-house or commission from third parties, are also put forward for independent quality review, to ensure these materials genuinely support quality teaching.

Bibliography

IN THIS CHAPTER

8 The NDIS

8.1 Where we are

The NDIS (National Disability Insurance Scheme) is the largest social reform in Australia since the introduction of Medicare. It has transformed the lives of hundreds of thousands of disabled Australians and their families, and is responsible for employing many hundreds of thousands of Australians in the care sector. In just 12 years, the NDIS has become a vital part of Australia’s social fabric.

But the NDIS has grown too big, too fast. The NDIS cost $43.9 billion in 2023-24.342Includes total payments and operating expenses: NDIA (2024a, pp. 78, 83). It is one of the fastest growing pressures on the federal budget.343Treasury (2023a, p. 147). And it risks crowding out other essential services and diverting attention from wider reforms that could benefit all disabled Australians.

Yet many Australians with disability do not receive any services from the NDIS. As federal and state NDIS expenditure has grown, other disability services have contracted. Design flaws and governance failures baked in from the start have persisted, and much-needed reform has been slow.

Most of the heavy lifting to get the NDIS back on track remains to be done. More bold policy decisions are needed. Reining in growth, establishing alternative supports for disabled Australians whose needs are not currently being met, and implementing a more consistent and equitable NDIS are top priorities. And while combatting fraud is important for ensuring that money is better spent, it is unlikely to make a significant difference to the overall budget.344NDIA (2024c).

Figure 8.1: NDIS spending is growing much faster than other government social care spending

Government expenditure, 2023-24 dollars

Chart showing Figure 8.1: NDIS spending is growing much faster than other government social care spending
Note: Dollar amounts inflated to 2023-24 dollars using the general government final consumption expenditure chain price deflator (see Productivity Commission (2025a)).
Sources: Productivity Commission (2025a), NDIA (2024b), and Department of Health and Aged Care (2024).

These are not quick fixes, but they are the right ones to ensure disabled Australians get the life-changing support they need. Getting these reforms embedded is achievable during the next term of federal government, needn’t mean spending more overall, and will yield benefits for our economy, our prosperity, and our diverse society.

8.1.1 Australia is spending more than ever on disability, but it is poorly targeted

In 2011, when the Productivity Commission wrote its report calling for an NDIS, Australia lagged behind many comparable countries in the amount of money spent on disability. The same cannot be said today.345Grattan Institute analysis of Eurostat social protection data (European Union (2024)) and Productivity Commission Return on Government Services data (Productivity Commission (2024h)).

The federal government and the states and territories are spending more than ever before on disability (see Figure 8.2). Overwhelmingly, this expenditure is made up of their respective contributions to the NDIS.346Ibid. The federal government is responsible for an increasing share of the total, as a consequence of bilateral agreements which capped state rates and saddled the federal government with the upside growth risk.347NDIA (2022).

Figure 8.2: Australian governments are spending much more on disability services than they were before the NDIS

Expenditure on direct disability service delivery, 2023-24 dollars

Chart showing Figure 8.2: Australian governments are spending much more on disability services than they were before the NDIS
Note: Includes all expenditure on direct disability service delivery by Australian governments.
Source: Productivity Commission (2025a).

NDIS expenses are expected to grow to $58 billion by 2028, assuming that targets set by National Cabinet last year to moderate annual growth to 8 per cent are met.348NDIA (2024d, p. 8).

Increased spending from what was a very low base is a good thing. The problems are the concentration of this spending on an NDIS population that does not include all disabled Australians who might benefit from some level of support; and the sole reliance on individualised funding for this group.349The 2023 NDIS Review illustrated the insufficiency of Home and Community Care services for people younger than 65 and not eligible for the NDIS, including people who had lost access to these services when the services were moved into the new scheme: NDIS Review (2023a, p. 76). When surveyed, 90 per cent of disabled people who don’t get support from the NDIS say the services they rely on in their day-to-day lives are inadequate to meet their needs.350Olney et al (2022, p. 13).

There is little evidence that the promises made in successive federal government and state/territory Disability Strategies of more accessible and inclusive mainstream services for all disabled people have materialised.351The most recent progress report on Australia’s Disability Strategy 2021-31 showed either no change or regress in 15 of 22 measures: AIHW (2024h, p. ix). Quite the opposite: as costs have been shifted to the NDIS from health, justice, and housing, the states and territories have sought to minimise their funding responsibilities.

Australia’s disability system is complex and confusing, a situation exacerbated by the absence of an overarching agreement to clarify funding and implementation responsibilities and promote cooperation and accountability across federal, state, and territory governments.352Productivity Commission (2019, p. 5).

As it stands, disability services in Australia have become an all-or-nothing proposition; either you get an NDIS plan, or you get minimal mainstream services.

8.1.2 Unsustainable NDIS growth is inevitable under current policy

In this context, it is unsurprising that there is a strong gravitational pull of unmet need towards an NDIS that was established as uncapped, demand driven, and essentially open-ended.

Worse still, the NDIS as implemented is ill-equipped to manage these mounting pressures.

The original NDIS design was for a multi-tier scheme with different levels of coverage, clear and enforceable eligibility criteria, data-led resource allocation, and a sophisticated operational risk management approach.353Productivity Commission (2011). In short, a proper insurance model to manage lifelong disability support needs and costs. The current NDIS has none of these things in place as it continues to grow.

The issues that now threaten the NDIS are the result of longstanding failures in scheme design and governance that have come into increasingly stark relief as the program has grown in size and cost.354The 2016 Annual Financial Sustainability Report (NDIA (2016a)) highlights that these issues have been apparent throughout the lifetime of the NDIS.

8.1.3 More people have joined the NDIS than ever expected

The number of disabled people entering the NDIS was expected to stabilise after the initial transition period when people already getting support from state and territory programs moved across into the national scheme.

This has happened for most groups, with the significant exception of children with developmental delay or autism, who now make up almost half of all people on the NDIS, including about 160,000 children under the age of nine (see Figure 8.3).355NDIA (2024f, p. 28). About 11 per cent of all Australian six-year-olds were on the NDIS in June 2024, including 14.2 per cent of six-year-old boys.356Ibid (p. 21).

In 2011, the Productivity Commission estimated the NDIS would reach 490,000 people;357Productivity Commission projection (Productivity Commission 2011), inflated to account for population growth using ABS Estimated Resident Population (ABS (2024i)). it is now supporting nearly 700,000 people and this is projected to surpass a million by 2034.358NDIA (2024d, p. 78). The number of adults is only a little higher than was originally expected; the number of children, however, is nearly double (Figure 8.3).

Figure 8.3: There are far more children in the NDIS than originally expected

Number of projected and actual NDIS participants by age bracket

Chart showing Figure 8.3: There are far more children in the NDIS than originally expected
Notes: Productivity Commission estimates have been inflated based on population growth for 0-64 year-olds between the reference year (2009) and 2024, using Australian Bureau of Statistics Estimated Resident Population data. Proportions are rounded to the nearest 5 per cent.
Sources: Productivity Commission (2011), NDIA (2024e), and ABS (2024i).

Yet, individualised funding is geared toward adults with lifelong and severe disability, who need services that fit with the idiosyncrasies of their life. The needs of children are different, as are the needs of some adults with new or episodic disabilities.

While numbers of new entrants for all major disability types fell below what was expected last year, it appears likely this resulted from operational challenges rather than a decrease in demand.359Ibid (p. 52).

Accordingly, new entrants are expected to increase again in 2024-25, as the NDIA ‘catches up’ on its backlog of eligibility assessments, which could represent a challenge for National Cabinet’s target to moderate growth in NDIS spending to 8 per cent.360Ibid (p. 16).

In the meantime, the NDIS is groaning under the weight of unsustainable work volumes, with about 85 per cent of new applicants waiting more than the ‘guaranteed’ 21 days for an access decision to be made.361NDIA (2024f, p. 50).

Once people are in the NDIS, they rarely leave it

People leave the scheme either because they pass away, they leave voluntarily, or they no longer meet the eligibility criteria. Non-mortality exit rates have been consistently lower than expected for all people in the NDIS.362NDIA (2024d, pp. 56–57). This is especially true for children, and for over-65s, who make up a small but growing proportion of participants.363At 30 June 2024, 5 per cent of participants (33,376 people) were older than 65, compared with 2.4 per cent (6,976 people) in 2019. This cohort is projected to increase to 7.6 per cent (78,151 people) by 2034: NDIA (2024d, p. 71) and NDIA (2019, p. 47). A greater focus in 2024 on reassessments to determine ongoing eligibility resulted in only half of the exits that were projected.364NDIA (2024d, p. 57).

Most children stay on the scheme for the long term, even though the expectation was that many children would receive time-limited early intervention.

Foundational supports will help ease NDIS numbers growth

‘Foundational supports’ is the name the 2023 NDIS Review gave to lower-level disability supports not delivered as individualised funding.365NDIS Review (2023b). These supports are integral to the vision of bridging the gap between individually funded NDIS supports that are available to some, and mainstream and community services that are available to all.366Productivity Commission (2011).

These supports were intended to help prevent, reduce, or delay the need for people to get specialist disability services, by improving their access to community and mainstream services and building their capacity to participate in the community and economy.367Council of Australian Governments Disability Reform Council (2015, p. 2).

In a world where disability insurance begins and ends with the NDIS, there is a strong incentive for the more than two million disabled Australians under 65 to join the scheme, and a strong disincentive for anyone to transition out of it. The results are increased dependency on individualised funding, and rising costs.

Building up foundational supports can help to change these incentives, and stem the tide of people turning to the NDIS as the sole source of support. Grattan Institute has argued that commissioning plenty of foundational supports for children would mean there is an appealing substitute for individualised funding, ensuring many children are well-provided for in a more cost-effective way.368Foundational supports are also more suited to providing support where children live, learn, and play, in line with best-practice principles. Bennett et al (2024a, pp. 52–53).

The renewed focus on establishing foundational supports that the NDIS Review has called for, and which the federal government and the states have agreed to fund 50/50, should help smooth the cliff at the edge of the NDIS. But so far, these services have not materialised, with negotiations stuck on the scale of future liabilities being passed to the states.

8.1.4 Average costs per person are increasing each year

The average growth in payments per person on the NDIS is currently tracking at 7 per cent per year.369NDIA (2024d, p. 62). Payments increase for many reasons, including inflation, changes to enterprise bargaining agreements, or people becoming eligible for more intensive supports.370Ibid (p. 62). However, there is a persistent trend in people receiving more money with each new plan, that can’t be completely explained by these reasons.

The upshot of higher numbers entering the NDIS and persistent growth in payments is that overall NDIS costs have grown by an average of about 20 per cent per year over the four years to 2024 in real terms.

Even though growth slowed to 13 per cent in 2024, getting this down to 8 per cent by 2026 will clearly be challenging.

Adherence to insurance principles will help manage costs

An NDIS grounded in insurance principles needs consistent processes to assess eligibility and funding entitlements, and strong independent governance to manage sustainability risks.371NDIA (2016b).

But the NDIA has had insufficient policy levers to adapt to emerging pressures, and no risk-margin reserves to navigate choppy waters.

The way the NDIS system has created plans and apportioned funding to date helps to explain why average payments keep increasing.

One way to move towards insurance principles is to equitably distribute the overall budget based on the estimated needs of people in the NDIS, with a clear link between individual plans and overall resources.

In practice, the task of deciding each person’s NDIS supports has been left in the hands of well-meaning, junior bureaucrats working with vague and complex criteria through a process that is disconnected from the overall budget.

Inconsistency and inequity is hard-wired into the NDIS design. This has made it hard to control costs. It has also served participants very poorly, because the system invites disputes and plan inflation.

The NDIS Review and subsequent legislative changes have set a path for rectifying this issue through a new standardised assessment and planning framework, which will replace the current model once designed and set out in rules. But getting this new process established is technically complex and won’t happen overnight.

8.1.5 Innovation is rare and results are unclear

Within an insurance model, NDIS-funded supports should build or maintain people’s capacity, improve independence, and promote social and economic participation to reduce lifetime costs.

The intended focus of the NDIS on long-term funding and early intervention for its target groups was to be underpinned by research to build evidence for the potential of different supports to help disabled people and the scheme’s financial outlook over the long-term.

But little research has been done and the anticipated new market of services to deliver better housing, work, and social results has not emerged.372NDIS Review (2023b).

While many people on the NDIS get increased choice, there are few examples of innovation in how supports are provided, and few indications that individual purchasing decisions have driven systemic changes in the market.373AIHW (2024h).

Market stewardship is too limited

Stewardship of the NDIS market has largely been confined to price controls communicated through an increasingly labyrinthine price guide, and limited trials of alternative commissioning in under-serviced areas.

But consumer choice and a reliance on market forces is not delivering equitable or innovative results.374NDIS Review (2023b), and Green et al (2023).

This problem is most acute for people with high needs, such as people who need intensive housing and living supports. Grattan Institute research shows that little has changed for Australians with profound disability since the start of the NDIS.375Bennett and Orban (2024).

Relying on the individual purchasing decisions of a high-needs group with low expectations is unlikely to spur market innovation. Like other markets for care and welfare services, sometimes referred to as ‘quasimarkets’,376Carey et al (2020). the NDIS needs more careful market stewardship to overcome these issues.377Meagher and Goodwin (2015).

While the NDIS Review highlighted the importance of innovation, its recommendations on market stewardship are largely confined to changes in pricing policy, which are unlikely to deliver transformative results.378NDIS Review (2023b).

Information and data-sharing is also under-developed in the NDIS.379Green et al (2023), and Malbon et al (2024). The newly established National Disability Data Asset is a positive development, and will be an important tool for better understanding peoples’ experiences of the NDIS,380National Disability Data Asset (2024), and NDIS Review (2023a). including filling a crucial outcome measurement gap.381National Disability Data Asset (2024), and NDIS Review (2023a).

8.2 What we should do

The government should stay the course on current reforms, but further bold policy decisions are also needed to get the NDIS back on track.

Current assumptions are that legislative changes and operational reforms initiated under this federal government will be sufficient to get NDIS cost growth down to the target set by National Cabinet in 2023: that is, 8 per cent year-on-year growth by 2026-27.382NDIA (2024d). This reduced growth rate would realise $19 billion in savings over the next four years (see Figure 8.4).

Figure 8.4: The NDIA is banking on proposed reforms to deliver big savings over the next four years

Chart showing Figure 8.4: The NDIA is banking on proposed reforms to deliver big savings over the next four years
Source: NDIA (2024a).

But even 8 per cent annual growth is untenable in the long-term, far exceeding growth in other comparable national programs (see Figure 8.1).

The remainder of this chapter sets out the actions needed during the next term of government. We will publish a full report that incorporates and expands upon these proposals later in 2025.

8.2.1 Redirect existing NDIS funds to foundational supports

It is imperative that governments make a serious investment in foundational supports that can meet the needs of disabled people more effectively and efficiently, including people who would not qualify for an individual NDIS support package.

Grattan Institute research shows it is possible to significantly invest in foundational supports using existing NDIS funds so that a wider population of disabled Australians have their needs met, while reducing pressure on the NDIS.383See Strong foundations: Spreading a wider net of disability insurance in which we identify $830 million of existing expenditure which could be used to fund general foundational supports: Bennett et al (2024a).

The current impasse on foundational supports could be overcome by governments setting a ceiling for individualised funding and redirecting committed NDIS funds to establishing a sufficient range of alternative supports and services. Achieving this would require bi-lateral governance mechanisms in each jurisdiction to direct the investment so that it plugs local gaps and responds to unmet need.

The current focus on foundational supports for children with disability and/or developmental delay is a good start, but the scope should extend quickly to people with psychosocial disability as well.

The government should publish a more detailed roadmap for implementation of foundational supports as an early priority, showing what NDIS funds will be redirected, and when, over a staged transition.

8.2.2 Decide how to best meet the needs of key groups

As foundational supports are established, the government will need to decide the most efficient and effective way to meet the needs of several groups of people that currently depend on individualised funding, but who are not well served by this service design. This should include:

  • Young children with a developmental delay – who need services that are better integrated into mainstream settings.
  • People on the autistic spectrum who do not have substantially reduced functional capacity – who need low-level support rather than individualised funding.
  • Adults with a psychosocial disability – who need more programmatic support for capacity building and personal recovery.
  • People with chronic health conditions – whose needs are most appropriately managed in the health system.

The government should review access criteria for the NDIS and legislate to tighten the scope of eligibility consistent with the original objective that the NDIS should support those with the highest level of need.384Productivity Commission (2011).

8.2.3 Implement the new assessment and planning model

In parallel with investment in foundational supports, it is critical that timely progress is made to develop and implement a fair, objective, and consistent method for allocating individual NDIS support packages.

The Department of Social Services should expedite the development of rules to support adoption of the new process, informed by technical design of a new assessment and budget-setting model by the NDIA. And the NDIA should ensure that the new assessment workforce funded in the 2024 mid-year budget update are appropriately skilled to administer standardised instruments within an insurance context.385Treasury (2024b, p. 19).

Past mistakes must be avoided, with equal emphasis placed on the improved planning experience this reform should enable. The government should rethink the Section 10 rule, which unduly constrains the choice and flexibility that should underpin the NDIS. Amendments to the NDIS legislation in 2024 introduced a new interim rule that lists which supports are, or are not, ‘NDIS Supports’.386The National Disability Insurance Scheme (Getting the NDIS Back on Track No.1) (Miscellaneous Provisions) Transitional Rules 2024. The current Section 10 List is a fix for the old system rather than a framework that supports the evolution to a new one.387Bennett (2024).

The government should work with the disability community to design a fit-for-purpose replacement which ensures greater choice and flexibility for plan-holders.

8.2.4 Get serious about market stewardship

The NDIA must become a more active market steward, to ensure disabled people and service providers have better information, to encourage innovation, and to drive improvements in quality. The NDIA should intervene in the market more aggressively, by commissioning services directly, especially in under-serviced parts of Australia.

Our research has shown that NDIA market stewardship needs to be devolved more locally.388Bennett and Orban (2024). The NDIA should create a network of regional hubs mirroring the geography of Primary Health Networks, that can facilitate the growth of innovative NDIS services for their local communities.389For further detail on this proposal, see Bennett and Orban (ibid, pp. 41–43).

The NDIS Quality and Safeguards Commission should also be given sufficient powers and resources to do its job, including introducing a right-of-entry to make unannounced inspections of providers of high risk services.390Bennett et al (2024b).

Prioritise innovation in NDIS housing and support

About 43,500 people in the NDIS have profound disability and need intensive housing and living supports. These supports are costly, at about $400,000 per person per year. That’s almost 40 per cent of total costs of the NDIS for only about 7 per cent of users.391Bennett and Orban (2024).

For this price tag, disabled people deserve, and governments should expect, far better services and results. The only option for many people with intensive housing and living support needs is group homes, where they are at high risk of violence, abuse, neglect, and exploitation.

There are better and cheaper alternatives to group homes, but they are not widely available, in part because NDIS policies are too rigid and its funding too inflexible. Other countries, including the UK, the US, and Canada, have successfully reformed disability housing and introduced new living arrangements which offer people greater choice and a more individualised approach.392Ibid.

The government should give more support to alternative options that are working well in Western Australia and overseas, and will help more disabled people into ordinary housing in the community for the same or less money than current services.

The government should establish an NDIS innovation fund to trial and spread individualised living arrangements and optimise the use of technology in delivering cost effective in-home supports.393Ibid.

And the government should reform the group home model so people with profound disability who want to share their support can choose where they live, who they live with, and how services are provided in their home. Large group homes should be phased out within 15 years.

8.2.5 Establish a new National Disability Agreement

Australia needs a new, overarching National Disability Agreement, to clarify the relationship between all aspects of the disability policy landscape, and to facilitate cooperation and greater accountability between governments.

The 2008 agreement is long defunct. A reinvigorated version reflecting the contemporary disability system could bring much-needed cohesion to government policies and enable a collaborative response between service systems.

The federal government should work with states and territories to develop a new agreement reflecting the content and scope recommended by the Productivity Commission in its 2019 report.394Productivity Commission (2019). The agreement should:

  • outline the role of the NDIS in providing supports to people with permanent and significant disability;
  • make clear that the federal, state, and territory governments share responsibility for the NDIS – and make clear their respective funding contributions;
  • include a statement that affirms governments’ commitment to clarifying which supports to NDIS participants are to be provided through mainstream service systems and which are to be provided through the NDIS;
  • clearly reflect the role of foundational supports in supporting all people with disability, and their families and carers; and
  • incorporate a strengthened performance framework to improve accountability to people with disability, their families and carers, and to the wider community.

This agreement should be the vehicle through which the billions of dollars already ‘baked in’ for the NDIS over the next four years are invested more efficiently and effectively to meet the needs of disabled Australians.

Bibliography

IN THIS CHAPTER

9 Retirement incomes

9.1 Where we are

Overall, Australia’s retirement incomes system is serving us well. Current retirees are more financially comfortable than working-age Australians, and future retirees are projected to have adequate retirement incomes. Despite our ageing population, government spending on the Age Pension is low and sustainable.

But Australia’s retirement incomes system faces some big challenges.

More than half of single retirees who rent in the private market live in poverty. And falling rates of home-ownership among younger, poorer Australians mean these problems are likely to get worse.

The cost of superannuation tax concessions is too high: they now total $52 billion a year and will soon exceed the cost of the Age Pension. Two-thirds of the benefits flow to the wealthiest 20 per cent of households, who already have enough resources to fund their own retirement.

Australia makes superannuation far too complex in retirement. Most people find retirement planning stressful, despite having saved enough for their retirement. Few retirees draw down on their retirement savings as intended, and many are net savers. This is turning Australia’s multi-trillion dollar compulsory superannuation system into a massive inheritance scheme. And the work to improve the efficiency of the super system remains incomplete.

9.1.1 Retirement incomes are adequate

Most retirees today feel more comfortable financially than younger Australians who are still working. Retirees today are less likely than working-age Australians to suffer financial stress such as being unable to pay a bill on time.395Coates and Nolan (2020, Figure 4.3, Figure 4.1).

The full Age Pension provides an adequate, albeit modest, income in retirement for people who own their home but have little other wealth.

Across the income distribution, people typically have enough money to sustain the same, or a higher, living standard in retirement as when they were working.396Coates and Nolan (ibid, Figure 4.4).

The incomes of most future retirees are also likely to be adequate. Grattan Institute modelling shows that, even after allowing for inflation, the typical (i.e. median) worker today can expect a retirement income (or ‘replacement rate’) of at least 90 per cent of their pre-retirement income – well above the 70 per cent benchmark endorsed by the OECD and others.397Coates and Nolan (ibid, Figure 4.5).

The federal government’s 2020 Retirement Income Review reached similar conclusions. Even most Australians who work part-time or have broken work histories will hit or exceed this benchmark.398Callaghan et al (2020, Chart 2C-14, Table 2C-5, pp. 194-204). The Retirement Income Review adopted a 65-to-75 per cent adequacy benchmark and projected that the replacement rates for future retirees with typical working lives met this standard across all income levels. This held even with a lower investment-returns assumption. The Review also projected that the replacement rate of median workers who withdrew $20,000 in super when they were 30, then remained out of the workforce for two years and under-employed for another five, would fall from 87 per cent to 82 per cent.

9.1.2 Age Pension spending is sustainable

Despite the ageing population, Australia’s Age Pension is sustainable. The latest Intergenerational Report projects that government spending on the pension will fall from about 2.3 per cent of GDP in 2022–23 to 2.0 per cent in 2062–63.399Treasury (2023a, p. 170).

9.1.3 Retirees who rent are struggling

Many retirees who rent are being left behind. More than two in three retirees who rent privately live in poverty, including more than three in four single women. More than half of retirees who rent have less than $25,000 in savings.400Coates et al (2025a). And a growing number of older Australians, particularly women, are at risk of becoming homeless.

This problem is set to get worse. Home-ownership is falling fast among poorer Australians who are approaching retirement (Chapter 5).

Many older working Australians who rent do not have sufficient savings to pay the rent in retirement.401Coates et al (ibid). For instance, 40 per cent of renting households aged 55-64 have less than $40,000 in net financial wealth.402Coates et al (ibid, p. 22). And whereas 40 per cent of retirees who rent today live in social housing, where rents are capped at 30 per cent of income, far fewer can expect to do so in future, because Australia’s social housing stock has stagnated.403Coates et al (ibid, p. 23).

Figure 9.1: Retirees who rent are much more likely to live in poverty

Income poverty rate for retiree households, by tenure, 2019-20

Chart showing Figure 9.1: Retirees who rent are much more likely to live in poverty
Notes: Income poverty is measured as equivalised household disposable income (after housing costs) being less than half of the median for the population, excluding households with unincorporated business income, or households who report zero or negative incomes. See Coates and Nolan (2020, p. 22) for further discussion of income poverty measurement. Retiree households are defined as those where the reference person is older than 65 and not in the labour force.
Source: Grattan analysis of ABS (2022d).

9.1.4 Home-owning retirees don’t use their equity

High house prices mean Australians who purchase a home are spending more of their lifetime income on housing. And more Australians are retiring with mortgage debt – about 13 per cent of over-65s had a mortgage in 2019-20.404LaMonica (2024).

Unless Australians are willing to draw on their home equity in retirement, rising house prices mean Australians will be left with lower living standards both while working and in retirement. Yet few retirees draw down the value of their home to fund their retirement, either by downsizing or by borrowing against home equity, such as by using the federal government’s Home Equity Access Scheme.

9.1.5 Safety nets for early retirees are inadequate

Australia’s income support system does not adequately protect people against the risks associated with involuntary early retirement. About 40 per cent of people who retired aged 60-64 between 2013 and 2019 did so involuntarily, such as by becoming unemployed, acquiring a disability, or having to provide care.405Callaghan et al (2020, Chart 10). More than one third of people who retired early report living in poverty today, second only to retirees who rent.406Callaghan et al (ibid, Chart 1). Early retirees were identified as people aged 55-64 and not in the labour force.

Some people who are forced to retire may be eligible for the Carer Payment, which is paid at the same rate as the Age Pension, or for the Disability Support Pension.407The eligibility requirements for the Disability Support Pension were tightened in 2012, to the detriment of many near-retirees with musculoskeletal health
problems. See Coates and Nolan (2020, pp. 13–15).
But many early retirees are forced to rely on the JobSeeker payment, which has become a woefully inadequate safety net for unemployed Australians (Chapter 2).

9.1.6 Superannuation tax concessions are too generous

Super tax breaks cost more than $50 billion a year – nearly 2 per cent of GDP.408Grattan analysis of Treasury (2024d, Table 1.2) and ABS (2024j, Table 1). They are expected to cost almost 2.5 per cent of GDP by 2062, and to overtake the cost of the Age Pension by the mid-2040s.409Treasury (2023a, Figure 7.21).

These tax breaks are also poorly targeted. Two-thirds of the benefits flow to the wealthiest 20 per cent of households, who already have enough resources to fund their own retirement.410Coates and Moloney (2023d, Figure 1.4).

Nor do super tax breaks materially reduce Age Pension spending. That’s because the cost of super tax breaks far outweighs the Age Pension savings they produce, with the bulk of the benefits going to higher-income earners who would never receive the Age Pension.411Callaghan et al (2020, Chart 4A-23).

9.1.7 Recent reforms have forced super funds to lift their game, but further work remains

Australians continue to pay too much in superannuation fees: more than $30 billion a year, which is more than they spend on energy bills.412Coates and Moloney (2024, p. 4).

Poor market design, leading to a lack of competition and accountability for funds, has led to high costs and poor outcomes for super fund members over many years.413Productivity Commission (2018).

Successive governments have improved the performance of super funds’ offerings to workers over the past decade, helping save Australians up to $7 Successive governments have improved the performance of super funds’ offerings to workers over the past decade, helping save Australians up to $7 billion a year.414The Productivity Commission estimated the typical fee for working-age members in 2010 was 1.25 per cent of assets. By 2023, we estimate it was down to about 0.9 per cent. The estimate of $7 billion is the value retained by working-age members of institutional funds from this difference: Grattan analysis of Productivity Commission (2018, Figure 3.11), APRA (2024a, Tables 4a, 5a, 6a), and APRA (2024b). In particular, the 2021 Your Future, Your Super package, especially the performance test and the introduction of ‘stapling’, whereby a single super account follows workers when they change jobs unless they choose otherwise, was a big step in the right direction.415As at June 2022, members of the products that failed the first round of the performance test in 2021 were paying fees at least 20 per cent lower than before the test was announced: Coates and Moloney (2022, Figure 1.1).

Yet more is needed. In particular, the superannuation system needs a better competitive process for allocating default status for working-age super – the key outstanding recommendation from the 2018 Productivity Commission report – especially now that workers are ‘stapled’ to a single fund for their entire working lives.416Productivity Commission (2018, Recommendation 2).

Sharpening super funds’ incentives is important in the retirement phase too, because Australians can expect to earn more than half their investment returns, and pay more than half their fees, in the years after they retire.417About 75 per cent of super fund returns are earned from age 60, and 60 per cent after age 67, assuming death at age 92. Assumptions as per the baseline of the Grattan Retirement Income Projector in Coates and Nolan (2020, Chapter 3). Yet despite the higher stakes, the market design for retirement-phase superannuation remains much weaker.

Unlike working-age super, there are no ‘default’ super fund offerings in retirement, and retirement products are not subject to performance testing or public assessments by the Australian Prudential and Regulatory Authority (APRA).418Public assessments were formally called ’Heatmaps’.

9.1.8 Super is too complex in retirement, and few retirees spend their savings

Australians today are retiring with more than $200,000 in their super, on average.419Coates et al (2025b, Figure 1.1). By the early 2040s, most Australians will retire with at least $250,000 in their super (in today’s dollars), and by the 2060s many will be retiring with nearly $500,000 in their super.420Treasury (2021, Chart 7.4.4).

The ageing of the population means retiree ranks, and their total super savings, will swell in the coming decades. By 2062-63, nearly one-infive Australians will be a retiree drawing down their super, compared to less than one in 10 today.421Treasury (2023a, p. 166). By that time, retirement-phase assets will total $2.3 trillion in today’s dollars, or 65 per cent of GDP.422Grattan analysis of Treasury (ibid, Chart 7.19).

Retirees are stressed, and don’t spend

Most people find retirement planning stressful, despite having enough savings for a comfortable retirement. Four-in-five pre-retirees find retirement planning complicated, and 40 per cent find it ‘very’ or ‘extremely’ complicated.423CHOICE (2020) and SCA (2020, p. 20). Well over half of Australians older than 50 report being worried about their retirement incomes.424NSA (2020, Figure 1). In a survey by CHOICE, 61 per cent of respondents said they didn’t believe their retirement would be financially stress-free.425CHOICE (2020).

Many retirees sit on their retirement savings rather than spend them as the system intended. In fact, many are actually net savers – their savings continue to grow for decades after they retire.

Grattan Institute analysis of the ABS Survey of Income and Housing shows that the generation of wealthier Australians who hit retirement in the early 2000s had, on average, maintained or increased their non-housing wealth through their retirement.426Coates et al (2025b, Figure 1.4). These findings are consistent with a range of other studies all showing that many retirees don’t draw down on their retirement savings.427See Coates and Nolan (2020, Section 1.6) and Callaghan et al (2020, pp. 432–438).

Super is too complex in retirement

Australia makes superannuation far too complex in retirement.

Most Australians go through their entire working lives without making any big decisions about their super, such as how much to contribute or how it’s invested.428They are automatically enrolled in a super fund when they start work, and they are compelled to contribute 11.5 per cent of their wages to that fund (rising to 12 per cent on 1 July 2025). Australians typically don’t choose their fund or investment strategy, but rather are allocated these via system defaults.

But once Australians retire, the system casts them adrift. While new retirees in many countries are automatically given – or otherwise strongly encouraged to choose – an income guaranteed to last their entire lives,429Coates et al (2025b, Appendix B). Australian retirees get little guidance about how to use their super (Figure 9.2).

Figure 9.2: Retirees get much less guidance than workers about super

Decision-making in Australia’s super system

Chart showing Figure 9.2: Retirees get much less guidance than workers about super
Source: Grattan adaptation of CEPAR (2020, Figure 1).

More than four in five retirees are steered into account-based pensions, which require retirees to cautiously manage their spending to avoid outliving their savings.430Coates et al (ibid, Figure 2.2). And half of those retirees who use an account-based pension draw their super at legislated minimum rates, which, if followed, leave 65 per cent of super balances unspent by average life expectancy.431Grattan Retirement Income Projector (see Coates and Nolan (2020)).

Australian retirees also have to navigate the means-tested Age Pension, which is subject to not one but two means tests – an assets test and an income test.432The test that produces the lower payment applies. In practice, most people are subject to the income test, with the assets test applying to people with more significant wealth: Callaghan et al (2020, pp. 51, 465).

Allowing super funds to give more financial advice, as the government plans to do, could help some retirees to better manage their super.433The government plans to adopt reforms to financial advice rules stemming from the 2023 Quality of Advice review (the ‘Levy review’), to free-up funds to provide more personal guidance. See Coates et al (2025b, p. 12). But it would be more effective – and less expensive – to simplify the choices that retirees face in the first place.

9.2 What we should do

9.2.1 Curb superannuation tax breaks

With the federal budget deep in structural deficit and big spending pressures looming (Chapter 2), curbing super tax breaks should be a priority.

The federal government has already put forward legislation that would tax the earnings on super balances bigger than $3 million at 30 per cent from 2025-26 (instead of 15 per cent currently).434Chalmers (2023). This is projected to affect about 80,000 people and trim earnings tax breaks for those with very high balances by about $2 billion a year once the policy is fully operational. The government should go further on this reform – the threshold should be lowered to $2 million.435Only about one in every 200 Australians has more than $2 million in super, yet they hold almost one-in-eight dollars in the super system. Australians with more than $2 million in super benefit from generous tax breaks on earnings that can easily exceed the Age Pension each year: Coates and Moloney (2023d, Figure 3.1).

But simply applying a higher earnings tax on very high balances is not enough. The next federal government should also:436All costings are from Coates and Moloney (ibid).

  • Raise Division 293 tax, which curbs tax breaks to high-income earners on their pre-tax super contributions. The tax should be increased from 30 per cent to 35 per cent, and the income threshold at which the tax applies should be lowered from $250,000 a year to $220,000 a year. This would save the budget about $1.1 billion a year and stop many high-income earners benefiting from larger tax breaks, per dollar contributed to their super, than low- and middle-income earners.
  • Lower the cap on pre-tax super contributions from $30,000 a year to $20,000 a year. This would save about $1.6 billion a year, mostly by reducing voluntary contributions made by older, wealthier Australians to minimise their income tax bills.
  • Abolish carry-forward provisions and government co-contributions, which were intended to encourage catch-up contributions but in fact facilitate tax minimisation for high-income couples. This would save about $1.1 billion a year.
  • Tax all superannuation earnings in retirement at 15 per cent – the same rate that applies to super earnings before retirement. Retirees would then pay some tax on their superannuation savings – the same as people working today – but still much less than younger workers pay on their wages. This reform would save more than $5.3 billion a year.

These changes, together with lowering the cap on limiting super tax breaks to $2 million, could save the federal budget more than $10 billion a year, and much more in future, without reducing the adequacy of retirement incomes.437Coates and Moloney (2023d, Figure 5.2). Low-income workers would continue to have a much higher living standard in retirement than they had while working, as would most middle-income earners. Higher-income earners’ expected replacement rates would be marginal lower.

9.2.2 Reform the process of allocating default super funds to new workers

The next federal government should adopt the Productivity Commission recommendation to reform the way default super funds are selected for new workers.438Productivity Commission (2018, Recommendation 2). A competitive wholesale process for selecting default super funds would put more pressure on funds to reduce fees and improve performance, which would boost Australians’ retirement incomes and reduce future Age Pension spending.439Callaghan et al (2020, Charts 2C-19 and 4A-26). Just a 0.5 percentage point increase in after-fee returns could boost replacement rates for the median earner by 4 percentage points, and just a 0.11 percentage point decrease in fees could reduce Age Pension expenditure by almost 0.1 per cent of GDP by 2060.

Under the Productivity Commission’s recommendation, new workforce entrants would be presented with a shortlist of 10 ‘best-in-show’ funds selected by independent experts (although people would retain the right to choose another fund). Such a mechanism would ensure new, disengaged members were allocated to a high-performing fund, and provide a benchmark for existing members looking to switch. Every four years, this panel would re-assess applications from funds to make the shortlist.

Fixing default fund selection has become even more urgent with the introduction of ‘stapling’, which ties members to their initial fund – decided through the industrial relations system – when they change jobs (unless they opt out). With stapling, the lucky few funds listed on awards for industries where people typically start their working lives will arbitrarily get much more business than the rest.440This has also introduced incentives for the other funds to try to undermine stapling and get people to open new accounts in their funds: Korporaal (2024). Government has an obligation to ensure that the super funds into which many Australians are now defaulted for life are among the best funds available.

9.2.3 Simplify super for retirees and give them the confidence to spend their savings

The next federal government should make three key reforms to simplify superannuation for retirees.441Coates et al (2025b).

First, retirees should be encouraged to use some of their super to buy an annuity from the government. Retirees should be encouraged to allocate 80 per cent of any super balance above $250,000 to purchase an annuity, with the rest to be drawn via an account-based pension that provides flexible access to capital. This would boost retirees’ incomes by up to 25 per cent compared to solely drawing on an account-based pension at legislated minimum rates. And it would ensure that the bulk of retirees’ incomes, irrespective of their super balances, would be guaranteed to last the rest of their lives.

Second, the government should establish a free service that ‘sumsthe-parts’ of the retirement incomes system for retirees (and people approaching retirement). This guidance service should aim to advise at least one-third of new retirees, and would cost about $360 million over its first four years and $50 million a year thereafter, which should be funded by a levy on super fund balances.

Third, in implementing the Productivity Commission’s ‘best-in-show’ recommendation, the government should ensure funds are also selected on their ability to provide efficient account-based pensions, and high-quality guidance and advice to retirees. Retirees should be steered towards these funds – as would new entrants to the workforce. Further, the performance test and comprehensive assessments of fund performance by APRA (i.e heatmaps) should be extended to account-based pensions. These reforms could boost the incomes of future retirees who continue to opt for an account-based pension by up to $70,000 over their retirement.

9.2.4 Include more home equity in the Age Pension assets test

Only the first $252,000 of home equity is counted in the Age Pension assets test.442This is the gap between the asset limit for homeowners vs. non-homeowners. Many Age Pension payments are made to households that have substantial property assets: almost 40 per cent of the government’s spending on the Age Pension goes to people with more than $750,000 in assets.443D. Wood et al (2023, p. 27). The test should be changed so that all the equity is counted above a generous threshold – for example $750,000. This would be fairer and could save the federal budget about $4 billion a year.444D. Wood et al (ibid, p. 28). A budget-neutral reform could involve pairing this with an alignment of the renter and homeowner asset-free areas. In principle, changes to the Age Pension asset test should also apply to the assets tests for other pensions, such as the Disability Support Pension and the Parenting Payment.

This change would reduce the unfairness of the current system that treats the assets of homeowners and renters very differently; an unfairness that compounds as house prices rise. It would encourage more retired homeowners to boost their retirement incomes by drawing on their home equity in retirement. And it would encourage a few more senior Australians to downsize to more appropriate housing, although financial considerations are not the biggest driver of retirees’ decisions to downsize their home.445Daley et al (2018b, p. 84), Valenzuela (2017), and Productivity Commission(2015).

No homeowning retirees would be forced to move. Affected retirees could top up their (lower) pension payments by using the Home Equity Access Scheme, which allows retirees to draw home equity up to a maximum of 150 per cent of the Age Pension. Payments are not taxable and don’t count towards the Age Pension income test. The outstanding debt accrues with annual interest of 3.95 per cent, which the government recovers when the property securing the loan is sold, or from the borrower’s estate.

9.2.5 Strengthen the social safety net for vulnerable retirees

JobSeeker, together with the Disability Support Pension, provides an important safety net for Australians who are unable to work until retirement age. Yet while the Age Pension and Disability Support Pension are indexed to wages, JobSeeker only increases in line with inflation. As recommended in Chapter 2, the maximum rate of JobSeeker should be increased by at least a further $60 a week, and JobSeeker should be indexed to wages growth.

As recommended in Chapter 5, the maximum rate of Rent Assistance should be increased by a further 50 per cent for singles and 40 per cent for couples. And it should be indexed to changes in rents for the cheapest 25 per cent of homes in capital cities (see Chapter 5 for details).

9.2.6 Re-evaluate the role of default insurance in superannuation

Australians spend about $10 billion each year in default income protection, life insurance, and total & permanent disability insurance via their superannuation fund.446Total premiums for death and disability insurance: ATO (2024, Super funds, table 1A). The federal government should adopt the Productivity Commission recommendation for a review of default insurance in superannuation.447Productivity Commission (2018, Recommendation 18).

Such an inquiry should evaluate whether members get value for money from insurance offered through superannuation, and whether insurance should continue to be offered on an opt-out basis. It should also consider alternative approaches, including providing default insurance cover outside of superannuation.

Bibliography

IN THIS CHAPTER

10 Integrity

10.1 Where we are

Australia’s institutions are a key determinant of our prosperity. They underpin our living standards, support and shape the economy, secure our rights and freedoms, and enable us to make collective decisions about the type of society we want to build.

Australia’s institutions are generally strong, out-performing many of our international peers. But globally, trust in institutions is declining. And Australians are particularly sceptical when it comes to vested-interest influence over public policy. Reforms since our previous Orange Book have made much-needed progress on transparency of political donations and strengthening appointments and grants processes, but there remains further room for improvement.

In order to maintain the trust and confidence of the Australian people, our institutions need to serve – and be seen to be serving – the public interest, not vested interests. And there are emerging risks for Australian democracy, including misinformation and the global retreat from democracy.

We should be proud of our institutions, but we cannot afford to be complacent.

10.1.1 Australia outperforms many of our peers on trust in government

Australia is around the middle of the international pack in terms of trust in government – we sit above the US and UK, but behind Canada, Sweden, the Netherlands, and Singapore.448Edelman (2025, p. 43). Australia’s international position on trust hasn’t shifted much in the past four years, while other countries such as France, Germany, and the UK have experienced substantial falls in trust over this period.

Australia is well-positioned, above the OECD average, on many dimensions of trust in government (Figure 10.1). For example, Australians generally trust that government will protect lives in an emergency, and that government takes decisions based on evidence. But Australians are more sceptical when it comes to potential misuse of public office for personal or political gain.

Figure 10.1: Australia is generally above average on trust, except when it comes to corporate influence

Share of the population who are confident in, or find a surveyed behaviour likely

Chart showing Figure 10.1: Australia is generally above average on trust, except when it comes to corporate influence
Source: OECD (2024b).

10.1.2 But trust is still low

While Australia performs well in comparative terms, in absolute terms, trust in government is still worryingly low. Less than half of Australians trust the government to ‘do what is right’,44947 per cent: Edelman (2025, p. 43). and 70 per cent think people in government look after themselves (Figure 10.2).450McAllister et al (2022). Only 17 per cent of Australians think the next generation will be better off.451Edelman (2025, p. 14).

Figure 10.2: Mistrust is high about who government serves

Proportion of survey respondents who agree with selected statements

Chart showing Figure 10.2: Mistrust is high about who government serves
Source: McAllister et al (2022).

Trust varies substantially across institutions in Australia. Australia’s electoral system is a particular strength, and has long garnered high trust and respect.452APSC (2024a). The latest report on trust in public services noted a decline in trust in the Australian Electoral Commission (AEC) relative to other services, though this reflects, at least in part, changes to the survey methodology. Threequarters of Australians still say they trust the AEC. Other highly trusted institutions include our emergency services, public health institutions, and our defence force.453APSC (2024b): more than 70 per cent of Australians express trust in these institutions. Political parties are among our least trusted institutions, only ahead of multinational corporations.45426 per cent of Australians express trust in political parties, and 23 per cent express trust in multinational corporations: APSC (ibid). O’Donnell et al (2024) also shows very low trust in traditional media (23 per cent) and social media companies (8 per cent), but this survey did not measure trust in political parties.

Trust is not a simple verdict on competency, it also relates to an institution’s visibility and public engagement. Institutions that deliver tangible services are typically more highly trusted. Survey respondents attribute their own low trust to a lack of transparency, and to institutions not listening and responding to people’s needs and concerns.455APSC (2024b). A lack of transparency was also a key driver of declining trust in government during the pandemic: Department of the Prime Minister and Cabinet (2024). See also Evans (2025).

Trust in institutions also turns on the sources of information that people rely on. It is harder for institutions to maintain trust when Australians increasingly receive information from dispersed sources online,456ACMA (2024). In particular, a rising share of people get their news from people they don’t know on social media, where it may be less accurate and more difficult to verify. and trust in traditional media is declining.457Edelman (2025).

10.1.3 Australia’s democratic institutions aren’t working for everyone

Australians need to be confident in the institutions that govern them, and that requires, at least in part, a sense of political agency.458OECD (2024b), and Evans (2025). Trust in government and satisfaction with democracy are typically lower among groups who are less well served by the status quo.459Sathanapally (2024).

Young people, people with less education, and people with greater financial concerns are all less trusting of government.460McAllister et al (2022) find lower trust among younger people. OECD (2024b) reports lower trust among people with less education and greater financial concerns, as does O’Donnell et al (2024). And satisfaction with democracy is typically lower among women, people on low incomes, the unemployed, and people who live in regional areas.461APSC (2024b). Social isolation, discrimination, and hardship are major drivers of dissatisfaction with democracy,462Ibid. as are perceptions of inequality.463Biddle (2024).

Migrants (with the exception of the large proportion of migrants who come from the UK) are typically more trusting than people born in Australia, which may reflect differences in culture, attitudes towards authority figures, and direct experience with other systems.464APSC (2024b).

10.1.4 Australians are concerned about vested-interest influence

Corporate and vested-interest influence stands out as a particular concern for Australia (Figure 10.1). More than half of Australians say government is run for a few big interests (Figure 10.2), and about half believe that corruption is a widespread issue in Australia’s democratic institutions and processes.465APSC (ibid).

Grattan Institute research shows that many well-resourced groups have too much say and too much sway over public policy. In particular, highly-regulated businesses – those that have the most to gain, or lose, from government decisions – have the most meetings with senior politicians, make the most use of commercial lobbyists, and are also disproportionately large donors to political parties. Many of these businesses have the resources to hire former politicians and advisers, and to woo politicians through hospitality.466D. Wood et al (2018).

Organised attempts to influence policy can benefit the few, at the expense of the many.467Ibid.

In healthy democracies such as Australia there are many safeguards to promote policy in the public interest, not least elections themselves. Yet several risk factors remain – including financial dependence, cosy relationships, and a lack of transparency in dealings between vested interests and parliamentarians – that leave Australia vulnerable to policy capture.

Gambling is one example of a powerful industry swaying policy in its favour at the expense of the public interest. The industry is hugely overrepresented in its access and influence compared to its contribution to the economy.468Ibid. And Australia’s policy settings to prevent gambling harm have remained weak, despite the powerful case for reform.469Sathanapally et al (2024).

10.2 What we should do

Government should be building and maintaining broad-based trust in our public institutions to do the right thing: to act on evidence and be transparent with decisions, to treat people fairly, to engage widely and not be swayed by vested interests, to always put the public interest first, and ultimately repay the trust of the Australian people through shared and inclusive prosperity.

Recommendations to support this agenda and strengthen Australia’s institutions are outlined in the following sections.

10.2.1 Reduce the influence of money in politics

Better and more timely information on political donations is needed as a public check on the influence of money in politics. The new Electoral Reform Bill, passed in February 2025, will substantially improve transparency of political donations when it comes into effect from 1 July 2026.

The Bill lowers the donations disclosure threshold from $16,900 to $5,000,470Parties will also need to disclose donations from a donor when they cumulatively reach the $5,000 threshold (within a calendar year), even if each donation is a smaller (below-threshold) amount. This closes a long-standing loophole in the disclosure rules. But another loophole remains: parties won’t need to disclose donations from the same donor to different party branches, as long as donations to each branch are below the threshold: see Tham (2025). and requires donations to be disclosed within seven days during an election period, and within two months at other times.471More precisely, within 21 days following the month the gift was received: Parliament of Australia (2025). Under the current system, it takes at least seven months and sometimes up to 19 months for a large federal donation to be made public. These long overdue reforms mean Australians will know who’s donating while policy issues – and elections – are still ‘live’.472Griffiths (2024a), and D. Wood et al (2018).

The Bill also introduces caps on donations and electoral expenditure. Capping electoral expenditure will help to reduce the fundraising ‘arms race’ between parties, and their subsequent reliance on major donors.473Griffiths et al (2020), and Griffiths and Chan (2023). Donations caps help to limit the influence that any single interest can hold over the national debate.

These are important reforms, but substantial issues remain with the current design. The total cap of $90 million for electoral expenditure by a political party is too high. And the per-seat cap of $800,000 is too low, advantaging incumbents over new entrants.474New entrants typically need to spend more to introduce themselves to their electorates. See also Tham (2025). A loophole in the design of the donations cap also advantages major parties by allowing the cap to apply separately to each branch of a party.475Ibid.

The next parliament should amend the legislation to close remaining loopholes and level the playing field for new entrants.

10.2.2 Improve checks and balances on decision-making

Improve transparency of lobbying activity

Lobbying is a normal and important part of the democratic ‘contest of ideas’. But some groups have a lot more access to decision makers than others,476D. Wood et al (2018). and therefore more opportunity to influence policy decisions.

Transparency around lobbying activity can help to level the playing field and protect the public interest by alerting under-represented groups to speak up, and encouraging policymakers to seek out a wider range of views. The goal of increasing transparency is not to deter advocacy but to underscore the responsibilities of public officials.477A 2024 Senate inquiry identified many deficiencies in the current system for regulating lobbying, including the lack of transparency, but ultimately deferred substantive recommendations to further review: Senate Standing Committees On Finance and Public Administration (2024).

Ministers should publish details of all meetings and events they attend in an official capacity, as well as those in which they are represented by ministerial staff. The published diary should identify who was present and the key issues discussed.478D. Wood et al (2018, pp. 57–58), and Griffiths (2024b).

The Australian Government Register of Lobbyists should also be expanded to include anyone with a lobbyist pass for Parliament House (the ‘orange pass’).479The register is currently limited to third-party lobbyists (who lobby for a client), excluding in-house lobbyists who lobby for themselves or their employer (including major businesses, unions, and peak bodies): D. Wood et al (2018, pp. 58–59) and Griffiths (2024b). Almost 2,000 orange passes are granted to people who require ‘significant and regular business access’ to politicians; which includes many of the most active commercial and in-house lobbyists.480The Senate Standing Committees On Finance and Public Administration (2024) reported there were 1,977 orange passholders. Expanding the register would give the public much better information about lobbying activity and bring some of the most active lobbyists under the Lobbying Code of Conduct.481For example, the Lobbying Code of Conduct requires lobbyists not to engage in corrupt conduct or mislead public officials: Attorney-General’s Department (2022). Passholders who breach the Code should have their pass suspended or withdrawn.

Improve processes for public appointments, grants, and taxpayer-funded advertising

Many Australians are suspicious that politicians misuse their power for political advantage. Appointing ‘mates’ to powerful or well-paid jobs, allocating grants based on electoral considerations rather than need (‘pork-barrelling’), and using taxpayer-funded advertising to spruik the government of the day are corrosive to public trust. Better processes for public appointments, grants, and taxpayer-funded advertising would help to safeguard the public interest from partisan influences.

The government has made important progress on cleaning up appointments processes, including to the Administrative Appeals Tribunal (now the Administrative Review Tribunal), which was more undermined by political appointments than any other institution.482Griffiths (2024c).

But good processes should apply to all public appointments. All public appointments should be advertised, an independent panel should do the shortlisting, and the minister should choose from the shortlist (or redefine and republish the selection criteria) but should not directly select any candidate not shortlisted.483See D. Wood et al (2022d).

Open and competitive grant processes are also needed to ensure value for public money and to reduce opportunities for politicised spending. But open, competitive grants are still rare – just 11 per cent of all grants by value in 2023-24.484GrantConnect (2024). While grant processes were recently strengthened,485Department of Finance (2024). open, competitive processes are still not required.

All grants should be allocated through an open, competitive, and merit-based assessment process, with limited circumstances defined for non-competitive processes (such as emergency grants to support communities after natural disasters).486See D. Wood et al (2022b). This would ensure taxpayers get better value for money, and would reduce opportunities for pork-barrelling.

Governments also routinely spend public money to spruik their own achievements, especially in the lead up to elections.487See D. Wood et al (2022c). Taxpayer-funded advertising campaigns should only be allowed where they are necessary to encourage specific actions or drive behaviour change. Campaigns that promote government policies or programs, without a strong call-to-action, should be blocked by an independent review panel.488The panel should assess all government advertising campaigns before launch. If the panel deems a campaign to be politicised, or otherwise not value for money, it should not run: see D. Wood et al (ibid). An Independent Communications Committee currently reviews proposed campaigns, but this is done mid-development (not as a final clearance), and the committee cannot block politicised campaigns: Department of Finance (2023).

Boost countervailing voices

Citizen engagement is a core responsibility of politicians and public servants. But it’s not easy. One way to get better, more inclusive policy debates is to embrace policy review processes that actively seek out a range of voices.

Various institutions and processes already facilitate this and could provide a guide, including the Productivity Commission inquiry process and Senate and House of Representatives committee hearing processes.489The Productivity Commission is also currently running a novel process of crowdsourcing ideas for productivity gains: Productivity Commission (2025c). More inclusive policy review processes can help to counter the prevailing skew in access and influence towards those with greater power and resources.490D. Wood et al (2018).

10.2.3 Prevent gambling harm

Australia has let the gambling industry run wild. Australians have the highest gambling losses in the world. It is all too easy to lose too much, and our communities are paying the price.491Sathanapally et al (2024). But the good news is that gambling harm is largely preventable with better regulation.

Gambling normalisation starts young, and sports betting advertising is a major culprit. The federal government should ban all gambling advertising and inducements,492Ibid (pp. 28–29). as recommended by the 2023 Murphy Inquiry with multi-partisan support.

For those who choose to gamble, mandatory pre-commitment with maximum loss limits would ensure people no longer lose more than they can afford. Gamblers would choose their limits in advance – before they lose track of time, start chasing losses, or are otherwise compromised in their decision-making – and the system would then enforce these limits, including regulated upper limits to prevent catastrophic losses. The federal government should establish a national pre-commitment system for online gambling, and should support state governments to introduce similar schemes for pokies.493Ibid (pp. 31–37).

10.2.4 Guard against cynicism and build on our shared values

Australia’s social cohesion is remarkably resilient and underpins our prosperity, but it is under pressure.494O’Donnell et al (2024). It should not be taken for granted or put at risk in the fray of political point-scoring.

Building on shared values, improving trust in institutions, and nurturing Australians’ sense of belonging, opportunity, fairness, and justice can all help to further strengthen our social cohesion. The recommendations in this chapter, and across the Orange Book, would strengthen Australia’s institutions to better serve the public interest and support Australians to make better collective decisions about what we want this country to be.

Bibliography

IN THIS CHAPTER