Who exactly are the winners and losers from policies announced on budget night? How many people are affected by changes to tax and other policies? Inevitably, it depends on what you earn, and own.
Today, we publish the Grattan Institute 2023 Budget cheat sheet, showing what Australians earn each year, and how much they own.
How much do Australians earn?
Download the income cheat sheet (PDF)
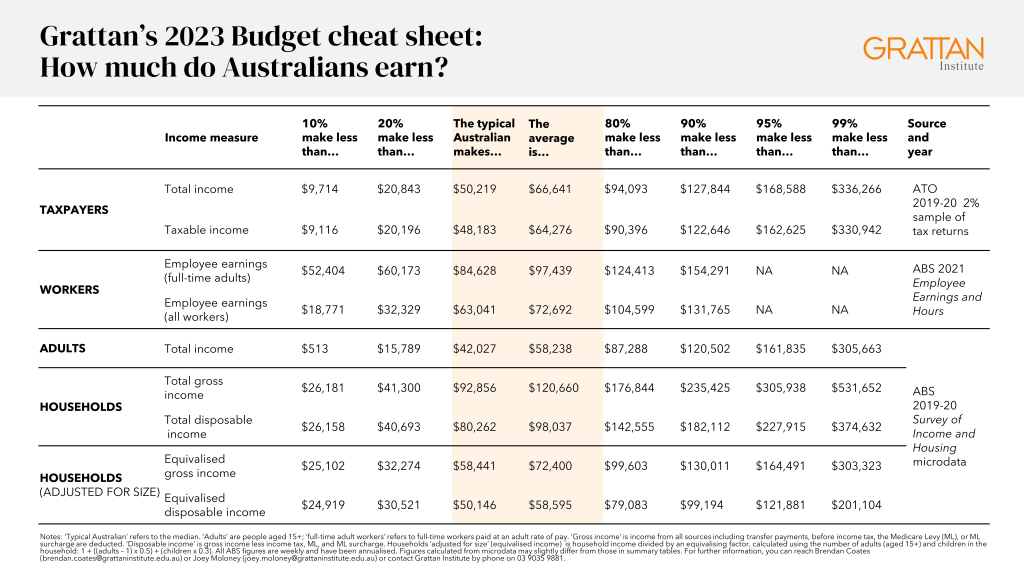
The typical Australian earns a lot less than average full-time earnings
When people look around for an earnings figure representing a typical person, they often quote average full-time earnings. But, as our cheat sheet shows, this figure is not a good guide to the typical Australian’s income.
More than three-quarters of Australian workers earn less than the average full-time wage of $97,439 a year. Most earn less than the average hourly wage, and many work only part-time. The typical full-time Australian worker actually earns $84,628, and the typical Australian worker (including part-time workers) earns just $63,041.
And about one-third of Australian adults are not in paid work because they are retired, living with a disability, caring for others, or unemployed. So the typical adult’s income (from all sources) is less again, at $42,027.
The personal income tax scales are a poor guide
The tax scales are a poor guide to the distribution of income in Australia. The top tax bracket kicks in at $180,000 a year (rising to $200,000 from 1 July next year) and is often cited as shorthand for high income. Just 3.8 per cent of taxpayers had a taxable income that high in 2019-20. And only 25 per cent had a taxable income higher than $80,000 a year. So a taxpayer with an annual income of $80,000 is in the top quarter of Australian taxpayers.
Taxable income also misses people who do not file a tax return, such as wealthy retirees who are drawing on tax-free superannuation, and, at the other end of the scale, people on income support whose incomes are so low that they don’t submit a personal tax return.
Most people pool income in their households
An individual’s income can be a poor measure of their actual economic circumstances. For example, many people on low incomes have spouses on high incomes. Measuring household income can cut through this, but it comes with a wrinkle: the number of people in the household needs to be taken into account, because larger households share resources, so can get by with less money per person.
The Australian Bureau of Statistics makes this adjustment and reports what it calls equivalised household income. In 2019-20, the typical Australian household reported disposable income of $80,262, but after adjusting for household size, this fell to just $50,146.
How much do Australians own?
Download the wealth cheat sheet (PDF)
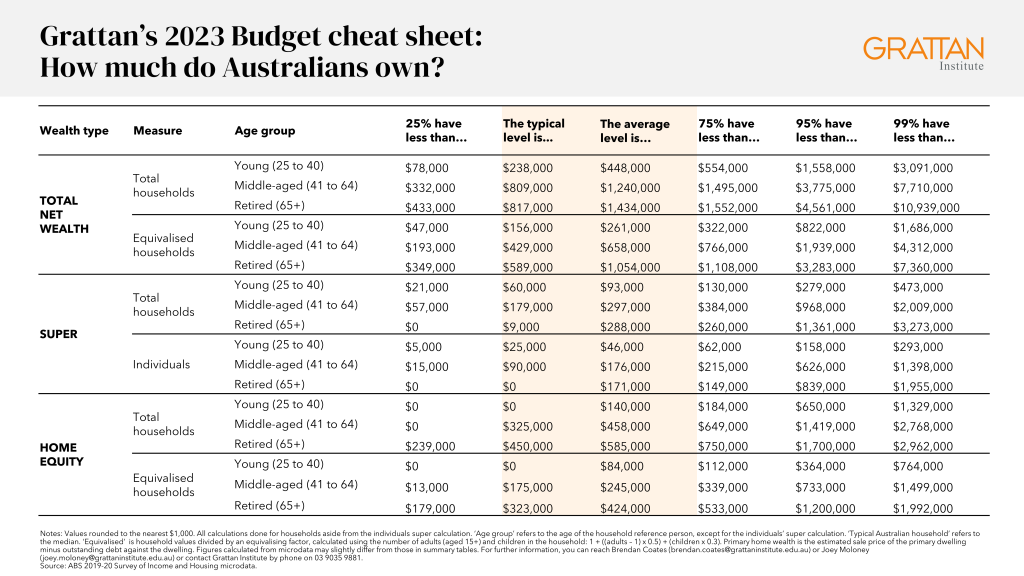
How much income someone brings in each year matters, but so does what they own.
A lot of Australian households have their wealth concentrated in their home and their superannuation. And the ABS also counts the value of vehicles, home contents, and the like.
We accumulate wealth as we age
Someone’s wealth depends on what they earn, but also their age, since we accumulate savings over time. For example, the typical total net wealth (i.e. net of any outstanding debts) of a middle-aged household (aged 41 to 64) of $801,000 is well over three times that of a young household (25 to 40) at $233,000.
But this measure does not tell us how many adults and children the pot of wealth belongs to. As with income, ‘equivalising’ wealth gives us a better picture, and sees net wealth fall to $425,000 for a middle-aged household – which is probably a larger household – and $153,000 for a young household.
The typical retiree today has no super
Perhaps surprisingly, the typical retiree in Australia today has no superannuation, and instead relies largely on the Age Pension. The typical retired household has only about $5,000 in super. Nonetheless, retirees tend to report low levels of financial stress (provided they own their own home).
The fact that super is highly unequally distributed among current retirees means that reforms to rein in tax breaks on super earnings really only affect wealthier Australians who are already enjoying comfortable retirements.
Home ownership is skewed towards the old
While the typical retiree household has little super, they tend to hold substantial wealth in their home, because they bought it long ago, at a time of much lower prices – and they have probably paid off their mortgage.
The vast majority of this wealth is excluded from the Age Pension assets test, which is unfair on pensioners who rent and on taxpayers who end up underwriting future inheritances. Grattan Institute recommends that all home equity above $750,000 be included in the pension assets test. As our cheat sheet shows, this would affect at most a quarter of retirees, and probably a lot less.
The wealth estimates and estimates using ATO income data have been updated since publication. Previously the middle of the percentile was taken. This has been updated to the top of the percentile. Aside from the top percentiles, the difference is marginal.
Brendan Coates
Joey Moloney
While you’re here…
Grattan Institute is an independent not-for-profit think tank. We don’t take money from political parties or vested interests. Yet we believe in free access to information. All our research is available online, so that more people can benefit from our work.
Which is why we rely on donations from readers like you, so that we can continue our nation-changing research without fear or favour. Your support enables Grattan to improve the lives of all Australians.
Donate now.
Danielle Wood – CEO
