Budgets are all about the dollars and cents – they’re the result of hundreds of decisions about how the government will tax and spend. But how many people will be affected by these policy decisions? To answer this question, we need to understand what Australians actually earn and own.
Grattan Institute’s 2026 Budget cheat sheet shows what Australians earn each year, and how much they own.
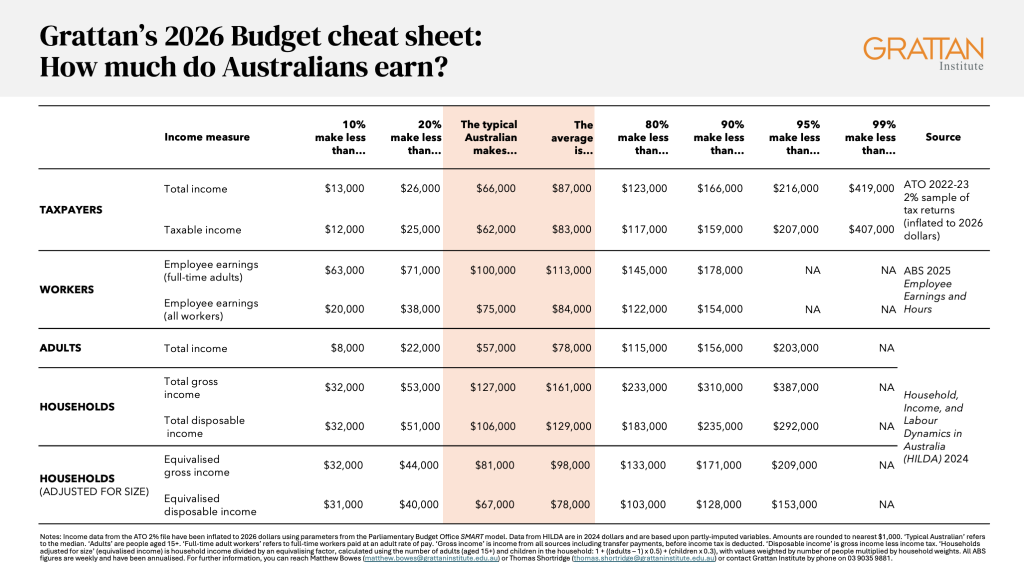
The typical Australian earns a lot less than average full-time earnings
When people look around for an earnings figure representing a typical person, they often quote average full-time earnings. But, as our cheat sheet shows, this figure is not a good guide to the typical Australian’s income.
More than three-quarters of Australian workers earn less than the average full-time wage of $113,000 a year. Most earn less than the average hourly wage, and many work only part-time. The typical full-time Australian worker actually earns $100,000, and the typical Australian worker (including part-time workers) earns just $75,000.
And about one-third of Australian adults are not in paid work because they are retired, have a disability, care for others, or are unemployed. So, the typical adult’s income (from all sources) is less again, at $57,000.
These averages also obscure differences between women’s and men’s earnings. The typical female worker earns $65,000, compared to $87,000 for the typical male worker. This is because women are paid less per hour worked, and because more women work part-time: about two in five female workers are part-time, compared to just one in five male workers.
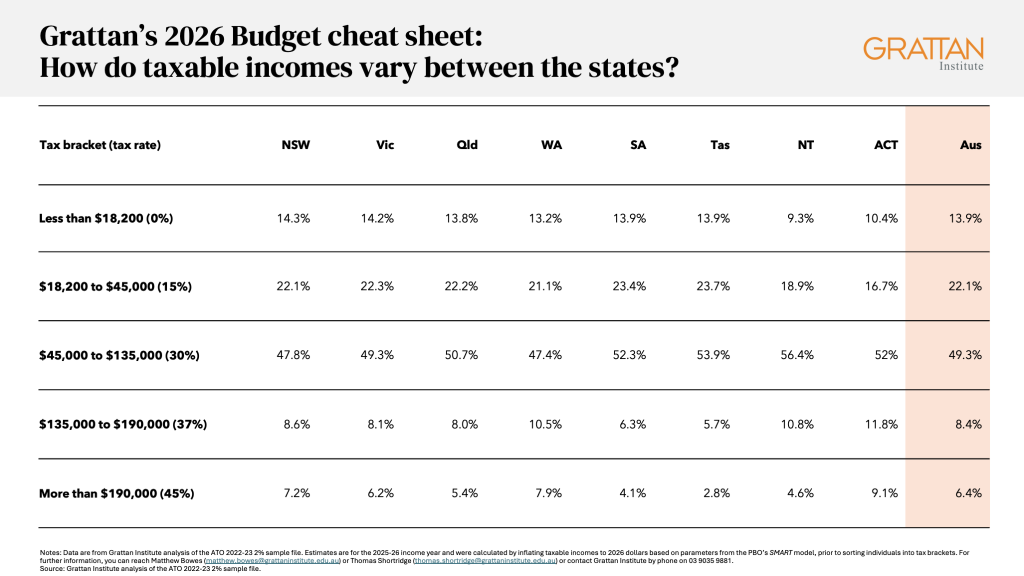
The personal income tax scales are a poor guide
The tax scales are a poor guide to the distribution of income in Australia. The top tax bracket kicks in at $190,000 a year and is often cited as shorthand for high income. But we estimate that in 2026, just 6.4 per cent of taxpayers have a taxable income that high.
Taxable income also misses people who do not file a tax return, such as wealthy retirees who are drawing on tax-free superannuation. And, at the other end of the scale, many people on income support have incomes so low that they don’t submit a personal tax return.
Most people pool income in their households
An individual’s income is a partial measure of their economic circumstances. For example, a person on a low income may have a spouse on a high income. Measuring household income can cut through this, but it comes with some wrinkles: the number of people in the household needs to be considered, because larger households need more income to guarantee everyone in it a given standard of living. Further complicating things is that household members share resources, so a couple household, for example, doesn’t need twice the income of a single-person household to have the same standard of living.
Statisticians often make this adjustment and report what is called equivalised household income. When we run this analysis, we find that the typical Australian household has disposable income (income after tax) of $106,000, but that this falls to just $67,000 after adjusting to take account of the number of people in the household.
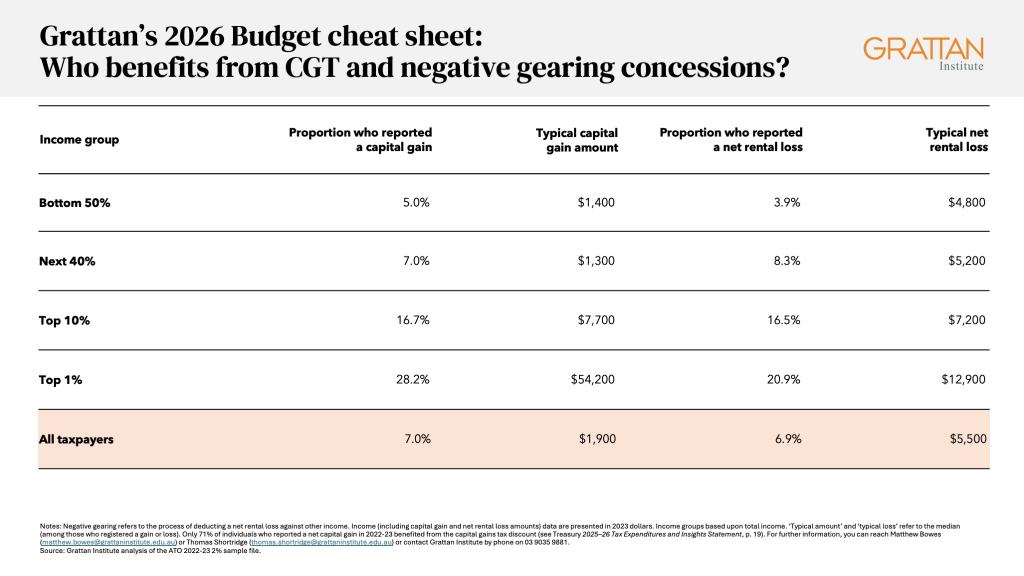
Capital gains and negative gearing policy disproportionately benefit high-income earners
In 2023 – the most recent year with data available – about 7 per cent of all taxpayers reported a capital gain. But this rose to 16.7 per cent among taxpayers in the top 10 per cent of income earners, and 28.2 per cent among taxpayers in the top 1 per cent of income earners – more than four times the share among all taxpayers. And the typical capital gain amount was far larger at the top: $54,200 for the top 1 per cent compared to $1,900 for the typical taxpayer.
The capital gains tax discount means that individuals pay tax on only half of any capital gain for assets held for more than 12 months, so higher-income taxpayers (who face the highest marginal rates) get the biggest tax saving on these gains.
The pattern for negative gearing – the practice of deducting a rental loss against other income – is similar: nearly 17 per cent of those in the top 10 per cent of incomes reported a net rental loss. This compares to just 7 per cent of all taxpayers.
Winding back these tax concessions as Grattan has previously recommended could raise more than the $11 billion each year in revenue, freeing up funds to improve the budget bottom line or invest in other tax reform and spending priorities.
Wealth matters too
How much income someone brings in each year matters, but so does what they own.
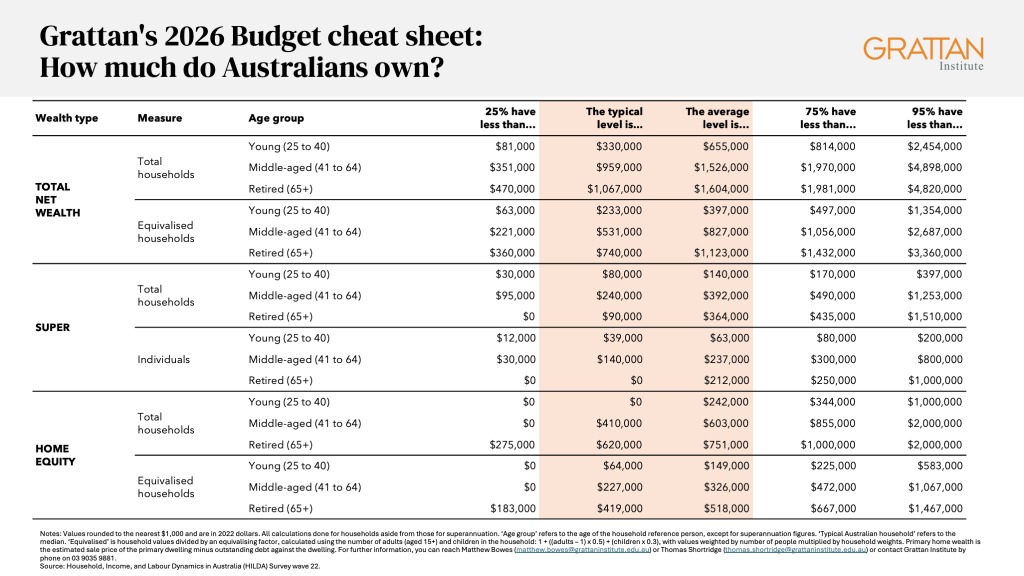
A lot of Australian households have their wealth concentrated in their home and their superannuation.
We accumulate wealth as we age
Someone’s wealth depends on what they earn, but also their age, since we accumulate savings over time. For example, the typical total net wealth (i.e. net of any outstanding debts) of a middle-aged household (aged 41 to 64) is $959,000 – nearly triple that of a young household (25 to 40) at $330,000.
But this measure does not tell us how many adults and children the pot of wealth belongs to. As with income, ‘equivalising’ wealth gives us a better picture. After adjusting to take account of the number of people in the household, net wealth falls to $531,000 for a middle-aged household – which is probably a larger household – and $233,000 for a young household.
The typical Australian retiree has no super
Perhaps surprisingly, the typical retiree in Australia today has no superannuation, and instead relies largely on the Age Pension. The typical retired household has only about $90,000 in super. Nonetheless, retirees tend to report low levels of financial stress (provided they own their own home).
The fact that super is highly unequally distributed among current retirees means that reforms to rein in tax breaks on super earnings generally only affect wealthier Australians who are already enjoying comfortable retirements.
Good data doesn’t always come easy
Figuring out what Australians earn and own isn’t always straightforward. Data on non-taxable sources of income, and many kinds of household wealth, are only available from surveys of the Australian public. Because these estimates are based upon survey data, they are inherently somewhat uncertain. And because surveys and other data sources take a while to prepare, the most recent data available are often several years old.
In this 2026 edition of our Budget cheat sheet, we’ve made a few updates to help readers understand this data better.
First, our 2026 cheat sheet uses data from the 2022 and 2024 Household Income and Labour Dynamics in Australia (HILDA) surveys, which interview more than 17,000 people each year.1This document uses unit record data from Household, Income, and Labour Dynamics in Australia Survey (HILDA) conducted by the Australian Government Department of Social Services (DSS). The findings and views reported, however, are those of the authors and should not be attributed to the Australian Government, DSS, or any of DSS’ contractors or partners. Past versions of this budget cheat sheet have used the Survey of Income and Housing (SIH) to estimate the incomes and wealth of Australian households. But this survey hasn’t been updated since 2019-20, and the next version won’t be released until 2027.
Because HILDA has been updated more recently than the SIH, the income and wealth figures shown here are larger than those from our 2025 sheet, reflecting growth in incomes and assets over time.
Second, we’re now reporting estimates of taxable incomes for the current 2025-26 income year. This accounts for average expected income growth between the latest 2022-23 ATO data on taxable incomes, and the current year.
Due to the difficulty of estimating the growth in household incomes and wealth over time, we have chosen to present the 2022 and 2024 HILDA survey data in their original form. This means the current values for some of these figures may be higher, due to income and asset price growth over the intervening period. For similar reasons, we have also chosen to present figures for average capital gains and net rental losses in their original form.
See previous editions:
Grattan Institute’s 2025 Budget cheat sheet
Grattan Institute’s 2024 Budget cheat sheet
Grattan Institute’s 2023 Budget cheat sheet
Grattan Institute’s 2022 Budget cheat sheet
Footnotes
[1] This document uses unit record data from Household, Income, and Labour Dynamics in Australia Survey (HILDA) conducted by the Australian Government Department of Social Services (DSS). The findings and views reported, however, are those of the authors and should not be attributed to the Australian Government, DSS, or any of DSS’ contractors or partners.