Summary
Each year, community pharmacies dispense millions of scripts, give millions of vaccinations, and offer expert advice to most Australians, costing the federal government and patients almost $4 billion a year.
Pharmacy policy is too important to be controlled by a powerful lobby group. But the Pharmacy Guild of Australia, which represents most pharmacy owners, is calling the shots.
The Guild negotiates funding and policy directly with the federal government. Unlike almost any other country, Australia’s negotiations include no one else, and are based on almost no public evidence.
Bad governance has led to bad deals – unless you own a pharmacy. Profits have surged, while patients miss out on cheaper medicines and choices about where to get them, and taxpayers pay too much.
Dispensing fees are probably too high, and some payments aren’t justified at all. If the number of scripts falls below a predicted level, government has to pay up anyway, as if the predicted level was met.
Unique regulatory protections dictate who can own pharmacies and where they can be set up. For most scripts, discounts are being banned or discouraged by financial penalties. Meanwhile, a discretionary surcharge is allowed on many scripts. All these rules choke off competition that would improve choice, increase opening hours, and cut prices.
Skilled and trusted pharmacists should provide more types of care. But medicine checks and dose administration aids are poorly targeted or overpriced, prompting blunt caps on their growth. For new services, dozens of trials have been too weak to prove they are cost-effective, leaving the sector in a purgatory of fragmented state programs.
Pharmacy policy is a shakedown that needs a shakeup. Five reforms can get better value for patients and taxpayers.
First, no more backroom deals. Negotiations should be replaced by independent decisions, as happens for other types of healthcare.
If the federal government won’t do that, at a minimum patients and pharmacists should be at the table, and there should be clear public evidence to justify decisions.
Second, dispensing fees should be streamlined and reset. Unjustified fees should be scrapped. Fees should be set independently, based on cost not bargaining. A fee for stocking high-cost medicines should be redesigned to work better, and save up to $285 million a year.
Third, rules on pharmacy location and ownership should be removed immediately, and restrictions on discounts should be phased out.
Fourth, services must deliver value for money. The criteria for MedsChecks should be tighter and administration aids should be repriced. Pharmacists should be able to prescribe for urinary tract infection, but other services must wait for decisive evidence from national trials on the most cost-effective options.
Finally, the federal government should fund pharmacists in GP clinics, where evidence shows that their expertise can improve care.
Fairer fees and competition will change the sector. Some pharmacies may struggle, especially in rural areas. Some companies could dominate and raise prices or cut quality. But safeguards can prevent these risks: targeted financial support, scrutiny from the competition watchdog, and a better system to measure pharmacy quality.
Replacing bargaining with evidence, and protectionism with competition, will give patients lower prices and more choice, and taxpayers better value, while keeping pharmacies the accessible and trusted service Australians rely on.
Recommendations
Recommendation 1
Restore independent community pharmacy policy
- End Community Pharmacy Agreements.
- If the federal government will not do this, include pharmacists and patients in the agreements, and base them on public evidence.
Recommendation 2
Make dispensing fees simpler and fairer
- Expand and speed up price disclosure price cuts.
- Pay pharmacies sooner for very high-cost medicines.
- Automate the Safety Net recording process.
- Remove unjustified fees: the Safety Net recording fee, discretionary patient charges, and fees for 60-day dispensing.
Recommendation 3
Base pharmacy funding on cost and reasonable profits
- Make the Independent Health and Aged Care Pricing Authority (IHACPA) responsible for determining pharmacy remuneration, with pharmacies required to provide necessary data.
- Replace payment adjustment and the regional allowance with monitoring of pharmacy viability, targeted support, and reverse auctions in areas without a pharmacy.
Recommendation 4
End unfair protections and unleash competition
- Remove restrictions on where new pharmacies can be established, including allowing pharmacies in supermarkets.
- Remove restrictions on who can own pharmacies and how many they can own.
- Allow pharmacies to discount all medicines.
Recommendation 5
Safeguard competition and quality
- Direct the ACCC to do a market study of the community pharmacy sector and design appropriate safeguards to protect competition.
- Implement an independent quality and outcomes monitoring framework.
Recommendation 6
Ensure pharmacy services are good value
- Replace arbitrary caps on MedsChecks with tighter eligibility and information-sharing requirements.
- Reset pricing for dose administration aids to reflect increas-ing automation, and then remove caps.
- Fund pharmacist prescribing for urinary tract infections. Fund rigorous national trials of prescribing for other minor ailments, smoking cessation, and collaborative chronic disease management.
- Invest $80 million in pharmacists in general practice and Aboriginal Community Controlled Health Organisations.
1 Essential services are being held hostage
Community pharmacies perform vital services for Australians – dispensing medicines, advising patients, and providing one of the most accessible touchpoints in the health system. Governments and patients spend billions of dollars every year for these services, and they deserve good value.
But for decades, the Pharmacy Guild of Australia – one of the country’s most powerful lobby groups – has shaped pharmacy policy to protect the interests of pharmacy owners, blocking reforms that would deliver better value to taxpayers and patients.
1.1 Pharmacies are a critical part of our health system
The government subsidises prescription medicines and pays pharmacists – the main health professionals in Australia allowed to dispense medicines – to supply them to patients and provide advice.1Approved doctors practising in isolated areas without access to a pharmacy are also allowed to dispense medicines: Department of Health, Disability, and Ageing (2024a). Pharmacies are essential to access to and safe use of prescription medicines.
In 2024-25, there were more than 6,000 community pharmacies in Australia, and they dispensed 335 million prescriptions under the Pharmaceutical Benefits Scheme (PBS) and Repatriation PBS (a dedicated scheme for veterans).2Department of Health, Disability, and Ageing (2026a, Tables 2a, 2c and 13). Community pharmacy refers to any pharmacy that dispenses medicines to the general public. It does not refer to a specific kind of ownership or operating model. The other kind of pharmacies are hospital pharmacies, which dispense medicines to patients in hospital. In this report we refer to the PBS and RPBS together as the PBS. Community pharmacies provide the most common touchpoint that people have with the healthcare system.
On average, each Australian visits a community pharmacy 18 times a year.3See Pharmaceutical Society of Australia (2024). By comparison, Australians visit a GP on average six times a year: AIHW (2026a).
Pharmacists are highly skilled health professionals with expert knowledge of medicines. In the community setting, they dispense medicines, counsel patients on how to take them safely, and flag medicine interactions and prescribing errors. They also provide informal health advice and increasingly deliver clinical services, such as vaccinations.
Community pharmacists are among the most accessible health professionals in Australia, and patients can seek their advice without an appointment.
Each year, pharmacies receive about $3.8 billion for dispensing medicines and professional services.4This figure includes total spending on pharmacy remuneration and professional programs in 2025 dollars: Department of Health, Disability, and Ageing and Pharmacy Guild of Australia (2024, Table 19). See Chapter 4 and Chapter 8 for more detail. Taxpayers and patients need to be confident they are getting good service, and good value, from this spending.
1.2 Pharmacy policy is dominated by the Guild
The Pharmacy Guild of Australia (the Guild) is the peak body representing community pharmacy owners (Box 1). It is also one of the most powerful lobby groups in the country.
Its political influence is partly financial, thanks to its significant political donations to successive governments on both sides of politics.5Grattan analysis of AEC (2026). See Box 1.
Box 1: The Pharmacy Guild of Australia
Established in 1927, the Pharmacy Guild is the peak body representing community pharmacy owners in Australia. In 2023, it had 4,154 member pharmacies – about 70 per cent of community pharmacies.aDepartment of Health, Disability, and Ageing (2024b, p. 5). It doesn’t include any Chemist Warehouse stores, which together account for about 9 per cent of all pharmacies and probably a larger share of the market.bDepartment of Health, Disability, and Ageing (ibid, p. 5), ACCC (2024, Table 1).
The Guild and Chemist Warehouse disagree on key pharmacy policies, including location rules and discounting restrictions: Gance (2017). The Guild is also a powerful lobby group. In the past five years, it has donated $2.5 million to political parties.cFigure includes donations from 2020-21 to 2024-25 and has been inflated to March 2026 dollars using the Consumer Price Index: AEC (2026). This makes it the largest donor from the healthcare sector over that period, and the 15th largest overall – larger than the Minerals Council of Australia.dGrattan analysis of AEC (ibid). Over that same period, the Minerals Council donated $2.2 million (March 2026 dollars). Over the past four years, the Guild has also spent $16.3 million on public campaigns.eFigure includes spending from 2021-22 to 2024-25 and has been inflated to March 2026 dollars using the Consumer Price Index: Pharmacy Guild of Australia (2025a) and Pharmacy Guild of Australia (2023a).
This political spending is funded in part by membership fees, and in part by the Guild’s wholly owned insurance and professional services firm. This firm – Guild Group – has generated $71 million in profits and has paid $51 million in dividends to the Guild over the past three years.fFigures have been inflated to March 2026 dollars using the Consumer Price Index: Guild Group (2025, p. 9), Guild Group (2024, p. 9), Pharmacy Guild of Australia (2025a, p. 34), and Pharmacy Guild of Australia (2023a, p. 34).
But the main source of the Guild’s power is its ability and willingness to weaponise a highly valued part of the healthcare system. Pharmacists are among the most trusted professionals in Australia.6In a survey of 1,267 Australians, 76 per cent rated pharmacists ‘high’ or ‘very high’ for their ‘ethics and honesty’, behind only nurses and doctors: Roy Morgan (2021, p. 2). The Guild has repeatedly leveraged this trust to mobilise patients against reforms that would, in many cases, benefit patients directly. This generally involves claiming that any such reform would put their local pharmacy out of business.
Table 1.1 summarises instances when the Guild has successfully blocked or watered down reform over the past three decades. Box 2 provides more detail on the most recent example: the scare campaign against 60-day dispensing.
Table 1.1: The Guild has a track record of blocking reform
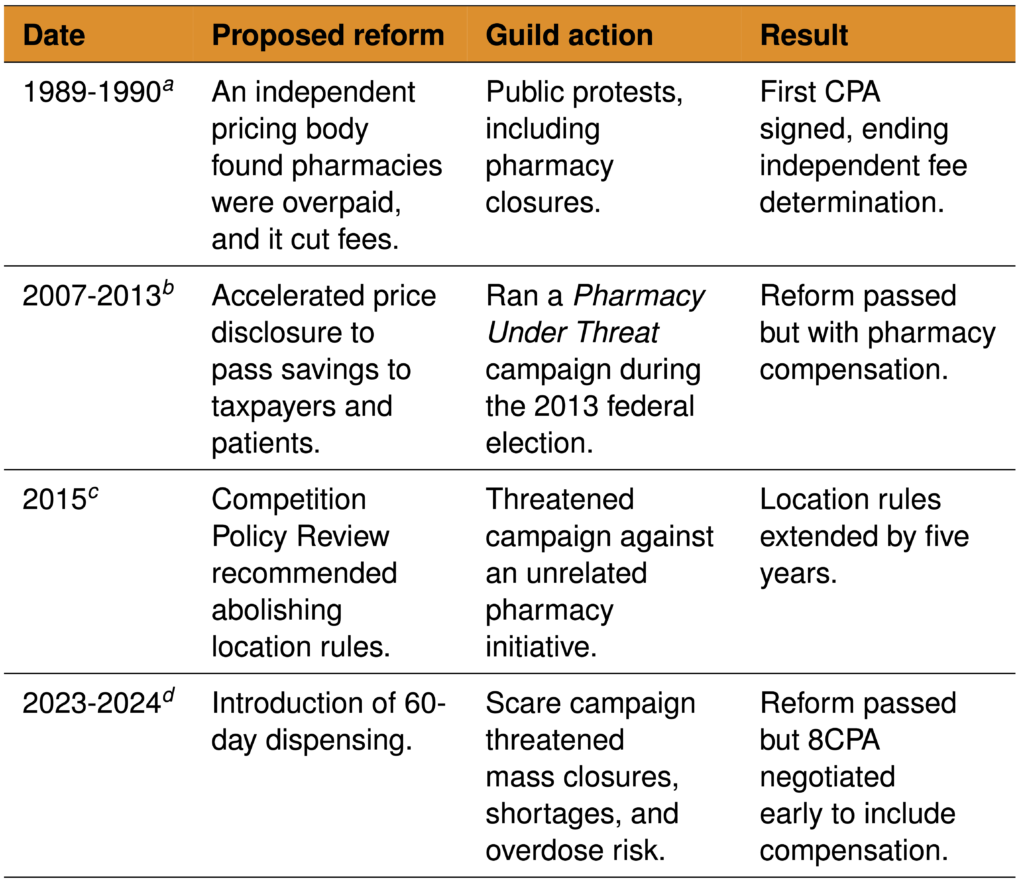
Notes: CPA = Community Pharmacy Agreement.
a. Department of Health, Disability, and Ageing (2024b, p. 6).
b. See McInerney (2013), Clarke (2015), and ANAO (2015). To compensate pharmacies, the sixth Community Pharmacy Agreement partially delinked pharmacy fees from medicine prices: Ley (2015).
c. See Recommendation 14 of Harper et al (2015). The Guild threatened to launch a campaign against the proposal to allow pharmacies to discount over co-payment PBS medicines by $1 and only pulled back when the location rules were extended: Hurst (2015).
d. See Box 2.
The Guild has ensured that the evidence base needed to challenge its claims does not exist. Its ongoing refusal to provide pharmacy cost data has meant that no comprehensive costing study has been conducted since 1989 – almost four decades ago.7In 1989, the Pharmaceutical Benefits Remuneration Tribunal (PBRT) evaluated pharmacy cost data: ANAO (2015, p. 25). During the 2017 Review of Community Pharmacy Remuneration and Regulation (the King Review) – which the Guild agreed to support – it discouraged members from participating in a financial survey, citing methodological concerns: King et al (2017a, pp. 70-71) and Pharmacy Guild of Australia (2017a, p. 5). Today, the Guild requires researchers to obtain its endorsement before members are advised to participate in any research: Pharmacy Guild of Australia (n.d.[a]). Without cost data being public, the Guild can maintain the impression that the sector is perpetually on a knife’s edge, making claims of catastrophic harm from reform impossible to test or refute.
Box 2: The 60-day dispensing scare campaign
Most medicines in Australia are dispensed for 30 days at a time. But in April 2023, Health Minister Mark Butler announced that more than 300 medicines for stable, chronic conditions would become eligible for 60-day dispensing, to be rolled out in stages from later that year.aButler (2023a).
This change would lead to significant savings for patients – halving the dispensing fees for these medicines – and bring Australia in line with countries including New Zealand, the UK, France, and Canada that had already offered 60- or 90-day dispensing.bButler (2023b) and Af Geijerstam et al (2024).
The Guild opposed the change. Pharmacies would earn less from dispensing and lose retail revenue from reduced foot traffic. The Guild claimed this would result in mass pharmacy closures, commissioning modelling that projected up to 665 would shut within four years.cErgas (2023, Table E-3). This modelling used government uptake projections only for its minimum scenario. The central scenario – from which headline findings were drawn – and the maximum scenario both assumed uptake 24-to-78 per cent higher than government projections in each year: Ergas (2023, Table 4-1) and Department of Health, Disability, and Ageing (2023a, p. 26). As it turned out, even the government’s assumptions were too high: Breadon and Hu (2025).
The Guild warned of medicine shortages, with president Trent Twomey declaring he didn’t want to see ‘a Hunger Games stand-off in any community in Australia where some patients get double the medicine they need, while others get nothing’.dPharmacy Guild of Australia (2023b). It also argued that larger medicine quantities in homes would increase the risk of accidental overdose by children. Both claims were widely disputed, and there are no reports of such problems in countries with 60- or 90-day dispensing.eButler (2023c), RMIT ABC Fact Check (2023), and Af Geijerstam et al (2024).
Through billboards, television, radio, social media, phone calls, and encouraging direct conversations at the counter, the Guild tried to convince Australians that their local pharmacy would close and they would lose access to their medicines.fChrysanthos (2023), McKenzie (2023), and Scholefield (2023).
The government held firm. Stage one proceeded in September 2023. The Guild suspended its campaign soon after, having secured an agreement to bring forward negotiations for the eighth Community Pharmacy Agreement. That agreement began in July 2024 – a year earlier than planned – and included new payments that excessively compensate pharmacies for lost dispensing revenue (see Chapter 3).
In December 2024, stakeholders who opposed the Guild reportedly received a Christmas package from the Guild: a voodoo doll of Trent Twomey, some pins, and a packet of Glucogel jelly beans.gAs reported in The Australian Financial Review: Robin (2024).
There have been no reports of medicine shortages or overdoses from 60-day dispensing.hOne year after implementation, Payne (2024) found no evidence of negative outcomes, though analysis was constrained by data limitations. Meanwhile, the reform has delivered huge savings: in 2025 alone, patients saved $222 million and the government $252 million.iGrattan analysis using the methodology outlined in Breadon and Hu (2025), for medicines in stage 1, 2, and 3 of the 60-day dispensing rollout.
1.3 Pharmacies seem to be getting a sweet deal
Thanks to its decades of political influence, the Guild has secured the best of both worlds. Pharmacies earn growing profits while guaranteed government income insulates them from revenue declines. In effect, they profit as private businesses while shifting financial risk to taxpayers.
Pharmacy income extends well beyond PBS dispensing. Retail and over-the-counter medicine sales comprise about 30 per cent of the average Guild pharmacy’s revenue, rising to about 67 per cent for Chemist Warehouse stores.8Pharmacy Guild of Australia (2026a, Table 1) and Sigma Healthcare (2023, p. 22).
Pharmacies also earn revenue from private prescriptions. These are medicines not listed on the PBS for which patients pay the full cost with no government subsidy.9Department of Health, Disability, and Ageing (2024c). Unlike PBS prices, private prescription prices are entirely unregulated, meaning pharmacists can charge whatever they like. Two categories of medicine have turbocharged this revenue stream in recent years (Box 3).
The available evidence on pharmacy finances – limited as it is – suggests a highly profitable sector. Guild survey data suggest that average pharmacy profits have more than doubled over the past decade (Figure 1.1). This excludes Chemist Warehouse stores, but their rich valuation and surging sales suggest they’re not struggling either.10Smith (2025) and Sigma Healthcare (2025, p. 4).
Pharmacy discounting could also be a sign of profitability. Pharmacies often discount medicines to win customers, surrendering 17 per cent of their remuneration on average (see Chapter 6).11Grattan analysis of Department of Health, Disability, and Ageing (2026b) and Department of Health, Disability, and Ageing (2026c). Pharmacies may offer discounts to attract patients who then spend more on retail goods.
Figure 1.1: Pharmacy profit is increasing
Average profit (before tax) of Australian community pharmacies, adjusted for inflation
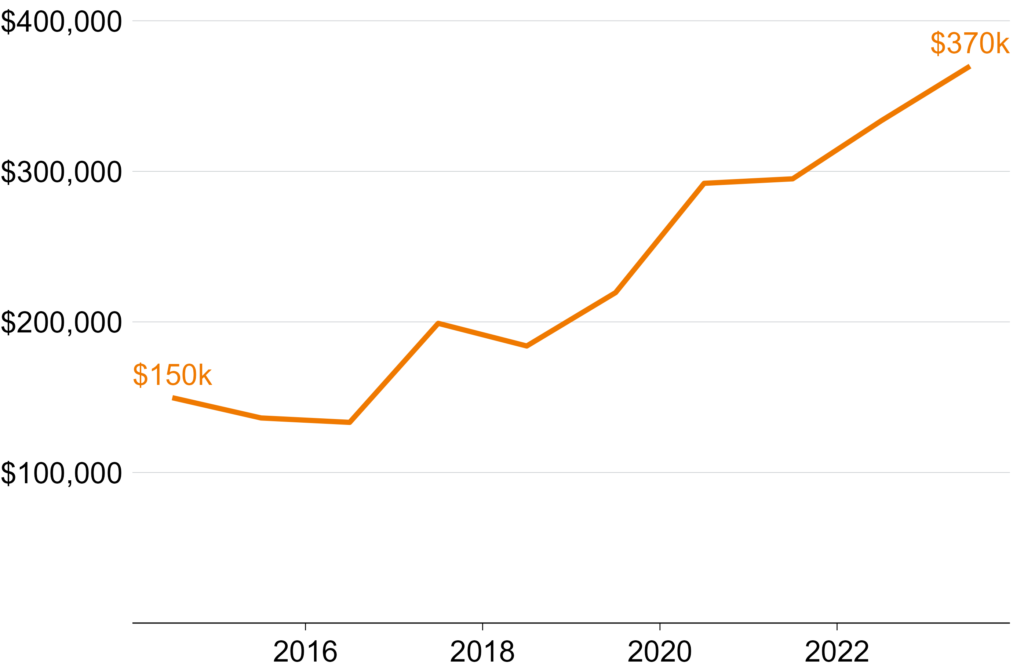
Notes: Net profit is total revenue minus total expenses, cost of goods sold, and notional proprietor’s salary. Data from the Guild Digest, an annual survey of 300-to-600 pharmacies that is weighted to represent the Australian community pharmacy sector. Years refer to financial year (e.g. 2023-24 is shown as 2024). Values have been inflated to March 2026 dollars using Consumer Price Index: ABS (2026a). Sources: 2015 to 2025 Guild Digests, available at Pharmacy Guild of Australia (n.d.[b]).
1.4 What this report is about
It’s clear that pharmacies are receiving substantial government funding and generating substantial profits. The combination of rising profits, opacity, and regulatory capture warrants scrutiny.
The following chapters identify the many policies that benefit pharmacy owners at the expense of patients and taxpayers, and how to fix them:
- An exclusive negotiating position to set policy and funding (Chapter 2)
- Payments with no public justification for their structure or value (Chapter 3 and Chapter 4)
- Unparalleled protection from competition through pharmacy ownership and location rules (Chapter 5)
- Restrictions on discounting that increase costs for patients (Chapter 6)
- Minimal monitoring and reporting of quality, efficiency, or results (Chapter 7)
- Funding for pharmacy services that haven’t shown good value-for-money (Chapter 8)
This report does not cover the development, manufacture, or wholesale distribution of medicines in Australia, or the level and structure of patient payments or Safety Net thresholds.
Box 3: Private prescriptions are a lucrative revenue stream
Two types of medicine have boosted revenue from private prescriptions in recent years.aNote that some of these scripts were probably dispensed online rather than through traditional pharmacies.
Glucagon-like peptide-1 receptor agonists (GLP-1 RAs) – such as Ozempic and Mounjaro – are used to treat type 2 diabetes and obesity. Since May 2020, total sales have increased almost 10-fold, with most of the growth in private prescriptions.bIn April 2025, 43.8 per cent of prescriptions were private: Falster et al (2025).
In the 12 months to April 2025, an estimated 2.9 million private prescriptions for GLP-1 RAs were accessed.cThis only includes GLP-1 RAs listed for type 2 diabetes. The true number of private GLP-1 RA prescriptions was probably higher: Falster et al (ibid). Based on current Chemist Warehouse prices, this represents about $83 million in pharmacy remuneration per year.dAs of July 2026, Chemist Warehouse charged $144.99 for a 1.34mg/mL 3mL pre-filled Ozempic pen: Chemist Warehouse (2026). On the PBS, the medicine and wholesale costs are $116.23, meaning $28.76 of pharmacy remuneration: Department of Health, Disability, and Ageing (2026b). The figure is conservative, because non-discount pharmacies probably charge even more.
Medicinal cannabis prescriptions are also increasing. In 2025, 6.35 million units were dispensed in Australia, almost entirely as private scripts.eSee Penington Institute (2026, p. 3). Only cannabidiol, used to treat a rare form of epilepsy, is available on the PBS: Healthdirect Australia (2026). There were only 7,000 prescriptions for cannabidiol dispensed in 2025: Department of Health, Disability, and Ageing (2026c). If pharmacies charged only the standard current PBS dispensing fee, this would represent an additional $91 million to pharmacies each year. Again, the true figure is probably higher.
2 Restore independent pharmacy policy
Community pharmacies are funded and regulated through Community Pharmacy Agreements, which are negotiated between the federal government and the Guild. This arrangement has its roots not in policy design, but in a political crisis. The result is a process that is sheltered from outside scrutiny, dominated by a single interest group, and unlike any other major health funding arrangement in Australia.
The Community Pharmacy Agreement should be abolished and replaced with the more transparent, evidence-based alternatives proposed in this report. If the government won’t do that, agreements should be based on public evidence, and negotiated with pharmacists and patients – not just pharmacy owners.
2.1 What is the Community Pharmacy Agreement?
Since 1990, the federal government has negotiated a series of five-year agreements with the pharmacy sector – Community Pharmacy Agreements – to govern how community pharmacies are funded and regulated. There have been eight agreements to date.12The eighth Community Pharmacy Agreement came into effect on 1 July 2024 and will run until 30 June 2029, after which the ninth Community Pharmacy Agreement is expected to supersede it. See Department of Health, Disability, and Ageing and Pharmacy Guild of Australia (2024). The sector is represented by the Guild (see Box 1).13Section 98BAA of the National Health Act requires that the Community Pharmacy Agreement be with an organisation representing the majority of community pharmacy owners.
Community Pharmacy Agreements are expensive. The current agreement is expected to cost $25.8 billion over its five-year term.14Department of Health, Disability, and Ageing and Pharmacy Guild of Australia (2024).
2.2 The Agreement emerged from a political standoff, not a policy process
Before the first Community Pharmacy Agreement, in 1990, the sector looked very different. Pharmacy remuneration was determined independently by the Pharmaceutical Benefits Remuneration Tribunal (PBRT).15The PBRT was established in 1981 to insulate funding decisions from political pressure: ANAO (2015, Table 1.1).
Under this model, dispensing fees per script fell as the number of scripts dispensed by a pharmacy rose, which rewarded small, inefficient pharmacies. As a result, Australia had a high number of pharmacies by international standards, with many clustered together in urban areas.16Department of Health (2014, p. 6).
This was the case until 1989, when the PBRT concluded – based on surveys of dispensing costs – that pharmacies were being overpaid, and it moved to cut fees sharply.17The PBRT decided to abolish an existing 25 per cent mark-up and reduce the dispensing fee by 23 per cent: Department of Health, Disability, and Ageing (2024b, p. 6). Pharmacists responded by holding public rallies, with some owners closing their pharmacies in protest.18Ibid. The then Health Minister intervened by negotiating directly with the Guild and bypassing the PBRT entirely.19Ibid (p. 6).
The result was the first Community Pharmacy Agreement, signed in 1990. It replaced the old funding structure with one that no longer gave higher funding per script to lower-volume pharmacies, introduced location rules restricting where new pharmacies could open, and funded pharmacy buy-outs and mergers.20Department of Community Services and Health (1990).
While the PBRT still exists, its only remaining roles are to give legal effect to the terms of the Community Pharmacy Agreement, and to step in and set remuneration if the parties fail to reach a deal.21Section 98B of the National Health Act.
The precedent set by the first Community Pharmacy Agreement – a bilateral negotiation where politics pushed aside evidence – still haunts Australia today.
2.3 The Community Pharmacy Agreement is uniquely opaque and unrepresentative
The Community Pharmacy Agreement is determined through a process that is sheltered from outside scrutiny and dominated by a single interest group. No other major health funding arrangement in Australia works this way. Even compared to other countries with negotiated pharmacy agreements, Australia’s stands out for its lack of transparency and representativeness.
2.3.1 The negotiation is a black box
The terms of each Community Pharmacy Agreement are determined through months of closed-door negotiations.22For example, in the lead-up to the fifth agreement being signed, the Department of Health conducted dozens of meetings with the Guild – face to face, by email, phone, and teleconference – over more than six months: ANAO (2015, pp. 61, 83). There is no public documentation of the process and no empirical justification provided for the policies and spending agreed.23A 2015 Australian National Audit Office audit of the fifth Community Pharmacy Agreement is the most detailed public account available, but it revealed minimal detail on the negotiation process: ANAO (ibid). For an agreement governing billions of dollars of public spending, this is a remarkably low level of transparency.
It hasn’t gone unnoticed. The Consumers Health Forum of Australia, the Pharmaceutical Society of Australia,24The peak body for the pharmacy workforce. and other stakeholders not party to negotiations have repeatedly raised concerns.25See Jackson et al (2023a, p. 8) and King et al (2017b, p. 81). Improved transparency was also recommended by the 2017 Review of Community Pharmacy Remuneration and Regulation (the King Review).26Recommendations 5.4 and 6.3: King et al (ibid).
2.3.2 The right people aren’t at the table
Since the first Community Pharmacy Agreement, negotiations have taken place solely between the government and the Guild. The Guild represents most pharmacy owners, but not the pharmacists who work in pharmacies or the patients who rely on them.
This is a significant gap. Many stakeholders – including some pharmacists – say they are dissatisfied with the arrangement, and question the Guild’s ability to represent their interests.27Jackson et al (2023a) found broad dissatisfaction with the representativeness of negotiations. One pharmacist said: ‘Having the [Community Pharmacy Agreement] negotiated by a small group of owners with a vested interest is quite insulting, and quite inappropriate. They have a vested interest in achieving commercial prosperity.’ This is unsurprising: the interests of pharmacy owners do not always align with the priorities of employed pharmacists, let alone patients.
The King Review recommended that the Pharmaceutical Society of Australia and the Consumers Health Forum of Australia be included as equal participants in negotiations.28Recommendation 8.4 of King et al (2017b). Chemist Warehouse has argued that this expanded signatory list would not adequately represent their interests as the largest banner group because they are not members of the Guild: Gance (2017). For the past three agreements, stakeholder groups have had some formal participation in the lead-up to negotiations and in overseeing their implementation.29This has consisted of stakeholder consultations and, for select groups, positions on oversight committees: Department of Health, Disability, and Ageing (2025a), Department of Health (2022), and Department of Health, Disability, and Ageing (2019). But some stakeholders reported consultations were inadequate and had little meaningful impact: Jackson et al (2023a, p. 8). But this has not extended to the negotiations themselves. Apart from the Pharmaceutical Society of Australia – which was a signatory to a small professional services section of the seventh agreement – no one but the Guild and the Department has ever had a formal seat at the table.30Department of Health and Pharmacy Guild of Australia (2020) and Department of Health, Disability, and Ageing and Pharmacy Guild of Australia (2024).
2.3.3 Australian community pharmacy is an outlier
The Community Pharmacy Agreement is the only agreement of its kind for Australian healthcare services.31A partial exception is the Pharmaceutical Wholesaler Agreement. This was previously included in the Community Pharmacy Agreement but has since been separated into its own agreement that suffers from many of the same shortcomings: Department of Health, Disability, and Ageing and National Pharmaceutical Services Association (2024).
GP, specialist, optometry, and allied health rebates are set through the Medicare Benefits Schedule by the government, with new items added on the recommendation of the independent Medicare Services Advisory Committee.32Department of Health, Disability, and Ageing (2024d). Public hospital prices are set by an independent pricing authority, and calculated using cost data.33IHACPA (n.d.). Bilateral funding agreements with other health sectors – for example, for pathology and diagnostic imaging – have not been continued.34Pathology Funding Agreements (1996 to 2016) and Memoranda of Understanding with the diagnostic imaging sector (1998 to 2008) set negotiated spending targets, while individual services were paid for through fee-for-service Medicare payments: Jackson et al (2023b), Duckett and Romanes (2016), and ANAO (2014).
Table 2.1 rates pharmacy funding arrangements in comparable countries on three dimensions: the representativeness of the stakeholders in the negotiating room, the level of evidence they use to make their decisions, and how well their decisions are explained to the public.
Some other countries use sector-level negotiations to set pharmacy funding, but even among those, Australia stands out. No other jurisdiction combines such a narrow negotiating group with such a complete absence of public evidence and transparency. Wales comes close, but even there, all pharmacy owners are represented – not just a majority.
Table 2.1: International comparison of community pharmacy funding arrangements
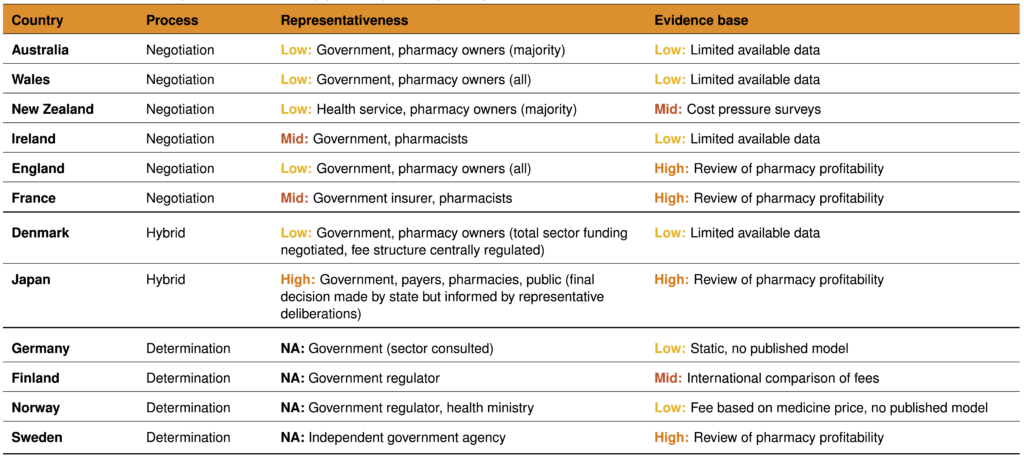
Notes: Representativeness = the degree to which decision-makers reflect the interests of those affected by their decisions. Evidence base = the amount and quality of evidence used to inform decisions.
Sources: Department of Health, Disability, and Ageing and Pharmacy Guild of Australia (2024), Community Pharmacy Wales (2025), Health New Zealand | Te Whatu Ora (2025a), Grant Thornton (2021), Department of Health Ireland (2025), Community Pharmacy England (2024), Fédération des Pharmaciens de France (2023), Andersen and Skov-Johansen (2024), Hansen et al (2021), Health and Global Policy Institute (n.d.), Health and Global Policy Institute (2019), Federal Union of German Associations of Pharmacists (ABDA) (2025), Sosiaali- ja terveysministeriö (2020), Apotekforengingen (2024), and Tandvårds- & läkemedelsförmånsverket TLV (n.d.).
2.4 This Community Pharmacy Agreement should be the last
The key functions of the Community Pharmacy Agreement should be replaced with more transparent, evidence-based alternatives. Pharmacy remuneration should be set by an independent body (see Chapters 3 and 4), and funding for other community pharmacy services should be determined through a separate process (see Chapter 8).
That leaves little for Community Pharmacy Agreements to do, and no reason for them to continue. The current agreement should be the last.
If the agreements are retained, they should at least be reformed:
- Include the Pharmaceutical Society of Australia, the Consumers Health Forum of Australia, and other pharmacy owners
- Base decisions on cost data released before negotiations
- Document the decision-making process and make outcomes subject to ongoing quality monitoring and reporting
The Guild will probably oppose the recommendations in this report. It is likely to claim, as it has before, that reform threatens the viability of the sector and the communities that depend on it. The best response to these arguments is transparency, so that taxpayers and patients can know if these claims are accurate.
3 Make dispensing fees simpler and fairer
Community pharmacies exist, first and foremost, to dispense medicines. For PBS medicines, the cost of dispensing is shared between patients and the government. Many fees that add to that cost are poorly designed, and some are completely unjustified. Fixing these issues would deliver better value for taxpayers, cut patient fees, and support the delivery of high-cost medicines.
This chapter outlines how to address these structural flaws, and Chapter 4 covers how the value of the fees should be set.
3.1 How dispensing is funded
Community pharmacies receive a series of payments for dispensing PBS medicines, each ostensibly covering a different cost. The fees are paid by the government, the patient, or both. The following sections explain each component.
3.1.1 The Commonwealth Price
When a pharmacy dispenses a medicine, the total amount they receive in return is called the Commonwealth Price.35The Commonwealth Price is intended to cover the costs of dispensing PBS medicines, not any other pharmacy operations. The Commonwealth Price has four components:36Department of Health, Disability, and Ageing (2026d).
- Medicine costs – The approved ex-manufacturer price and wholesale mark-up ($0.24 to $223 depending on medicine price) reimburse the pharmacy for the price it has already paid to the manufacturer and wholesaler.
- Handling and infrastructure – The administration, handling, and infrastructure fee ($5.12 to $100.12 depending on medicine price) covers the costs of storing and handling the medicine and maintaining the required pharmacy infrastructure.
- Dispensing services – The dispensing fee ($9.24 for ready-prepared medicines, $11.28 for compounded medicines) covers dispensing – from receiving the prescription, verifying and preparing the medicine, to counselling the patient and handing it over.
- Other – Fees that vary by medicine type, patient circumstances, and pharmacist discretion, including the dangerous medicine fee ($5.73), Safety Net recording fee ($1.54 for ready-prepared medicines, $1.99 for compounded medicines), and allowable additional patient charge (up to $2.79).
The exact values of these payments are listed in Table A.1 in Appendix A.
The Commonwealth Price is split between the patient and the government, with patients paying up to the maximum co-payment ($25 for general patients and $7.70 for concession patients) and the government paying the rest.37On top of the maximum co-payment, patients may pay after-hours fees, brand or therapeutic group premiums, or special patient contributions: Department of Health, Disability, and Ageing (ibid). Figure 3.1 provides an illustrative example using atorvastatin – a common, low-cost medicine for high cholesterol – of how this payment is split.
Figure 3.1: Patients and the government split the cost of dispensing
Cost components of the Commonwealth Price of atorvastatin 10mg (pack of 30), July 2026
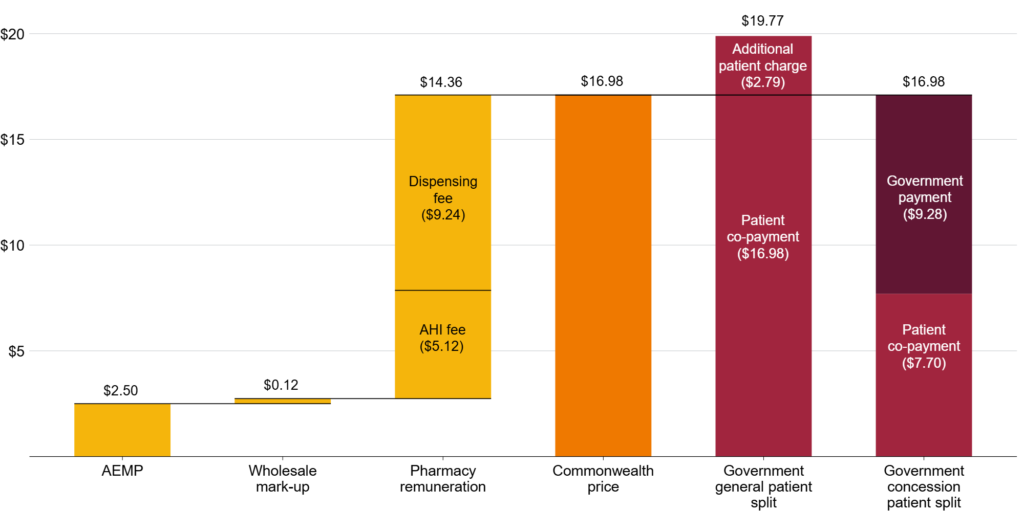
Notes: Atorvastatin 10mg (pack of 30) has the PBS item number 8213G. AEMP = Approved ex-manufacturer price. AHI = Administration, handling, and infrastructure. The full allowable additional patient charge ($2.79) has been applied to the general patient fee here, but pharmacists may choose to apply part or none of this charge, provided the total patient cost does not exceed the general patient co-payment of $25. No Safety Net recording fee or after-hours fees have been included. Atorvastatin does not attract any brand or therapeutic group premiums.
Sources: Department of Health, Disability, and Ageing (2026d) and Department of Health, Disability, and Ageing (2026b).
3.1.2 Additional funding for 60-day dispensing
The current Community Pharmacy Agreement introduced the Additional Community Supply Support payments to compensate pharmacies for income lost due to 60-day dispensing (see Box 2).38Payments apply to over co-payment Section 85 medicines: Department of Health, Disability, and Ageing and Pharmacy Guild of Australia (2024, p. 13) and Department of Health, Disability, and Ageing (2026e). Section 85 medicines cover most community pharmacy dispensing: Storen et al (2022).
These payments consist of two components:39Department of Health, Disability, and Ageing (2026e).
- Component 1: $5.12 for each over co-payment 60-day script dispensed.
- Component 2: $0.13 for each over co-payment script dispensed.40In 2024–25, this covered 67 per cent of PBS dispenses: Department of Health, Disability, and Ageing (2026a, Tables 2a and 3a).
Together these payments will cost $2.1 billion from 2024 to 2029.41This covers the term of the eighth Community Pharmacy Agreement: Department of Health, Disability, and Ageing (2026e).
3.2 Pharmacy funding has structural flaws
There are three main problems with the design of dispensing fees:
- Pharmacies are reimbursed above the prices they pay for medicines, and the policy to fix it isn’t quick or precise enough
- The financial risks from stocking high-cost medicines are addressed through a wasteful and ineffective mark-up
- Pharmacies get several arbitrary, unfair, and costly fees
3.2.1 Price disclosure works, but not well enough
When a new medicine is added to the PBS, the approved ex-manufacturer price is set through negotiations between the manufacturer and the government. This process takes into account the cost of manufacture, the type of medicine, and the prices of other similar medicines.42Department of Health, Disability, and Ageing (2017).
The approved ex-manufacturer price is the maximum price at which a manufacturer can sell the medicine for.43See Section 84 of the National Health Act 1953. But they can – and often do – sell medicines to pharmacies for less than this price to gain market share.44Department of Health, Disability, and Ageing (2025b). Historically, this meant pharmacies could purchase medicines at discounted prices while being reimbursed the full ex-manufacturer price by the government, effectively profiting at taxpayers’ expense.
In 2007, the government introduced a price disclosure policy to claw back savings for taxpayers.45Ibid. Manufacturers are now required to report the actual prices at which medicines are sold, with reimbursement gradually reduced to reflect those prices.46Price disclosure applies to all multi-brand, off-patent, or generic medicines, unless specifically exempt: Department of Health, Disability, and Ageing (ibid).
Similar systems are used successfully in other countries, including in England47In England, reimbursement prices for Category M medicines – which covers most generic medicines – are set using purchase and sales data reported by manufacturers and wholesalers: Community Pharmacy England (2026). and in the Medicaid program in the US.48Medicaid provides health insurance for disadvantaged Americans. Pharmacies are regularly surveyed on prices and the results are used to calculate a national average price for each medicine. State Medicaid agencies can use these figures as the basis for pharmacy reimbursement. See Medicaid (2026).
In Australia, price disclosure has cut the price of many medicines. Over the past 10 years, there have been about 2,000 price reductions, averaging 21 per cent.49Analysis includes the October 2017 cycle to the April 2026 cycle, and counts unique medicines (medicine and form) rather than item numbers: Department of Health, Disability, and Ageing (2025c). The prices of 251 medicines were cut in 2024, saving the government and patients about $167 million in 2025.50Grattan analysis of Department of Health, Disability, and Ageing (2026c), Department of Health, Disability, and Ageing (2025d), and Department of Health, Disability, and Ageing (2024e). Savings are estimated by applying 2025 prescription volumes to the difference between prices before and after 2024 price disclosure reductions.
But two flaws limit the effectiveness of price disclosure.
First, because data are collected over six months and then processed over a further six months, it can take up to a year for a fall in market prices to translate into a lower PBS price.51There are two overlapping, year-long cycles, with price reductions in April and October: Department of Health, Disability, and Ageing (2025b). Shortening this cycle to monthly – as in England and the US – would deliver savings sooner.52See Community Pharmacy England (2026) and Medicaid (2026). To smooth out short-term fluctuations, reductions could be made on an annual basis using several months of data.
Second, price reductions only kick in if the discount is more than 30 per cent for some medicines and more than 10 per cent for others.53Designated brands – generally low-cost medicines that have been subject to price disclosure for several years – receive certain protections against medicine shortages, including a 30 per cent threshold for price reductions and a $4 price floor. An exception applies where discounting has averaged at least 12.5 per cent across the previous three data collection periods, in which case the standard 10 per cent threshold applies: Department of Health, Disability, and Ageing (2026f). Smaller discounts have been more common than larger ones over the past decade (Figure 3.2). But the thresholds mean that discounts smaller than 10 per cent are ignored.54Except where the price floor is hit. There is no good reason for these excluded discounts.55The distribution in Figure 3.2 probably understates the true cost of the thresholds. The visible gap below 10 per cent shows discounts that are never passed on, but medicines subject to the 30 per cent threshold can be discounted by up to 29 per cent without triggering any reduction at all. Those missed discounts are not visible in the chart.
Figure 3.2: Patients and taxpayers are probably missing out on more discounts below the 10 per cent threshold
Number of price disclosure reductions by size, October 2017 to April 2026
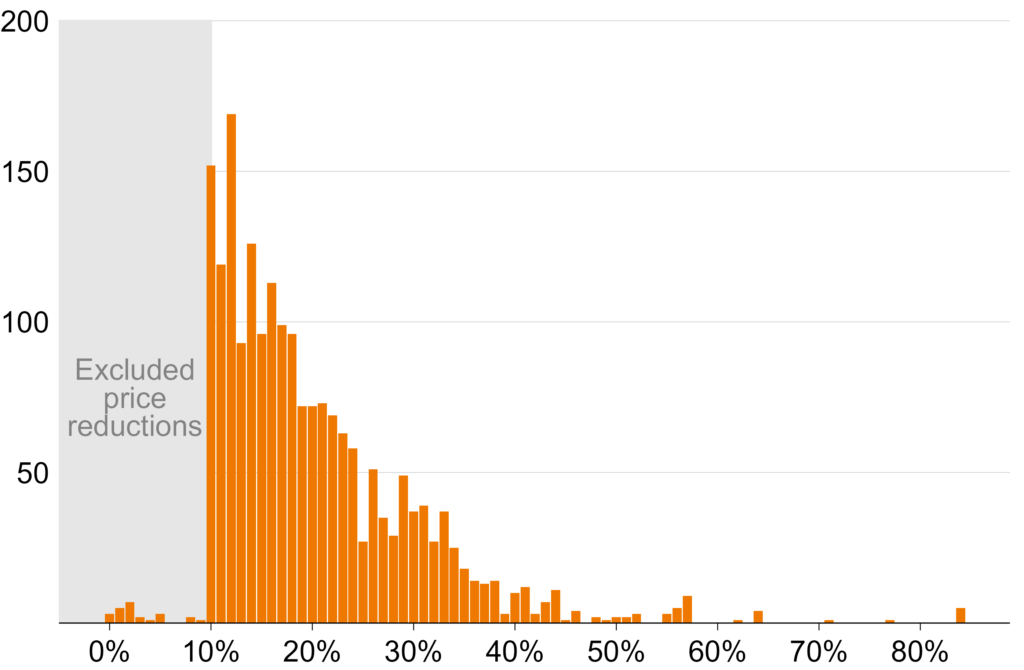
Notes: Includes all price reductions from the October 2017 to April 2026 price disclosure cycles. Reductions below 10 per cent are due to medicines from designated brands hitting the $4 price floor.
Source: Grattan analysis of PBS Brand Price Reductions Reports, available at Department of Health, Disability, and Ageing (2025c).
The threshold should be set to zero, so that each cycle the reimbursement price is simply reduced to match the average market price. Under this model, manufacturers would still have an incentive to discount to win market share, but those discounts would be passed on to taxpayers in full.
Since 2022, discounts have been ignored for some medicines that cost $4 or less.56Designated brands are subject to a price floor of $4: Department of Health, Disability, and Ageing (2026f). This is supposedly because shortages are more common for these medicines.57See the National Health Amendment (Enhancing the Pharmaceutical Benefits Scheme) Act 2021. But no public analysis has been released to show this, or to enable assessment of whether the policy has worked.
Price reduction thresholds should be removed and the justification for, and level of, the $4 price floor should be publicly reviewed.
3.2.2 A cheaper and better way to manage financial risk from high-cost medicines
Pharmacies receive an administration, handling, and infrastructure fee for every PBS medicine they dispense. One part of this is a fixed fee of $5.12 for the physical infrastructure to store and supply medicines. The other part increases with the cost of the medicine, which is intended to compensate pharmacies for the financial cost of stocking high-cost medicines, and reaches a maximum of about $100 (Table A.1 in Appendix A).
These two components should be separated.
The physical cost of storing a medicine does not vary with its price,58While some medicines are more expensive to store – for example those requiring refrigeration – price differences between medicines generally reflect patent status rather than storage requirements. For example, a brand-name medicine and its generic equivalent require identical storage but may be priced very differently. so the fixed component should simply be absorbed into the dispensing fee. The dispensing fee would then cover all costs associated with stocking, handling, and dispensing a medicine.
Unlike storage costs, financial risk does vary with medicine price.
The number of high-cost medicines on the PBS is rising.59The average dispensed price for over co-payment PBS prescriptions increased in real terms from $55 in 2014-15 to $95 in 2024-25: Department of Health, Disability, and Ageing (2016) and Department of Health, Disability, and Ageing (2026a). In 2024-25, just 10 medicines accounted for 30 per cent of all spending on over co-payment PBS medicines, with six of these medicines averaging more than $1,000 per dispense: Department of Health, Disability, and Ageing (2026a, Tables 3a and 5a). The King Review noted that current funding arrangements do not adequately support the supply of these medicines.60King et al (2017b, pp. 92-93).
The problem is the structure of pharmacy reimbursement.61All references in this and the following paragraph are from King et al (ibid). Pharmacies purchase medicines and are reimbursed only after dispensing them. If they can’t dispense a medicine – because a patient orders it specially and fails to collect it, or because it is damaged – the pharmacy has no reimbursement pathway and bears the full cost. Separately, pharmacies must pay GST at the point of purchase but cannot reclaim it until the end of the month. For most medicines, that is manageable, but for a medicine costing tens of thousands of dollars it may not be.
Pharmacies may choose not to stock these medicines at all, or to order them only after considerable delay.62The interim report of the King Review observed that this was already happening in some instances, referencing a survey of pharmacies conducted by the Australian Journal of Pharmacy that found that 22 per cent were not stocking high-cost hepatitis C treatments due to cash-flow issues: King et al (2017a, p. 130). This could have real consequences for patients.
Until now, the financial risk associated with high-cost medicines has been managed through the administration, handling, and infrastructure fee, with more expensive medicines attracting a higher fee. But even the highest level is low compared to the cost of some medicines, only covering a tiny fraction of the potential financial loss. For the 217,000 PBS scripts dispensed in 2025 with a wholesale cost greater than $5,000, it covered less than 2 per cent of these costs.63Grattan analysis of Department of Health, Disability, and Ageing (2026c) and Department of Health, Disability, and Ageing (2026b). Wholesale cost here is approved ex-manufacturer cost plus wholesale mark-up, reported as ‘Price to Pharmacists’. Note that some highly specialised medicines attract a different handling fee instead of the standard administration, handling, and infrastructure fee, but this fee is even lower: the maximum is $40, compared to about $100 for standard medicines: Department of Health, Disability, and Ageing (2024f).
With the fixed component of this fee moved into the dispensing fee, the variable component should be abolished and replaced with a risk-sharing mechanism that pays pharmacies faster for these high-cost medicines.
For medicines with an ex-manufacturer price above a defined level, the government should pay pharmacies a fixed proportion – say, 80 per cent – of the purchase price when the pharmacy purchases the medicine, rather than waiting until dispensing.64The optimal threshold and proportion would need to be determined carefully, taking into account the distribution of medicine prices, pharmacy cash-flow patterns, and the risk of stock management distortions at the boundary.
Almost none of this would be new expenditure: it’s money the government would pay anyway once the medicine is dispensed, just brought forward to give pharmacies security when they stock high-cost medicines. By covering most, but not all, of the upfront cost, the government would reduce the financial risk of stocking these medicines without eliminating the incentive not to waste them.
The cost to government of paying for medicines that are not dispensed would probably be small. And the savings would probably be substantial: in 2024-25, pharmacies received almost $285 million in variable, cost-linked administration, handling, and infrastructure fees on over co-payment scripts alone.65Figure reported in 2024-25 dollars. Calculated by multiplying the number of over co-payment prescriptions dispensed by the baseline fee – $4.79 at the time – and then subtracting that amount from total administration, handling, and infrastructure fees received by community pharmacies in 2024-25: Department of Health, Disability, and Ageing (2026a, Tables 3a and 17a) and Department of Health, Disability, and Ageing and Pharmacy Guild of Australia (2024). The number of over co-payment prescriptions dispensed was found by multiplying the total PBS scripts from Table 15a by the ratio of prescriber’s bag to non-prescriber’s bag prescriptions from Table 3a and then adding the total RPBS scripts from Table 15a: Department of Health, Disability, and Ageing (2026a).
This reform would reduce a barrier to patient access to high-cost medicines, and deliver savings to taxpayers in the process.
3.2.3 Some smaller fees are unjustified and unfair
Pharmacy remuneration includes many small fees. Three of them cannot be justified: the allowable additional patient charge and the Safety Net recording fee, which are charged to patients, and the Additional Community Supply Support payment, which is paid by the government.
The allowable additional patient charge
When a medicine costs less than the maximum patient co-payment, pharmacists may charge general patients an additional fee of up to $2.79, provided the patient’s total out-of-pocket cost does not exceed the maximum co-payment amount.66Department of Health, Disability, and Ageing (2026d).
This fee doesn’t compensate for a service. If dispensing fees are set to cover the full cost of dispensing (see Chapter 4), then it’s just a government-sanctioned surcharge on patients buying cheap medicines.
The cost to patients adds up. No data are reported on how often the fee is charged. But in 2025, if all eligible prescriptions had attracted the maximum fee, it would have cost patients up to $347 million.67Grattan analysis of Department of Health, Disability, and Ageing (2026c) and Department of Health, Disability, and Ageing (2026b). This figure is calculated using an allowable additional patient charge of $3.45, which was its value in 2025. It has since fallen to $2.79 in line with a reduction in the maximum patient co-payment. In 2025, about 80 per cent of the 127 million non-Safety Net scripts dispensed for general patients were eligible.
The discretionary nature of the fee is also unfair. Pharmacists will be more likely to waive it if they face price competition from nearby pharmacies. In areas with less competition – for example, rural and regional areas with limited pharmacy access – patients may have no choice but to bear the full additional charge. This means the fee falls most on those with the least ability to shop around.
The solution is simple: the fee should be removed.
The Safety Net recording fee
The PBS Safety Net allows patients who spend above a certain amount on medicines in a calendar year to pay less for their remaining prescriptions that year.68The threshold is currently $1,748.20 for general patients, after which they pay the concessional co-payment rate, and $277.20 for concession patients, after which their medicines are free: Department of Health, Disability, and Ageing (2026g).
To access the scheme, patients must have their spending on prescriptions recorded. This is done either by attending the same pharmacy each time – which keeps a digital record – or by the patient physically carrying a paper record to present at each pharmacy they visit.69Department of Health, Disability, and Ageing (2026g) and Services Australia (2026).
The clunkiness of this system is limiting its effectiveness. While no official data are available, in 2025 the ABC reported that almost 500,000 Australians who qualify for the Safety Net each year do not access it, potentially forgoing hundreds of dollars in savings each.70Branley and Lloyd (2025).
Pharmacies can choose to charge the Safety Net recording fee – $1.54 for ready-prepared medicines and $1.99 for compounded medicines – as compensation for the administrative work of recording prescriptions.71See Department of Health, Disability, and Ageing (2026d). No data are available on how often pharmacies choose to charge this fee.
But there are two problems with this fee.
First, the task it compensates for is trivial. Recording a prescription involves filling out a simple table.72Pharmacists must enter the date, their signature, and three clinical details – all of which are typically automatically generated by pharmacy software. Some pharmacies use software that automatically prints a label with this information, which can then be stuck directly onto the form: Department of Health, Disability, and Ageing (2026g). But dispensing involves many small administrative steps – not all of which apply to every medicine – so there is no reason to pay a discrete fee for this one and not the others.
Second, the fee applies to some patients and not others. As with the allowable additional charge, pharmacists can apply it only to general patients, for under co-payment medicines, where the fee doesn’t push the patient’s out-of-pocket cost above the co-payment cap.73Department of Health, Disability, and Ageing (2026d).
These conditions shield concession-cardholders from extra costs and prevent fees from exceeding the maximum co-payment. But if the purpose is to compensate pharmacists for a service they perform, limiting the scripts that attract the fee makes little sense. The administrative work of Safety Net recording does not vary by concession status or medicine price.
The solution is to abolish the fee and automate PBS Safety Net recording entirely, as is already done for Medicare Safety Nets.74For individuals, Services Australia automatically records Medicare expenses and applies the benefit once the threshold is reached: Department of Health, Disability, and Ageing (2025e). This would eliminate the administrative burden for pharmacists and ensure no patient misses out.
Additional Community Supply Support payments
Unlike the other two unjustified fees, which are paid entirely by patients, Additional Community Supply Support payments are paid by the government.
The payments are intended to compensate pharmacies for lost dispensing revenue from 60-day dispensing (see Box 2).75Pharmacy Guild of Australia (2024a).
There are three problems with this justification.
First, uptake of 60-day dispensing has been much slower than expected. In 2025, only about half of the 60-day prescriptions that were forecast in the eighth Community Pharmacy Agreement actually materialised (Figure 3.3).76In 2025, actual 60-day prescriptions made up only 51.6 per cent of those forecast: Grattan analysis of Department of Health, Disability, and Ageing and Pharmacy Guild of Australia (2024) and Department of Health, Disability, and Ageing (2026c).
Figure 3.3: Compensation for 60-day dispensing losses was based on overestimates of uptake
Forecast and actual monthly volume of over co-payment PBS medicines dispensed from 60-day prescriptions
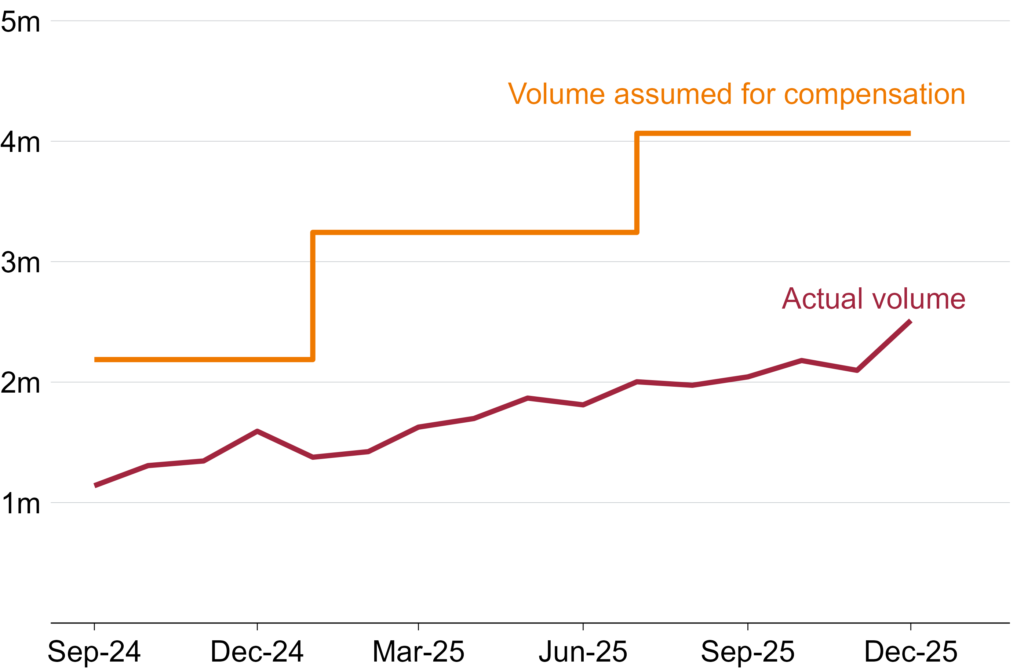
Notes: Medicines were added to the eligibility list for 60-day dispensing in three stages, with the final stage commencing in September 2024. Volume forecasts are from half-yearly forecasts provided in the eighth Community Pharmacy Agreement, which have been divided by the number of months to convert them to average monthly rates. Actual volumes are calculated using the methodology outlined in Breadon and Hu (2025).
Source: Grattan analysis of Department of Health, Disability, and Ageing and Pharmacy Guild of Australia (2024) and Department of Health, Disability, and Ageing (2026c).
Yet pharmacies were compensated as if the forecast had been met. The Community Pharmacy Agreement guarantees pharmacies the full $2.1 billion regardless of actual dispensing volumes.77Where over co-payment 60-day prescription volumes fall short of forecasts, Additional Community Supply Support unit payments are increased to make up the difference: Department of Health, Disability, and Ageing and Pharmacy Guild of Australia (2024, Appendix A). See Box 5 for detail.
Second, the payments are poorly targeted. Compensation should have been tied only to the number of 60-day scripts dispensed, since they reduce dispensing volume and revenue. Instead, most standard 30-day scripts attract small compensation payments too, meaning pharmacies are compensated regardless of whether they are affected by the policy change at all.
The third problem is that, like all components of pharmacy remuneration (see Chapter 4), the values of the payments lack any transparent or evidence-based justification. There is no public documentation of how the values were determined or whether they bear any relationship to actual losses incurred.
Additional Community Supply Support payments should be removed.
The right way to maintain sector viability is with fair dispensing fees that cover the cost of dispensing, and focused support for struggling pharmacies. The next chapter shows how to do it.
4 Set the right price
Not only is pharmacy remuneration poorly structured – as the previous chapter showed – the level is also set the wrong way.
Community pharmacies exist to ensure all Australians have adequate, safe, and equitable access to medicines. Achieving that requires dispensing fees that fairly compensate pharmacists – while also ensuring public money is spent wisely.
But dispensing fees are set through negotiation and not grounded in real-world evidence, so there is no way to know whether they represent fair value – for patients, taxpayers, or pharmacies themselves.
Fees should instead be based on the actual cost of dispensing, with ongoing monitoring of pharmacy profitability.
4.1 Dispensing fees are a stab in the dark
Pharmacy remuneration is the largest financial component of the Community Pharmacy Agreement.78Ibid (pp. 8-9). In 2024-25, pharmacies were paid about $3.4 billion (Figure 4.1).79Figure is in 2025 dollars.
Community pharmacies dispensed 335 million prescriptions in 2024-25, so even a small increase quickly adds up: each additional cent per script translates to $3.4 million for pharmacies.80Department of Health, Disability, and Ageing (2026a, Tables 2a and 2c). Even overpaying slightly has big budget consequences. Yet fee levels have been determined through successive Community Pharmacy Agreement negotiations, with no public justification.81By contrast, the English government has commissioned two independent studies of the costs and profitability of community pharmacies in the last 15 years to inform contractual negotiations: PricewaterhouseCoopers (2011) and Frontier Economics (2025).
Figure 4.1: Pharmacy remuneration costs billions each year
Pharmacy remuneration for over co-payment dispensing by cost component, 2024-25
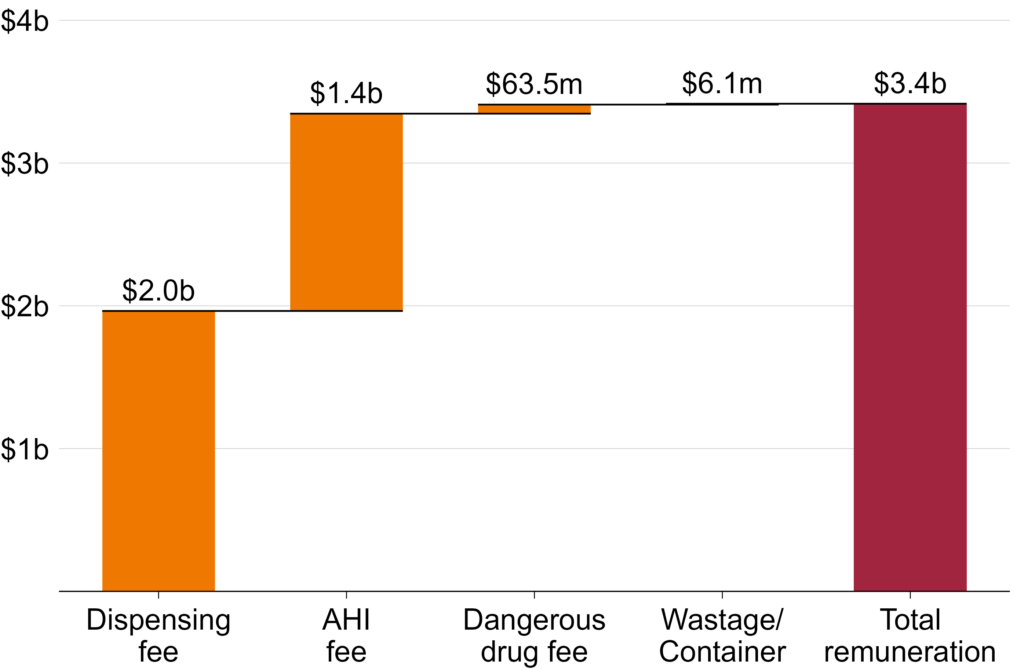
Notes: AHI = Administration, handling, and infrastructure. Values include total government and patient funding for over co-payment Section 85 and Section 100 PBS items dispensed by community pharmacies. Wastage fees compensate pharmacies for medicines that cannot be dispensed because a pack had to be opened to supply a smaller quantity than the standard pack size, and container fees cover the cost of any additional packaging supplied with a dispensed medicine: Department of Health, Disability, and Ageing (n.d.).
Source: Department of Health, Disability, and Ageing (2026a, Table 17a).
4.2 We might be paying too much for dispensing
No one knows what it actually costs to dispense a prescription in an Australian community pharmacy.82This was a key call-out in the King Review: King et al (2017b, p. 62). And it’s no accident. Unlike in other countries, efforts in Australia to establish the real cost of dispensing have been blocked by the Guild, forcing the government to negotiate fees in the dark (Section 1.2).
But while there is currently no way to know if pharmacies are being overpaid, or underpaid, there are signs that the sector may be over-compensated.
4.2.1 Funding has grown despite efficiency gains
Dispensing payments for each over co-payment script have risen by 45 per cent since the first Community Pharmacy Agreement was signed in 1990, after accounting for inflation (Figure 4.2).83Growth in pharmacy remuneration has outpaced both the Consumer Price Index (CPI) and Wage Price Index (WPI) – rising from $10.90 in 1991-92 to $15.90 in 2024-25 in today’s dollars. We use CPI rather than WPI because productivity gains from automation over that period mean labour costs per script should have risen more slowly than wages. Some of this increase may reflect legitimate cost pressures – an older, sicker population and growing polypharmacy may place greater demands on pharmacists’ time.84For trends in polypharmacy, see Lee et al (2026). Polypharmacy is the simultaneous, regular use of multiple medications, often defined as five or more, by an individual: RACGP (2019).
Figure 4.2: Pharmacy remuneration has increased since the first Community Pharmacy Agreement
Average pharmacy remuneration per over co-payment script, adjusted for inflation using CPI and WPI
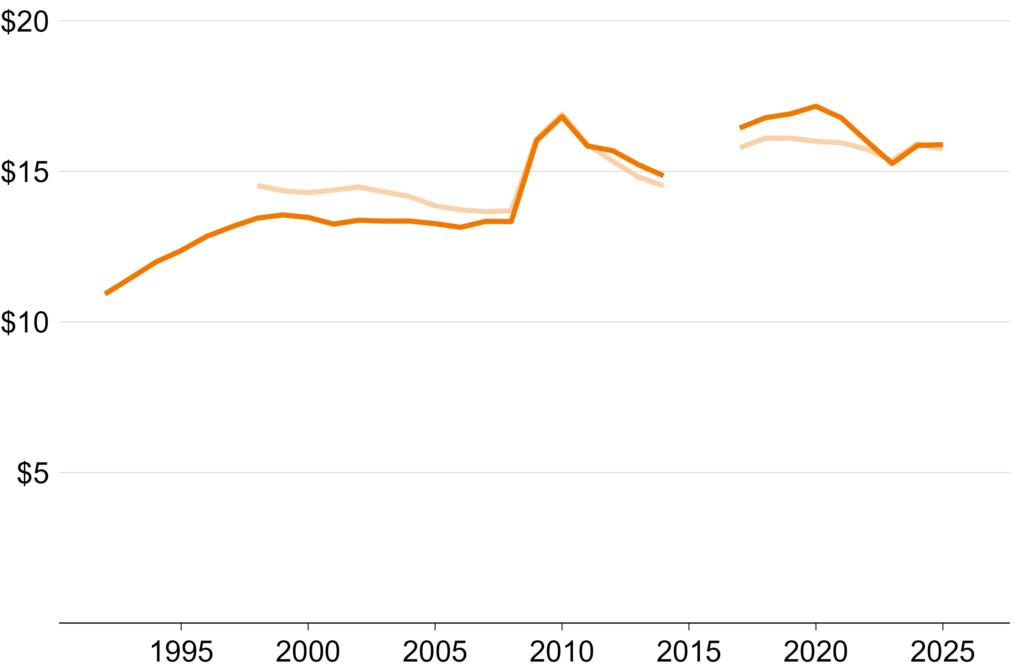
Notes: CPI = Consumer Price Index. WPI = Wage Price Index. Average remuneration per script is calculated as total pharmacy remuneration (excluding ex-manufacturer costs, wholesale remuneration, Additional Community Supply Support program, cost Funding of Chemotherapy, and funding for pharmacy professional programs) divided by total pharmacy prescription volume and inflated to March 2026 dollars using both the CPI and WPI: ABS (2026a) and ABS (2026b). WPI was first reported in 1997. Years refer to the end of the financial year (e.g. 1991-92 is shown as 1992). Data for 2014-15 and 2015-16 are not available. The jump in 2008-09 is partially due to the introduction of the Premium Free Dispensing Incentive and PBS online payments: ANAO (2015).
Sources: Data for 1991-92 to 2013-14 from ANAO (ibid, Appendix 10); for 2016-17 to 2024-25 from Tables 15a and 17a of the PBS Expenditure and Prescriptions
reports, available at Department of Health, Disability, and Ageing (2026a), though table numbers vary across editions.
But over the same period, technology has substantially reduced the labour required to dispense a standard script. PBS Online Claiming and ePrescribing have replaced labour-intensive, paper-based systems.85Online claiming was introduced in 2005 and ePrescribing in 2020: ANAO (2024) and Pharmaceutical Society of Australia (n.d.). As of December 2024, 99.9 per cent of claims were processed online. In a 2022-23 survey of 120 Australian community pharmacies, 40 per cent reported a reduced workload due to ePrescribing and Electronic Health Records: Hareem et al (2024). A time-and-motion study of five NSW and Queensland pharmacies identified similar efficiencies: ADHA (2023). Automated dispensing robots – already common in Australian hospitals86See Levy (2022). A systematic review of automated dispensing in hospitals identified significant efficiency gains: Batson et al (2021). – are increasingly being used in community pharmacies,87Numerous manufacturers now market automated dispensing systems specifically to community pharmacies, advertising significant efficiency gains. For example Willach Pharmacy Solutions (n.d.) and Meditech (n.d.). further reducing physical labour. And online dispensing (see Box 4) will only continue to streamline dispensing.
Yet negotiated fees have never been adjusted to reflect these efficiency gains, meaning all the cost savings have flowed to pharmacies, and none to patients or taxpayers.
Box 4: Online dispensing
Online dispensing involves patients having their prescription medicines delivered, with written medicine information supplied, and pharmacist advice available by phone or online.aPharmacy Board of Australia (2023, p. 6) and Pharmaceutical Society of Australia (2019).
Online dispensing offers patients greater convenience and access to medicines, and demand will probably grow over time.bLimbu and Huhmann (2024).
Pharmacy policy needs to adapt to support the benefits of online dispensing while addressing the potential risks:
– Quality and safety: International evidence suggests online dispensing can improve medicine adherence relative to in-person dispensing.cSchwab et al (2019), Schmittdiel et al (2011), and Khandelwal et al (2011). Quality and outcomes of online dispensing should still be monitored.
– Pricing: To ensure patients and taxpayers don’t over- or under-pay for online dispensing, the Independent Health and Aged Care Pricing Authority should consider whether a different remuneration structure is needed.
– Equitable access to pharmacies: Online dispensing may increase access to medicines for those who cannot easily visit a pharmacy, but this may also reduce the need for some brick-and-mortar pharmacies.dJervelund et al (2025). Resulting pharmacy closures could threaten medicine access for patients who do not use online options, and reduce locations delivering pharmacy services. This risk should be assessed as part of the proposed viability monitoring scheme.
4.2.2 Pharmacists may be paid for time they don’t spend
Some pharmacy payments – the dispensing fee, dangerous medicine fee, and Safety Net recording fee – pay for a pharmacist’s time and related overheads rather than infrastructure.
For these payments, we can work backwards from the fee levels and the typical pharmacist’s hourly pay rate to calculate how many minutes of pharmacist time each fee implicitly funds (Table 4.1).88In 2025, the median hourly pay rate for pharmacists more broadly – including hospital and industrial pharmacists – was $52: Jobs and Skills Australia (2025). This method uses 2024-25 fees for consistency, and assumes they cover only pharmacist labour and related on-costs, and no profit. These estimates are therefore indicative only: in practice, the dispensing fee covers the full labour chain – including assistants and technicians. On this basis, for example, it would take a community pharmacist about eight minutes to dispense a ready-prepared prescription.89This also implies that compounded medicines take less than two minutes longer to dispense than ready-prepared medicines – almost certainly too low. Compounded medicines comprise a tiny minority of total prescriptions, so this barely affects overall fee adequacy – but for specialised compounding pharmacies, fees may significantly undercompensate the labour involved.
Table 4.1: Implied time taken for components of dispensing
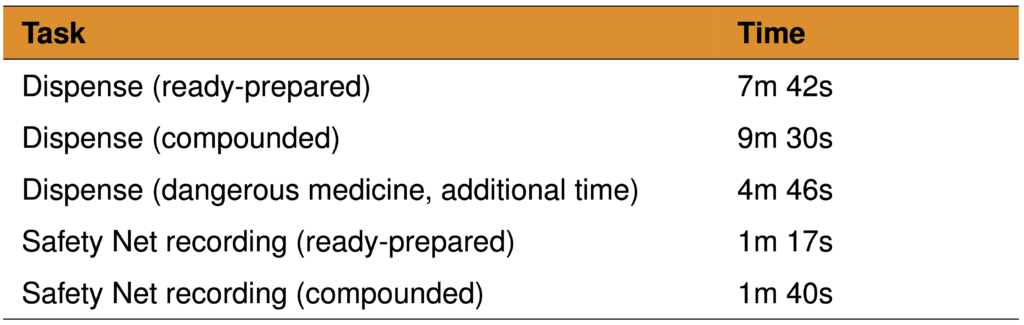
Notes: Calculated using an estimated hourly pay rate of $52 for community phar-macists, with a 1.3 multiplier applied to capture related on-costs: ANU (2015).
Source: Grattan analysis of Department of Health, Disability, and Ageing (2026d) and Jobs and Skills Australia (2025).
Unfortunately, there is little research on how long these tasks actually take. The only available Australian evidence – a time-and-motion study of 15 community pharmacies in WA and NSW – found that across almost 100 hours of observed dispensing time, there were about 5,700 prescriptions dispensed.90Total dispensing time taken from Karia et al (2022, Table 2), and includes time spent solely on dispensing as well as multi-tasking time. Number of prescriptions provided to Grattan by the author on request. That’s one every 62 seconds, on average.
This evidence isn’t definitive – it draws on a small sample of pharmacies and may not be nationally representative. It also probably understates total dispensing time, since pharmacy assistants and other pharmacists often handle parts of the process and their time may not have been captured. Even so, the total labour time per prescription – across all staff involved – is probably far less than the eight minutes the dispensing fee implicitly funds.
4.3 Dispensing fees should reflect the cost of dispensing
In Chapter 3, we made the case for a simpler dispensing fee that no longer includes unjustified payments. Critically, the level of this fee should be grounded in actual cost data.
In a well-functioning pharmacy sector, the dispensing fee should cover the cost of dispensing a medicine plus a reasonable profit margin.91For example, this margin could be set equal to the average return on capital across the community pharmacy sector – that is, for each dollar of capital invested in a business, how much profit it earns.
Fortunately, an institution already exists with relevant expertise for setting this fee.92While the Pharmaceutical Benefits Remuneration Tribunal (PBRT) still technically exists, it has only five members, one of whom requires Guild approval before appointment: Department of Health, Disability, and Ageing (2025f) and section 98 of the National Health Act 1953. It lacks both the resources and the independence required for this task. The Independent Health and Aged Care Pricing Authority (IHACPA) is an independent statutory body that already develops evidence-based pricing advice for government. Most relevantly, it uses detailed cost data from aged care providers to calculate funding rates.93Registered aged care providers are required to submit quarterly financial reports to government: Department of Health, Disability, and Ageing (2026h). IHACPA draws on this data alongside its own cost collections to develop pricing advice: IHACPA (2025a).
IHACPA will need to determine the most appropriate method for calculating the baseline cost of dispensing.
One approach is calculating the actual average cost of dispensing a medicine.94The King Review proposed a similar approach to calculate best-practice dispensing costs: King et al (2017b, Recommendation 5.2). This will require data on cost inputs – including labour and infrastructure – as well as the time taken to dispense. IHACPA could gather these data as part of a broader time-and-motion study of community pharmacy covering dispensing and other professional services.95A similar time-and-motion study existed for general practice. The Bettering the Evaluation and Care of Health (BEACH) study ran from 1998 to 2016, with a nationally representative sample of GPs: University of Sydney (n.d.). This model has since been adapted for general practice nurses, nurse practitioners, physiotherapists, and Aboriginal and/or Torres Strait Islander Health Workers through the new Occasions of Care Explained and ANalysed (OCEAN) study: University of Sydney (2025). Similar large-scale studies have been conducted on community pharmacies in the US to inform Medicaid pricing: Shoemaker-Hunt et al (2020). These data could be collected from a representative sample of community pharmacies each year, and the dispensing fee updated to reflect changes in technological efficiency, medicine complexity, and patient mix. Pharmacy participation should be mandatory, as a condition of receiving PBS payments.
Where cost data reveal a type of dispensing that is significantly more or less expensive and unevenly distributed across pharmacies, IHACPA should set an additional targeted fee. This may include compounded medicines,96Compounded medicines are more labour-intensive to dispense than ready-prepared medicines and are concentrated among specialist pharmacies: Cooper et al (2025). Without a targeted fee, these pharmacies would be systematically undercompensated. complex or dangerous medicines, or in-person dispensing as opposed to online.
We estimate that expanding IHACPA’s role to include community pharmacy would cost about $9.8 million per year, with any necessary primary data collection adding a further $3.3 million a year.97See Appendix D for the methodology used to estimate these costs.
Implementing this change will require amending the National Health Act 1953 to give IHACPA responsibility for advising on community pharmacy dispensing fees.
4.4 A better approach to protecting sector viability
Setting fees that cover costs is the best way to ensure the sector as a whole is financially viable. Instead, the government gives the sector a blanket revenue guarantee. Rural subsidies take the same unfocused and wasteful approach, providing extra funding whether a pharmacy needs it or not.
Policy should focus on the real goal: maintaining patient access to medicines. Financial viability should be actively monitored using administrative tax data to identify pharmacies that genuinely need support, and make sure they get it.
4.4.1 Replace a blanket guarantee with targeted support
Community Pharmacy Agreements guarantee a total amount of pharmacy remuneration. Under the current agreement, it is $24.6 billion over five years.98Department of Health, Disability, and Ageing and Pharmacy Guild of Australia (2024, Table 2). This includes the Additional Community Supply Support payments but excludes funding for pharmacy programs.
That funding is locked in through the payment adjustment mechanism (Box 5). If there are fewer scripts than expected, the fees paid for each script are adjusted up, to ensure pharmacies still receive the promised total. And the opposite is true if there are more scripts than expected. This reduces the risk of unexpected government spending while securing pharmacy income.
The goal of ensuring pharmacies can viably and safely dispense medicines is legitimate, but the payment adjustment mechanism is the wrong instrument, for four reasons.
First, it is skewed in pharmacies’ favour. If prescription volumes exceed forecasts by more than 10 per cent, fees are reduced to claw back the overpayment. But if volumes fall short by any amount – even by 1 per cent – fees are increased to make up the shortfall.99Pharmacy Guild of Australia (2024a). Taxpayers have got the short end of the stick.
Second, locking in funding five years in advance makes it difficult for the system to respond to changing circumstances, such as improvements in efficiency driven by technological advances.
Third, the payment adjustment mechanism compensates all pharmacies equally regardless of individual circumstances. Dispensing volumes will not fall uniformly – some pharmacies will have increases, others decreases – yet the mechanism adjusts remuneration sector-wide, meaning pharmacies who haven’t suffered any adverse impacts will benefit alongside those who have.
Fourth, even where dispensing volume does fall, viability is not necessarily threatened. Pharmacies with high margins or strong non-dispensing revenue (Box 3) can absorb modest volume reductions without any risk to survival.
Instead of guaranteeing a fixed pot of money to the sector regardless of need, the government should monitor viability and respond accordingly. It should use existing administrative tax data to assess pharmacy profitability across location types, ownership models, and pharmacy formats. If parts of the sector are struggling, affected pharmacies should be able to seek support if they provide additional financial information demonstrating genuine need. But support should be provided only if a closure would leave a community without equitable and adequate access to medicines. If that can be achieved by other pharmacies in the area, or by online dispensing, additional support should not be provided.
Box 5: The Community Pharmacy Agreement payment adjustment mechanism
The seventh Community Pharmacy Agreement introduced a payment adjustment mechanismaDepartment of Health and Aged Care (2022). This is referred to as the remuneration adjustment mechanism in the seventh Community Pharmacy Agreement, but we have referred to it as the payment adjustment mechanism here for consistency. to keep total pharmacy payments broadly in line with the amount agreed. Roughly once a year, forecast prescription volumes were compared with actual dispensing volumes. If the difference was too large, pharmacy remuneration was adjusted to offset the gap.bDepartment of Health and Pharmacy Guild of Australia (2020, pp. 37–40).
Over the life of the seventh Community Pharmacy Agreement, the payment adjustment mechanism identified only one required adjustment: a $0.21 reduction in the Commonwealth Price, scheduled to take effect on 1 July 2024. However, this change was never implemented because the seventh Community Pharmacy Agreement was terminated early and superseded by the eighth.cSee Box 2. For a detailed explanation of the calculations involved in the payment adjustment mechanism, see ANAO (2024, Appendix 7).
The eighth Community Pharmacy Agreement updated the payment adjustment mechanism, which also incorporated the new payments for 60-day dispensing. Adjustments are now made every six months rather than annually, making the mechanism more responsive, and the tolerance band for payment adjustments has been widened in pharmacies’ favour.dDepartment of Health, Disability, and Ageing and Pharmacy Guild of Australia (2024, p. 26).
4.4.2 Payments to support struggling pharmacies should be better targeted
The government already provides some targeted funding to support the viability of pharmacies through the Regional Pharmacy Maintenance Allowance (RPMA). This program distributed $48 million to pharmacies in 2024-25.100Department of Health, Disability, and Ageing (2026i).
But the RPMA is poorly targeted. Eligibility depends on the remoteness of the pharmacy – as defined using the Modified Monash Model101The Modified Monash Model classifies regions from 1 (metropolitan) to 7 (very remote) based on geographical remoteness and town size: Department of Health, Disability, and Ageing (2025g). RPMA funds are available from category 3 (large rural towns) and increase with remoteness. – and its dispensing volume, with more funds available to pharmacies that are more remote and dispense fewer prescriptions.102Pharmacy Programs Administrator (2025a). There are two problems with this.
First, the Modified Monash Model is a poor guide to profitability. It groups areas by remoteness, but this can mask significant variation within categories. For example, two regional pharmacies classified identically may face vastly different infrastructure, connectivity, and local economic conditions.103See, for example, Murray City Country Coast GP Training (2021).
Second, dispensing volumes are also an imperfect guide. While higher volumes reduce per-prescription costs through economies of scale, profitability is also determined by other cost structures, such as non-dispensing revenue.
These funds would be better directed toward pharmacies that are genuinely unprofitable and operating in under-served areas.
A harder problem arises in areas where no pharmacy can viably operate in the first place. In these areas, the government should take a more active role in commissioning pharmacy services directly.
One way to do this is a reverse auction: pharmacies submit applications demonstrating their proposed business model and the minimum grant funding required to establish a viable service, with the contract awarded to the applicant requiring the least public subsidy.104See Queensland Government (2025). If no bids are received, or only unacceptably costly ones, the government should step in and provide the service directly. All contracts awarded through reverse auctions should be regularly reviewed to ensure they remain competitive. This would ensure that government support is targeted, competitive, and no greater than necessary to deliver access.
5 Unleash competition
Incumbent pharmacy owners benefit from generous and unique protections that limit who can own pharmacies and where they can be located. The result is less competition, and less incentive to improve services and innovate.
5.1 Competition is good for patients
Competition drives lower prices, higher service quality, better access, and faster innovation.
Competing for consumers motivates businesses to reduce costs, improve quality, and find new ways to meet consumer needs.105The productivity boom of the 1990s and early 2000s was driven in large part by deregulation and pro-competition reform: Bruno et al (2023). Competition also promotes new business models, unlocks new sources of capital, and attracts managers with skills that existing businesses may lack.
As this chapter explains, evidence from pharmacy markets overseas shows the benefits of competition.
5.2 Location rules benefit pharmacy owners, not patients
Strict rules in Australia dictate where new pharmacies can open.
The Guild claims these rules encourage pharmacies to set up in under-served areas.106Pharmacy Guild of Australia (n.d.[c]). In practice, they shield pharmacy owners from competition while doing little to improve people’s access to pharmacy services.
5.2.1 New pharmacies are blocked from opening
The first Community Pharmacy Agreement in 1990 included a major boon for existing pharmacy owners: strict regulations stopping new pharmacies setting up shop nearby.107Department of Community Services and Health (1990, pp. 10-11). Box 6 summarises these rules.
A decade later, the National Competition Policy Review of Pharmacy recommended these rules be abolished.108Wilkinson (2000). Despite many subsequent reviews also recommending their removal, the rules have not only been retained but enshrined in federal legislation.109Location rules are now codified under the National Health (Australian Community Pharmacy Authority Rules) Determination 2018. For examples of reviews recommending their removal see: National Commission of Audit (2014), Harper et al (2015), Productivity Commission (2017), and Productivity Commission (2023).
Today, applications for new pharmacies are submitted to the Australian Community Pharmacy Authority, which makes a recommendation to the Secretary of the Department of Health, Disability, and Ageing.110Department of Health, Disability, and Ageing (2026j). A recommendation is necessary for approval, but an application can still be rejected even after being recommended.111Ibid.
Location rules also prohibit any new pharmacy that can be accessed through a supermarket.112Department of Health, Disability, and Ageing (2026j).
These rules stop new pharmacies being opened, shielding existing pharmacies from incentives to better serve patients. The King Review received numerous reports of pharmacists wanting to open pharmacies but being unable to because of location restrictions.113King et al (2017a).
Box 6: Rules on the location of new pharmacies
Generally, a new pharmacy must be at least 10km from the nearest approved pharmacy. But there are exceptions:aDepartment of Health, Disability, and Ageing (2026j).
– A pharmacy can be within 1.5km of another if it is within 500m of either a full-time prescribing medical practitioner and a supermarket with at least 1,000m2 of leased area, or a supermarket with at least 2,500m2 of leased area.
– A pharmacy can be in the same town as another if it is 200m from the nearest pharmacy in town and 10km from any other pharmacies. There must also be four full-time-equivalent prescribing medical practitioners and supermarkets with at least 2,500m2 of leased space.
– A pharmacy can be established in a small shopping centre if the centre has no other pharmacies and is 500m from another pharmacy.
– A pharmacy can be established in a large shopping centre, depending on how many the centre already has.
– A pharmacy can be established in a large medical centre if the medical centre operates for 70 hours a week and has eight full-time-equivalent PBS prescribers. The medical centre must also be 300m from the nearest pharmacy.
So why are there still pharmacy clusters? Some areas have many pharmacies because they existed before location rules were introduced, or because there are many medical practitioners, shopping centres, and supermarkets nearby.
5.2.2 Scrapping location rules can bring benefits
In the late 1990s and early 2000s, several European countries removed regulations on pharmacy locations, including Norway, Iceland, Ireland, and the Netherlands.114Vogler et al (2014).
Deregulation consistently led to a substantial increase in the number of pharmacies.115Australia would probably see a smaller increase in pharmacy numbers, because many European countries had very low pharmacy numbers before deregulation. In the three years after the rules were removed in Norway in 2001, 128 new pharmacies were established (nearly double the number established in the previous nine years).116Anell (2005, p. 13). In Iceland, the number of pharmacies rose from 43 to 61 in the two years after deregulation.117Deregulation occurred in 1996. There were 43 pharmacies in 1997 and 61 in 1999: Hämeen-Anttila et al (2025, Table 2).
In Australia, the Guild claims the location rules are required for a well-distributed geographic spread of pharmacies, especially outside major cities.118Pharmacy Guild of Australia (2015).
International evidence does not support this. After deregulation, more pharmacies open in urban areas, but rural areas benefit too.119Anell (2005) and Rudholm (2008). In Norway, the number of local government areas without pharmacies reduced after location rules were removed.120Anell (2005). The number of pharmacies in Reykjavik, Iceland, grew by 67 per cent within two-and-a-half years of deregulation, but pharmacy numbers also increased by 17 per cent in the rest of the country.121Ibid (p. 12).
There is some evidence that deregulation improves convenience for patients beyond simply increasing the number of pharmacies. Pharmacy opening hours increased in some countries after deregulation.122Vogler et al (2012) and Vogler et al (2014). In Norway, despite lowering the required hours for pharmacies, average opening times increased by two hours.123Econ Analyse (2004, pp. 47–48). Accessibility in Norway also improved through innovations spread by the newly formed pharmacy chains.124Rather than handing in prescriptions to be collected later, patients increasingly had them dispensed while they waited, and self-service sections for over-the-counter medicines were near-universal: Econ Analyse (ibid, pp. 48–49).
The evidence on prices is more mixed, indicating either no effect or some price declines from deregulation.125The most widely cited systematic reviews analyse Sweden, England, the Netherlands, Ireland, and Norway: Vogler et al (2012) and Vogler et al (2014). This section does not include Sweden because it had a very different form of deregulation (transitioning from a nationalised to a privatised system). These reviews also do not include Iceland and Portugal, which are included here. In general, studies of deregulation on prices focus on over-the-counter medicines because prescription medicine prices are strictly determined.
In Ireland, the Netherlands, and Norway, there is evidence that prices for over-the-counter medicines – those not requiring a prescription – did not meaningfully change after deregulation.126Ireland revoked the establishment rules for opening new pharmacies in 2002; the Netherlands abolished restrictions on the establishment of new pharmacies in 1998. The study is based on annually tracking the highest and lowest observed prices for three medicines (paracetamol, ibuprofen, and aciclovir) after deregulation. While this measure finds some increases in the highest or lowest observed price for some of these medicines, it is not strong evidence of overall increases: Vogler et al (2006). In Norway, there is additional evidence from an independent evaluation that deregulation did not lower prices.127Norway removed restrictions on location and ownership of pharmacies in 2001. These findings are based on voluntary surveys of 130-to-140 pharmacies from 1999 to 2002 and on compulsory surveys of 22 pharmacies in 2003 and 2004. They find that a basket of 10 common over-the-counter medicines increased in price after deregulation, but that this increase was no faster than the rate of increase pre-deregulation and was probably not caused by the regulation changes: Econ Analyse (2004, pp. 73-74, 89–90). In England, there is evidence that supermarket pharmacies, which increased in number due to changing regulations, offered over-the-counter medicines at lower prices, but there no evidence of over-the-counter price reductions elsewhere.128In 2005, England relaxed its restrictive rules on establishing pharmacies by exempting certain new pharmacies, including large supermarkets. The assessment of this policy in 2010 used price-differential analyses between different pharmacy types based on compiled price data from pharmacies. It found that supermarket pharmacies were about 10 per cent cheaper than independents on pharmacy-only medicines: DotEcon (2010, pp. 94-103).
In Iceland, it was reported that prices for patients, including for prescription medicines, fell after deregulation, but little measurement of these decreases.129Iceland removed restrictions on location and ownership of pharmacies in 1996. The only concrete available finding is that the pharmaceutical factor in the Icelandic CPI fell by about 20 per cent after deregulation: Almarsdóttir et al (2000, p. 110). Anell (2005) describes the co-payment discounts offered by new pharmacy chains after deregulation, but notes these were confined to urban areas with greater competition and applied to patients’ co-payments rather than medicine prices. The government subsequently raised co-payments in 1997 to reduce government spending of medicines. There is stronger evidence from Portugal that allowing new pharmacies lowered the costs of over-the-counter medicines in areas where new pharmacies set up.130In 2005, Portugal allowed over-the-counter medicines to be sold in outlets other than pharmacies. Using price data on five popular over-the-counter medicines for all Lisbon retailers at three points in time (2006, 2010, 2015), Moura and Barros (2020) found supermarkets charged 20 per cent less and that pharmacies near supermarkets reduced prices by 4-to-6 per cent in response.
The Australian picture looks more promising. The interim report of the King Review found that pharmacies in urban areas with high competition were much more likely to discount medicines (in the limited circumstances where discounting was allowed).131King et al (2017a, Figure 8).
On balance, greater competition in Australia should lower prices.
5.2.3 Location rules do not improve access to pharmacies
The strongest argument for location rules is that they increase access to pharmacies in rural areas. But the rules were not designed for that purpose, evidence that they achieve it is weak, and other policies would do the job better.
The rules were not designed to increase rural access
One argument for location rules is that they protect access to pharmacies, particularly in rural areas.132Pharmacy Guild of Australia (2017a). But that was never their purpose.
Before 1990, very small pharmacies were clustered in urban areas.133In 1988, 25 per cent of pharmacies were within 100m of another pharmacy and 62 per cent were within 1km of another pharmacy: Department of Health (2014, p. 6). This was the result of a dispensing fee structure that paid higher rates to smaller pharmacies, creating an incentive to stay small.134Ibid (p. 6).
To reduce the oversupply of small, inefficient pharmacies, the government flattened the dispensing fee across all pharmacies and offered payments to pharmacies to close or amalgamate. From 1990 to 1995 – when payments were offered – there were 630 pharmacy closures and 64 amalgamations.135Department of Health (ibid, p. 13) and Department of Community Services and Health (1990).
Location rules were introduced to complement these payments. They were designed to stop a new pharmacy opening up in the same spot the government had just paid another to leave.136Jackson et al (2023a).
The policies aimed to reduce an oversupply of pharmacies in cities, not boost access elsewhere.
There is little evidence that location rules boosted rural access
Since then, location rules have been repositioned as an incentive for pharmacies to open in regional and rural areas.
The Guild points to independent analysis showing that, after the rules took effect, pharmacy numbers fell in cities and rose in smaller centres.137Pharmacy Guild of Australia (2017a, p. 16). That comparison is misleading. Urban pharmacy numbers fell because the government stopped paying extra for small, inefficient pharmacies, and paid urban pharmacies to close. Growth in rural pharmacy numbers outside cities was modest, and in line with population growth.138From 1990 to 2014, the number of people per pharmacy in major cities increased sharply, from 2,892 to 3,997. Outside of major cities, there were a similar number of people per pharmacy before and after location rules (3,773 in 1990 and 3,893 in 2014): Lange and Franzon (2016, Tables 5 and 6). These data are limited because they do not capture hours, size, or convenience of pharmacies.
Pharmacies can be trusted to pick viable locations
An even weaker claim is that location rules ensure pharmacies are commercially viable when they set up.139Pharmacy Guild of Australia (n.d.[c]). Otherwise, goes the argument, pharmacies would cluster and compete each other into closure.
But this logic applies to any retail business, and no other sector (including in healthcare) is regulated this way. Operators are trusted not to set up where they cannot sustain themselves, and when new entrants do compete with incumbents, consumers benefit: prices fall, quality improves, and product ranges expand.140See, for example, the analysis by Gravelle et al (2016) of competition among GP clinics.
There are better ways to improve access
Even if location rules did improve access, they are far from the best tool for the job. The Guild regularly touts that 96 per cent of Australians in capital cities and 74 per cent outside of capital cities live within 2.5km of a pharmacy.141Westpac and The Pharmacy Guild of Australia (2026) and Pharmacy Guild of Australia (2025b). This is a meaningful sign of access. But equivalent shares of Australians live within 2.5km of a GP clinic.142Grattan analysis found that in capital cities, 96 per cent of Australians live within 2.5km of both a GP clinic and pharmacy, while outside capital cities 73 per cent are within 2.5km of a GP and 72 per cent within 2.5km of a pharmacy. Access is measured as the straight-line distance from populated Mesh Block centroids to the nearest GP and pharmacy, so figures are approximate: ABS (2022) and Geoscience Australia (2024). This mirrors, but may not exactly replicate, analysis commissioned by the Guild, as only a short summary of its methodology is public: Macroplan (2023).
The government supports GP access with workforce incentives and rural subsidies. These tools target the real constraints on rural healthcare: small populations and difficulty attracting staff.143See Department of Health, Disability, and Ageing (2025h). Grattan has argued these subsidies should be better targeted: Breadon and Chapman (2026). But even imperfectly targeted, they address the underlying problem more directly than entry restrictions, and do not impose nationwide constraints on competition.
Pharmacies that provide an essential service in places that cannot sustain a normal business should be supported directly. Chapter 4 sets out how. Direct support can improve access to medicines without constraining competition across the whole sector.
5.3 Rules on pharmacy ownership are poorly designed
Australia’s ownership rules restrict who can own a pharmacy and how many they can own. Neither restriction is needed.
5.3.1 Ownership rules aren’t needed for quality and safety
In Australia, only registered pharmacists are allowed to have a financial stake in a pharmacy.144These requirements are in state and territory legislation. See: Australian Medical Association (2021). There are some minor exceptions to this rule. In some jurisdictions non-pharmacist immediate family members can have minority shares in a pharmacy with their relative who is a registered pharmacist: Hattingh (2011). About 115 of the 6,000 current pharmacies are owned by non-pharmacists through organisations known as ‘friendly societies’: Australian Friendly Societies Pharmacies Association (2023). Friendly societies are member-owned, not-for-profit societies that were established to provide affordable pharmaceuticals to members in the 19th and 20th Centuries. Friendly societies are not allowed to own pharmacies in the ACT: Australian Friendly Societies Pharmacies Association (ibid). This rule is ostensibly to ensure pharmacies prioritise the care and well-being of patients over profits, but it is not an effective way of ensuring high quality service.145Pharmacy Guild of Australia (2024b).
Australians access many healthcare services in their daily lives: GPs, optometrists, dentists, and specialists. Other businesses also provide advice on potentially dangerous goods and services (such as car mechanics and hardware stores). None of these services have ownership rules.
Similar ownership regulations for dental practices were removed from 2010,146Australian Dental Association (2025). and there is no evidence that the quality of care declined.
There is also no evidence that pharmacies owned by non-pharmacists (those owned by friendly societies) provide service that is less ethical or professional.147Harper et al (2015, p. 180).
Ownership restrictions are unnecessary because Australia already has regulatory frameworks designed to ensure high standards.148Pharmacists are required to accord with professional registration requirements administered by the Pharmacy Board of Australia under the Australian Health Practitioner Regulation Agency. Pharmacists can also be assessed against the Professional Practice Standards set by the Pharmaceutical Society of Australia: Pharmaceutical Society of Australia (2023) and Pharmaceutical Society of Australia (2021). These standards apply regardless of who owns the pharmacy. And removing ownership rules would not affect registration and accreditation requirements for people working as pharmacists.149Removing ownership requirements would make it easier for one person to own both the pharmacy and the GP clinic in the same medical centre. This is currently possible only where the owner is a pharmacist, since pharmacists can own GP clinics but not vice versa. Such co-ownership could increase incentives to over-prescribe, and should be monitored by professional standards bodies and through the quality and outcomes monitoring framework proposed in Chapter 7. If prescription rates are higher in jointly-owned businesses, the Australian Competition and Consumer Commission should advise on potential remedies.
5.3.2 Ownership rules aren’t stopping market concentration
State rules also limit one person to having a financial interest in no more than six pharmacies.150Some states have a less generous limit of four or five, while the NT and ACT do not have any limit: ACCC (2024, pp. 11-12).
In theory, ownership restrictions oxygenate a pharmacy sector where competition is choked off by restrictive location rules. Location rules may reduce (or entirely remove) the chance that any individual pharmacy faces competition from another but, to balance this out, ownership limits aim to stop a few businesses from dominating the sector and potentially using their market power to the detriment of patients.151Pharmacy Guild of Australia (2024b).
In practice, ownership limits do not prevent market consolidation, and so Australia has both significant corporate concentration and limited local competition. The ways that large corporations coordinate independently-owned stores are described in Box 7.
About 60 per cent of community pharmacies are part of a banner group, and most are in one of the four large groups (Figure 5.1).152ACCC (2024, p. 7). These businesses also represent a disproportionately large part of the market. The Productivity Commission has cited 2018 estimates that the then four major banner operators held a 73 per cent market share.153Productivity Commission (2023, Volume 1, p. 33). That is a similar market share to that held by the big four banks.154The big four banks (Commonwealth Bank, Westpac, NAB, and ANZ) had a 72 per cent market share in 2023: ACCC (2023, p. 1).
Figure 5.1: The four major banner groups make up nearly half of all pharmacies
Approximate proportion of pharmacies under each banner group
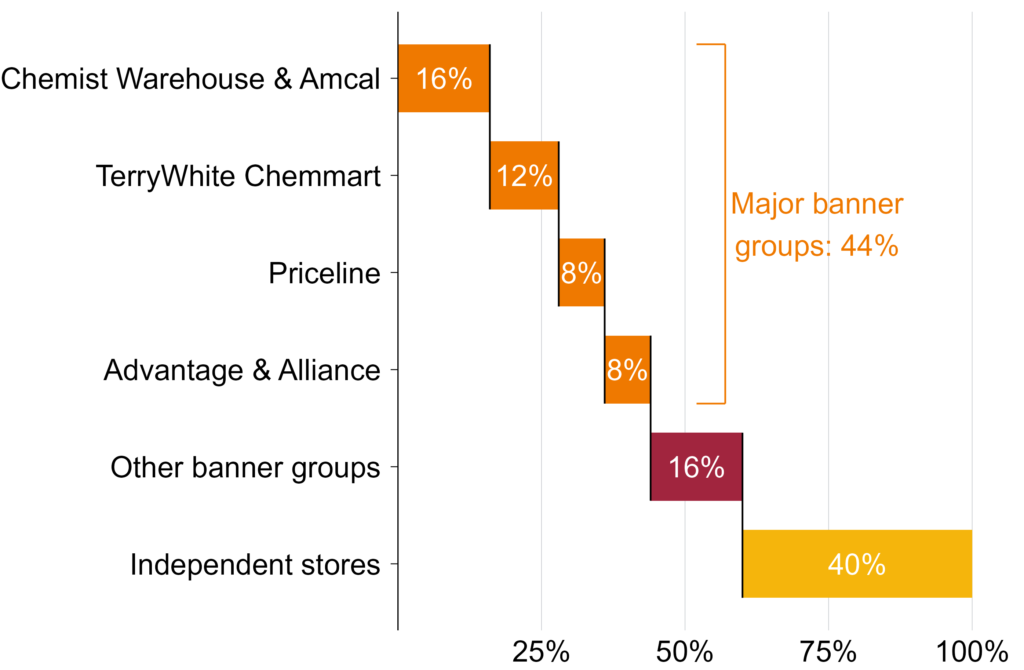
Notes: Banner groups are represented here by the most notable brands, but most banner groups also operate lesser known brands. Reported proportions reflect all pharmacies under all brands of the banner group. Proportions are approximate. Chemist Warehouse and Amcal brands are owned by Sigma, which also owns MyChemist, Discount Drug Store, and PharmaSave.
TerryWhite Chemmart brand is owned by EBOS, which also owns Cincotta Discount Chemist, Good Price Pharmacy Warehouse, and healthSAVE.
Priceline brand is owned by Australian Pharmaceutical Industries (API), which also owns Soul Pattinson and Pharmacist Advice.
Advantage and Alliance brands are owned by Independent Pharmacies of Australia (IPA), which also owns Chemist Discount Centre.
Source: ACCC (2024).
Banner groups typically have standardised purchasing, customer experience, pricing frameworks, loyalty programs, and promotional campaigns. That reduces the scope for innovation and competition.
Many franchises take this further with strict conditions on how pharmacies can operate. In 2021, current and former Priceline Pharmacy owners took their banner group operator to court for exerting excessive control over how pharmacies operated.155LaFrenz (2021). Separately, the Australian Competition and Consumer Commission determined that Chemist Warehouse probably has a ‘particularly strong’ level of control over its franchise stores.156See ACCC (2024). Most Chemist Warehouse franchisees are also shareholders in the parent company: Sigma Healthcare (2024, p. 182). While there are no data available on the extent to which pharmacies within the same banner group compete with each other, these indicators suggest they are more coordinated than competitive.
The result is a sector where ownership is nominally dispersed but competition is constrained.
In addition, loopholes in personal ownership restrictions allow expansive empires.
The number can be stacked across family, friends, and business partners.157Harper et al (2015, p. 180). For example, four key managers of Sigma (owner of Chemist Warehouse) and their families had an ownership interest in 182 franchisee pharmacies in 2025.158Sigma Healthcare (2025, p. 66).
The limits are set at a statewide level, which does little to encourage competition in regional areas that have few pharmacies. For example, of the four pharmacies in Broome, WA, in 2017, three were owned by the same group.159Martin (2024, p. 182).
This misguided and ineffective policy should be replaced. Protections should move from counting the number of stores someone owns to tracking measures of market power, and managing threats to a competitive sector. Chapter 7 shows how.
Box 7: Buyers, banners, and franchises
The pharmacy sector is shaped by three overlapping forms of collective organisation:aACCC (2024) and Victorian Pharmacy Authority (2019).
– Buying groups negotiate the cost of medicines and products with wholesalers or manufacturers. By pooling their purchasing power, member pharmacies can secure lower costs. Members of a buying group typically remain independent and do not share common branding.
– Banner groups are networks of individually owned pharmacies under the same brand. Banner group owners provide a range of services to member stores, which may include advertising, pricing systems, and lease management. Banner groups can be, but are not necessarily, franchises.
– Franchises are a form of banner group. Under a franchise agreement, a franchisor provides services such as branding, advertising, corporate systems, stock management, and pricing frameworks to an individual pharmacy, which in return agrees to operate on the franchisor’s terms.
5.4 Supermarket pharmacies would be good for patients
Location and ownership rules, taken together, rule out a model of pharmacy retail that is normal overseas: supermarket pharmacies.
In Australia, supermarkets cannot own pharmacies, and pharmacies cannot be located in or accessible through a supermarket.160Department of Health, Disability, and Ageing (2026j).
The pharmacies-in-supermarkets model works elsewhere. In the UK, supermarkets dispense prescriptions through hundreds of in-store pharmacies that provide the same suite of clinical services as standalone community pharmacies.161Mortimer and Grimmer (2019). Also see, for example, Tesco (n.d.). In Canada, the three largest grocery businesses run in-store pharmacies.162Pukhov et al (2026). New Zealand retains pharmacist-ownership rules broadly similar to Australia’s, but allows pharmacies inside supermarkets.163New Zealand Medicines and Medical Devices Safety Authority (2025). See, for example, Woolworths (n.d.). In these countries, patients can get their medicines while picking up groceries for dinner.
The Guild’s strongest argument against this reform in Australia is about market power: the Coles-Woolworths supermarket duopoly should not, it says, be allowed to dominate the community pharmacy sector.164Pharmacy Guild of Australia (2016a). Large supermarkets could, in theory, amass significant market share and use it to squeeze suppliers and, eventually, raise prices or reduce service quality for patients.165Notably, the suppliers for prescription medicines are large wholesalers and multinational pharmaceutical companies, who also hold significant negotiating power.
But international evidence suggests there is a low risk of aggressive supermarket expansion.
Supermarket-owned pharmacies make up about 5 per cent of community pharmacies in the UK.166Tesco, Asda, and WM Morrison operated 723 pharmacies in 2024, of a total of 13,822 pharmacies in the UK: Christie & Co (2024). In Canada, about 15 per cent of pharmacies are embedded in food and mass merchandisers.167In Ontario, 7 per cent of pharmacies are in grocery stores: Pukhov et al (2026, Table 2). Both of these countries have less concentrated supermarket sectors than Australia.168Elias (2024, Figure 1a). But in New Zealand, which has a more concentrated sector, Woolworths only has about 40 in-store pharmacies (less than 4 per cent of pharmacies).169Asher (2024) and Woolworths (n.d.).
Supermarket pharmacies that use their economies of scale to pass savings onto patients should be encouraged. Potential harms to consumers from concentrated market share should be monitored and addressed if needed, but do not justify blanket ownership restrictions.170Supermarket pharmacies may offer some medically important services such as methadone dispensing and needle exchange programs at lower rates than other pharmacies. In Ontario, only 1 per cent of supermarket pharmacies dispense methadone or Suboxone, versus 8 per cent of independents: Pukhov et al (2026, Table 2). If supermarket pharmacies meaningfully reduce access to these services for patients, these services should potentially be required as a condition of operation.
Pharmacists working in supermarket pharmacies are bound by the same registration, ethical, and professional obligations as any other pharmacist. International evidence suggests that patients trust and get good service from supermarket pharmacies.171There is limited data on supermarket pharmacy quality, but the most recent JD Power US Pharmacy Study found supermarket pharmacies outperform other chain pharmacies on staffing, prescription speed, and patient trust: JD Power (2025).
5.5 Location and ownership rules should be abolished
The location and ownership rules, including those banning supermarket pharmacies, should be removed in favour of more targeted and effective safeguards (see Chapter 7).
Removing these regulations will face strong opposition and require both legislative change and reforms to state and territory policies. If these reforms are blocked, patients and taxpayers should not be left paying high prices due to lack of competition. So, if these anti-competitive protections are not removed, the Independent Health and Aged Care Pricing Authority should reduce the dispensing fee to account for the additional profits pharmacies gain due to the lack of competition.
6 Let pharmacies discount prescriptions
Pharmacies are willing to cut prices, and patients want cheaper medicines, but a tangle of rules blocks discounting. These rules are not needed to ensure quality services and only lead to higher prices.
6.1 Complex rules block discounting
Countries with highly regulated pharmacy margins – as in most of Europe – don’t allow pharmacies to discount what patients pay for prescription medicines.172Patient charges are typically a fixed fee, either a flat fee per item (e.g. England, Austria) or a regulated share of a centrally set price (e.g. Norway). See World Health Organization (2018, Table A5.5). But countries with systems more similar to Australia’s – such as New Zealand and Ontario in Canada – do.173Pukhov et al (2026), Health New Zealand | Te Whatu Ora (2012), and Health New Zealand | Te Whatu Ora (2025b). Australia is unusual in combining unregulated pharmacy profits with complex rules that prevent pharmacies from passing savings on to patients.
In Australia, prescription medicines below the maximum co-payment can be discounted by any amount.
Allowing pharmacies to discount these medicines has produced real savings for patients.174Only general patients receive discounts on under co-payment prescriptions because no medicines are below the concession maximum co-payment. Each year, general patients save about 17 per cent of the cost of these medicines.175Grattan analysis of Department of Health, Disability, and Ageing (2026b) and Department of Health, Disability, and Ageing (2026c). In 2025, these savings were $319 million (or about $3 off every script).176This is a conservative estimate, because when a patient pays additional fees or pays for brand premium, this amount is subtracted from the calculated discount. The data available do not show what proportion of medicines are discounted.
But for medicines that cost more than the maximum co-payment – which make up 69 per cent of all scripts – discounts are heavily penalised or outright prohibited.177Department of Health, Disability, and Ageing (2026a, Table 2a). While two policies technically allow pharmacies to discount these medicines, one policy is being phased out, and the other imposes stiff financial penalties for discounting.
6.1.1 The $1 discount
From 2015, pharmacies were allowed to offer patients up to a $1 discount on PBS medicines above the maximum co-payment.178Department of Health, Disability, and Ageing and Pharmacy Guild of Australia (2015). The primary goal was to increase competition on price.179Department of Health (2015). The discount was supported by discount pharmacies and opposed by the Guild.180Pharmacy Guild of Australia (2019).
The death knell for the $1 discount sounded when the eighth Community Pharmacy Agreement was signed.181Pharmacy Guild of Australia (2024a). From 2025, it was reduced to 10 cents for general patients – going to zero from 2026 – and to 80 cents for concession patients – going to zero from 2029.182Department of Health, Disability, and Ageing (2026e), and Department of Health and Aged Care (2025a).
6.1.2 The discretionary discount
Discounts on medicines that cost more than the maximum co-payment are banned (besides the diminishing $1 discount).183Department of Health, Disability, and Ageing (2026e). That means when the maximum co-payment is reduced, the ban applies to more medicines.
In 2023, the maximum co-payment fell from $42.50 to $30, restricting discounting on many medicines. Previously, a pharmacy could offer any discount on a medicine that cost $40, for example. But after the change, such a medicine was above the new maximum co-payment, so the pharmacy could only offer the doomed $1 discount.
In response, the government allowed medicines priced between the new and old maximum co-payments ($30 and $42.50) to be discounted by any amount. The thresholds have been updated, and now apply to medicines priced between $25 and $51.10.184See Department of Health, Disability, and Ageing (2026e). The original upper bound is indexed based on inflation each year, and the lower bound drops when maximum co-payments are reduced. Unlimited discounts on medicines in that price band might sound like a win for patients, but there is a big catch.
If a pharmacy offers such a discretionary discount, it forgoes the government funding it would otherwise get.185Department of Health, Disability, and Ageing (2022). This gives pharmacies a strong incentive not to discount and, where they do, to limit discounts to cheaper medicines so they give up less government funding. Patients saved $8.8 million from these discounts in 2025, and pharmacies gave up a further $4.3 million in government revenue to offer them.186Grattan analysis of Department of Health, Disability, and Ageing (2026b) and Department of Health, Disability, and Ageing (2026c). See Appendix B for methodology.
As all medicines for concession patients are above the maximum co-payment,187The standard dispensing fees alone – $9.24 for ready prepared and $11.28 for compounded medicines – are higher than the concession patient maximum co-payment. once the $1 discount has been fully abolished in 2029 (see Section 6.1.1) it will be impossible to discount concession medicines.
This deprives concession patients of potentially cheaper medicines.
6.2 Patients are missing out on big savings
Preventing discounting is withholding cheaper prices from patients.
In 2022-23, the $1 discount saved patients about $48 million.188The discount was last fully in place in 2023-24, but these data appear to duplicate the 2022-23 figures so have been excluded: Department of Health and Aged Care (2024a) and Department of Health, Disability, and Ageing (2025i). One in five eligible prescriptions was discounted, with patients saving the full $1 in 98 per cent of cases. The vast majority of savings were for concession patients.189Department of Health, Disability, and Ageing (2025i, Tables 15a and 15b).
In 2025, about 14 per cent of eligible medicines received a discretionary discount and the average saving was $7.72.190Grattan analysis of Department of Health, Disability, and Ageing (2026b) and Department of Health, Disability, and Ageing (2026c). See Appendix B. But the savings could be much greater if pharmacies weren’t penalised for discounting.
About 70 per cent of medicines receiving a discretionary discount were priced within $5 of the maximum co-payment (Figure 6.1).191Concession patients cannot benefit from the discretionary discount. At that price pharmacies surrender at most $5 in government funding. Understandably, as the penalty increases, discounting declines sharply.
Figure 6.1: Pharmacies will reduce their profit to provide discounts, when allowed
Discounts as a share of pharmacy remuneration, by dispensed price, 2025
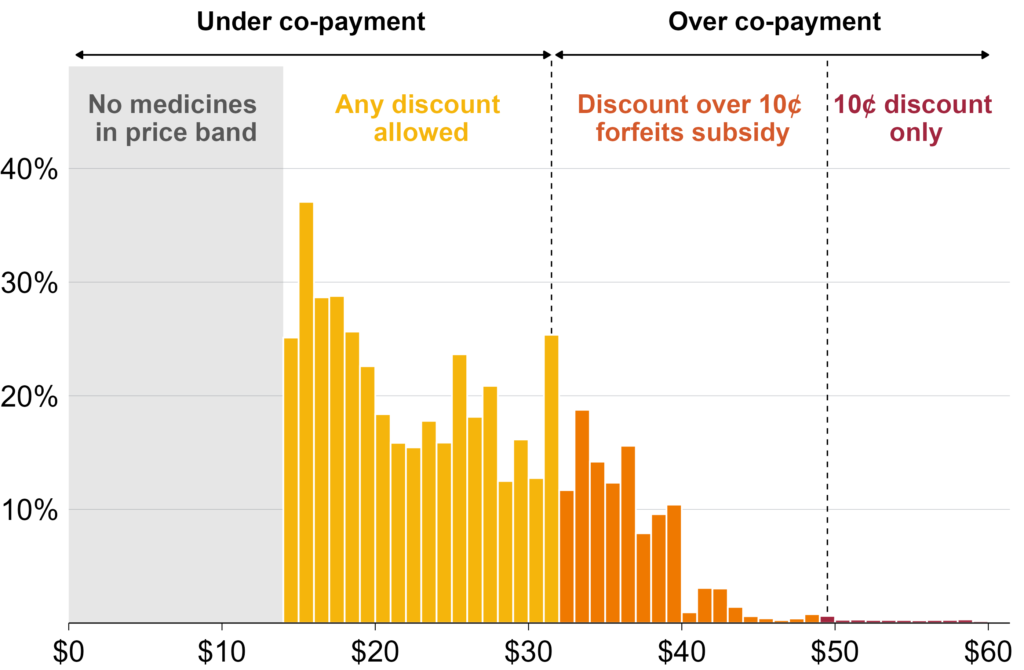
Notes: Pharmacy remuneration is defined as the maximum price a medicine can be sold for minus the price the pharmacy paid for it. Data include only general patients under Section 85 (excluding Section 100 and prescriber’s bag medications) and exclude premium-loaded scripts and Safety Net prescriptions. In 2025, pharmacies could choose from potential discounting options, depending on medicine price:
(1) for medicines below the maximum general co-payment of $31.60, there were no restrictions on discounting;
(2) for medicines priced above $49.50, pharmacies could only discount by 10 cents (the reduced $1 discount); and
(3) for medicines priced between $31.60 and $49.50, pharmacies could choose to either discount by only 10 cents and still receive the government subsidy (equal to the gap between the maximum co-payment and the dispensed price), or discount by more than 10 cents and forgo that subsidy.
Source: Grattan analysis of Department of Health, Disability, and Ageing (2026b) and Department of Health, Disability, and Ageing (2026c). 2025 thresholds from Department of Health and Aged Care (2025b).
If the $1 discount was reinstated, patients might save an additional $32 million a year.192This refers to savings in 2029, after the $1 discount is scheduled to be removed, and is on top of projected savings under the discretionary discount. Higher discount limits could save patients more: a $2 discount might save patients an additional $60 million a year and a $5 discount an extra $137 million a year.193These figures are in 2025 dollars and probably underestimate true savings because they are based on uptake of the discretionary discount mechanism, which requires pharmacies to forfeit government income. See Appendix B. Concession and Repatriation PBS patients collect about 77 per cent of the savings from discounting, because most prescriptions are dispensed to concession patients.
The $1 discount should be reinstated immediately and increased to $5 over the next five years, with full deregulation of discounting after that, subject to advice from the Australian Competition and Consumer Commission.194Once discounting is fully deregulated, the current discretionary discount could be removed. Replacing the discretionary discount would remove current government savings of about $4.3 million per year that come from non-payment of subsidies on discounted medicines.
6.3 The reasons to restrict discounting do not stack up
There are concerns that discounting leads to unfair differences in prices, because discounts are more likely in areas with more pharmacies, and more competition.195King et al (2017b, p. 33). But discounts in one area don’t come at the expense of patients in another.196It is notable that the Guild opposes price discounting on equity grounds but supports the allowable additional patient charge, which is more likely to be levied in regional areas with less competition (see Section 3.2.3).
Another Guild objection is that discount pharmacies operate with lower service levels that can reduce quality and increase professional risks.197Pharmacy Guild of Australia (2024b). The evidence for these claims is inconclusive, at best.198A small 2021 study found that attending a discount pharmacy was associated with lower perceived service quality and medicine adherence: Carter et al (2021). A 2022 meta-study was unable to substantiate a difference in medication adherence rates between the users of independent and chain pharmacies: Nind et al (2022). There also may be factors that make someone more likely to visit a discount pharmacy and less likely to be adherent, such as socio-economic status. Quality must be taken seriously and would be monitored through the safeguards we propose in Chapter 7. But throttling discounting that pharmacies are willing to do, and that saves patients money, is the wrong way to address these risks.
7 Monitor market concentration and quality of care
Removing restrictions on location, ownership, and discounting will lead to more competition. But there is a risk that a few large companies could dominate and use market power to reduce quality or increase cost for patients.
Government can unlock the benefits of competition while avoiding the potential harms of market concentration, and promoting quality care.
7.1 Competition policy should be more targeted
In other countries where the pharmacy sector was deregulated, large pharmacy chains (often vertically integrated with pharmaceutical wholesalers) have established large market shares.199Vogler et al (2014, p. 321). In Norway, three chains controlled about 81 per cent of the pharmacy sector after deregulation.200Ibid (p. 321). In Iceland, three chains accounted for 72 per cent, and in Ireland, 79 per cent.201Hämeen-Anttila et al (2025, Table 2) and Vogler et al (2014, Table 1). But consolidation is not an inevitable consequence of deregulation. After regulations were loosened in the Netherlands, the top three chains held only 20 per cent of the market.202Ibid (Table 1).
Consolidation is also not always harmful. Larger chains can achieve economies of scale, invest in better infrastructure and technology, and pass some savings to consumers. International experience shows that high market concentration is compatible with better access, longer opening hours, and – in some circumstances – lower prices (Chapter 5).
Concentration should be monitored for any negative impacts, such as on pharmacist workloads. But policy should target the harms that consolidation can cause, not consolidation itself.
Competition policy is the best way to prevent harmful effects of market concentration. In 2025, the Australian Competition and Consumer Commission (ACCC) gained new roles and powers to review corporate acquisitions.203ACCC (2025a). They include assessing the cumulative effect of serial acquisitions and requiring approval before firms above certain thresholds complete acquisitions. This increases oversight of consolidation trends, and can help prevent rapid conglomeration.
Overseas, deregulated pharmacy markets consolidated through horizontal integration: existing pharmacies bought or merged with their competitors.204Anell (2005). This is precisely the dynamic the ACCC is well-equipped to police. If a few players try to buy up large slices of the sector, this can be stopped if there is a harm to competition.
Given international experience, the Treasurer should direct the ACCC to do a market study of the pharmacy sector, and report regularly.205For example, the ACCC produces an annual market report of the communications sector. See the 2024-25 version: ACCC (2025b). The ACCC should review consolidation in the pharmacy sector and design appropriate safeguards, potentially including mandatory review of acquisitions, requirements to separate wholesale and retail businesses, or limits on maximum market share.
7.2 It’s not clear how deregulation will affect quality
The effect of increased competition on quality is uncertain. Pharmacies may compete by providing higher-quality offerings to attract patients.206For example, a 2023 study found that high-quality service was more important than price for generating patient loyalty: Carter et al (2023). Alternatively, competition may encourage pharmacies to spend less time with patients to increase turnover.
International evidence suggests workload increases in pharmacies after deregulation, and that pharmacists working in chain and discount pharmacies feel greater pressure to dispense quickly and spend less time with patients.207Rudholm (2008, p. 259) and Vogler et al (2014).
However, anti-competitive protections are an ineffective way to guarantee quality, and there is no evidence they do so. Instead, Australia should implement a new quality and outcomes monitoring scheme.
7.2.1 Improve quality and outcomes monitoring
There is no comprehensive system to measure the quality of community pharmacies in Australia, and the outcomes they achieve. Instead, the only program for assessing pharmacy quality is run by the lobby group representing pharmacy businesses.
Accreditation for pharmacies is exclusively assessed through the Quality Care Pharmacy Program (QCPP).208Quality Care Pharmacy Program (n.d.[a]). The Guild is responsible for developing QCPP standards and governing the scheme, and it partners with private assessors who accredit pharmacies.209Quality Care Pharmacy Program (ibid). The QCPP is seemingly a big earner, with the 2024-25 financial report showing $13.3 million in QCPP income and only $4.2 million in QCPP expenses: Pharmacy Guild of Australia (2025a).
The QCPP should be redesigned to avoid any conflicts of interest.210The Guild has qualified for relevant accreditation with Standards Australia, and the QCPP aligns with the National Safety and Quality Primary and Community Healthcare Standards. The Guild also consults widely in developing the standards and has an impartiality committee to oversee program independence. See: Pharmacy Guild of Australia (2024c), Quality Care Pharmacy Program (n.d.[a]), Quality Care Pharmacy Program (2026), and Pharmacy Guild of Australia (2024d). The scheme should instead be governed by the Australian Commission on Safety and Quality in Health Care, with standards developed by the Pharmaceutical Society of Australia. Multiple organisations should be approved to accredit pharmacies’ compliance with these standards.211Currently only Ernst & Young provides assessors: Quality Care Pharmacy Program (n.d.[b]). These changes would align pharmacy accreditation practices with those for GP clinics: Australian Commission on Safety and Quality in Health Care (2026).
Australia should comprehensively measure pharmacy quality.
The QCPP has limited scope and does not provide data on outcomes. It focuses primarily on whether pharmacies have the required policies, equipment, and systems in place.212Pharmacy Guild of Australia (2016b). It does not track specific data on quality or outcome indicators.213Ibid. In October 2026, the QCPP will transition to the Quality and Safety Pharmacy Program (QSPP), but this will not substantially change the program.214The QSPP will have four domains of assessment rather than five and will focus more on pharmacy services, rather than mainly on dispensing: Quality Care Pharmacy Program (n.d.[a]) and Quality and Safety Pharmacy Program (2026).
The QCPP has included a ‘mystery shopper’ component to assess the quality of dispensing.215Pharmacy Guild of Australia (2012). This involved random assessment visits conducted by a contracted mystery shopper, accompanied by a QCPP representative. This program assessed compliance with the sale of schedule two (pharmacy only) and schedule three (pharmacist only) medicines – not prescription medicines.216Ibid.
Several countries have developed quality measurement regimes for community pharmacies, with varying designs and results (Table 7.1). Their experience points to three clear lessons: indicators must measure what matters, tied payments can distort pharmacy behaviour, and public information holds pharmacies accountable.
Table 7.1: Examples of pharmacy quality monitoring schemes
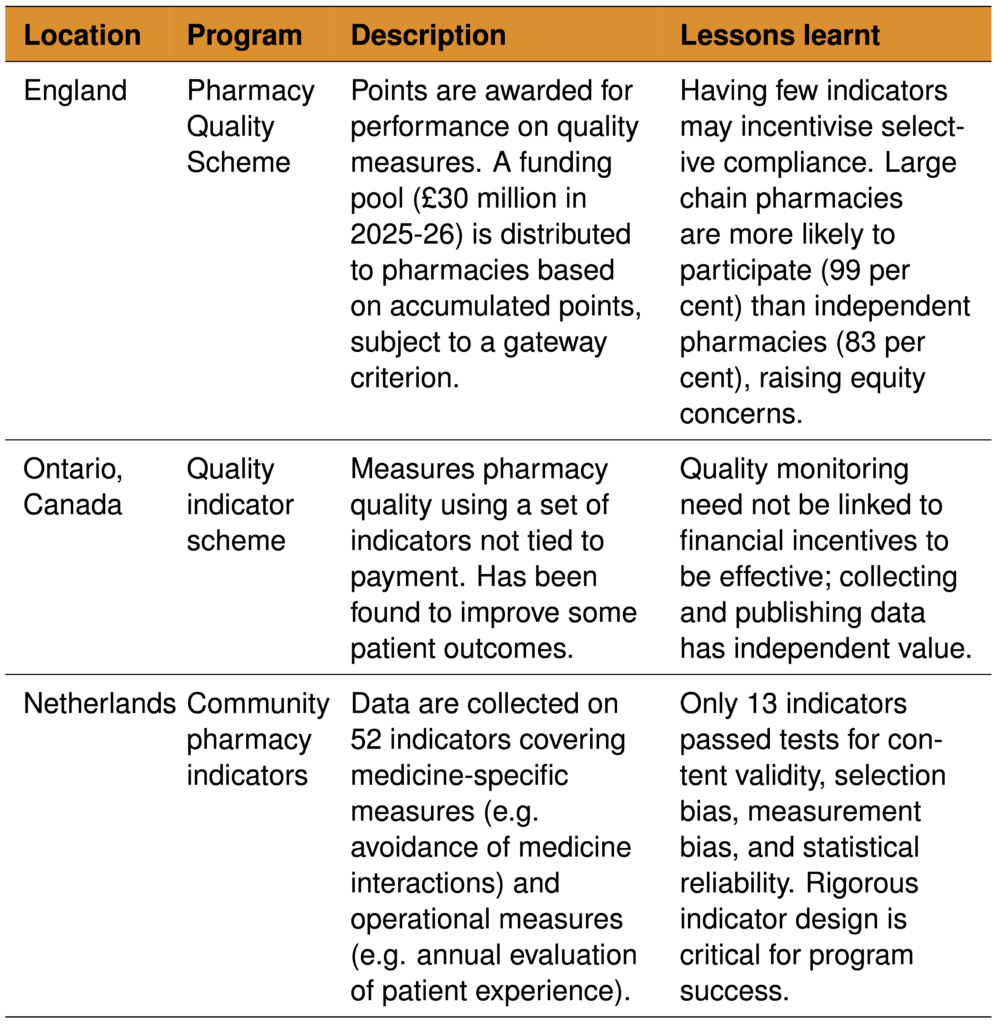
Sources: NHS Business Services Authority (2026), Schafheutle et al (2025), Torabi et al (2025), and Schoenmakers et al (2015).
Australia should use these lessons to design a system that tracks the quality of pharmacy dispensing and services, and monitors patient outcomes.
Many of these indicators could be built from existing linked administrative data.217This could include PBS dispensing records, Medicare Benefits Schedule (MBS) claims, and hospital data. See AIHW (n.d.). These data could track medicine adherence, problematic polypharmacy, and dispensing of contraindicated medicines.218Contraindicated medicines are those that should not be taken because a medical condition, or another medicine the person is taking, would make them potentially harmful. Drawing on existing data, rather than requiring new reporting, would reduce costs and increase accuracy. Some potentially valuable indicators, such as patient reported outcome measures, would require additional data collection from pharmacies.
We estimate this scheme would cost about $6.4 million to set up, with ongoing costs of about $1.7 million per year.219See Appendix D for the methodology we used to estimate this.
Over time, transparent reporting would help improve care and inform patient choice. It would also enable the government to monitor whether different types of pharmacy are providing lower-quality care.220This would require linking patients’ PBS and MBS administrative data to the pharmacy that dispensed their medicines.
8 Ensure services are good value
Pharmacists are medicines experts, with the skills to do more than just dispense medicines. Community pharmacies offer a growing range of services, and the sector is advocating to do more – which could provide accessible healthcare and take pressure off other providers.
But services have not been immune from the failures of community pharmacy governance. Reform is needed to ensure that services are governed appropriately, and that two of the biggest services, MedsChecks and dose administration aids, provide value-for-money and get to the patients who need them most.
And trials here and overseas show government should be cautious about funding new pharmacy services. Among new services, only prescribing for uncomplicated urinary tract infections is ready to roll-out.
For other promising services, government should build the evidence base by funding rigorous, independent trials designed to measure cost-effectiveness. These include care for other minor ailments, oral contraceptive prescribing, smoking cessation, and collaboration with GPs on chronic disease management for specific conditions.
The government should also embed pharmacist expertise in general practice by funding integrated non-dispensing pharmacists in GP clinics and Aboriginal Community Controlled Health Services.
8.1 Pharmacies offer important services beyond dispensing …
Federal, state, and territory governments fund pharmacies to provide a range of services beyond dispensing, and the scope of these services has grown over time.221Jackson et al (2023b, p. 9).
For example, pharmacies have become a cornerstone of Australia’s vaccination program since the COVID pandemic, now delivering 26 per cent of adult flu vaccinations, up from almost none a decade ago.222Hull et al (2025, Figure A8). See also Patel et al (2024). Patients value the convenience and accessibility of pharmacist vaccination, and there is evidence it can increase vaccination rates.223Spinks et al (2020), Le et al (2022), and Isenor et al (2016).
And pharmacies play an important role in harm minimisation for drug users through opioid pharmacotherapy, needle and syringe programs, and take-home naloxone – evidence-based services that have been shown to reduce drug-related harms.224Nielsen et al (2017), Kwon et al (2012), and University of Queensland (2022).
Pharmacies may also choose to provide other services, such as informal health advice or health checks.225These services are currently provided without government funding or oversight. As discussed later in this chapter, specific services that have been shown to be effective and cost-effective should be formalised with government-regulated pricing and quality monitoring.
8.2 … but services are poorly managed
Funding and rules for most pharmacy services are set in the Community Pharmacy Agreements.
Under the current agreement, for the first time, some services are moving into a new Pharmacy Programs Agreement. This is being negotiated with the Pharmaceutical Society of Australia. Other services will remain in the eighth Community Pharmacy Agreement.226Butler (2025).
It is a positive development that the Pharmaceutical Society is involved. But negotiation is not the right way to decide how health services are chosen, designed, and funded. As with dispensing fees, negotiating service funding with industry groups risks paying too much (see Chapter 4).
Negotiation has also led to services diverging from evidence-based models, under pressure from the Guild.227For example, a diabetes management and assessment service was successfully trialled in Australia under the third Community Pharmacy Agreement. But during negotiations for the fifth Community Pharmacy Agreement, the Guild instead secured funding for Diabetes MedsChecks, which had much less evidence of value, hadn’t been tested in Australia, and didn’t include the training, credentialing, or repeat consultations required by the original service: Yong et al (2021, p. 3). See also Hermansyah et al (2017, p. 10).
And currently, there is no consistent requirement that pharmacists communicate service outcomes to a patient’s GP or the government.228Deloitte was commissioned to review the effectiveness and cost-effectiveness of some existing pharmacy services under the eighth CPA, and in doing so noted that a lack of data on expenditure, output, and outcomes meant they could not measure health-system or economic benefits: Deloitte Access Economics (2025). This risks fragmenting and duplicating care, and also reduces oversight of pharmacy services.229For example, MedsChecks require pharmacists to put together an Action Plan and provide it to the patient – but this could simply mean handing them a paper form, even if they recommend changes to prescriptions that would need to be made by the patient’s doctor.
These services should be treated as the important health services they are, and governed accordingly. Program rules should be set independently, rather than through negotiated agreements.230This is already the case for some other community pharmacy programs, such as vaccination. And the Independent Health and Aged Care Pricing Authority (IHACPA) should be given responsibility for determining prices.
The government should not sign the first Pharmacy Programs Agreement until these governance arrangements are in place. For pharmacy services that remain in the eighth Community Pharmacy Agreement, this transition should take place when that agreement expires.
The government should also expand the ‘Sharing by Default’ requirement to encompass pharmacy services, requiring pharmacists to upload documentation of their consultation and recommendations to a patient’s My Health Record.231A patient’s My Health Record is a secure online portal through which the patient, and healthcare providers they give permission to, can access key patient health records. Currently, providers and patients can choose whether they upload results. ‘Sharing by Default’ legislation, due to take effect from July 2026, will require providers to upload all pathology and diagnostic imaging results to a patient’s My Health Record. There are limited exceptions, such as for patients who don’t have a My Health Record or don’t provide consent: ADHA (2026).
And, to enable evaluation and outcomes monitoring, the government should link service data for pharmacy services to other administrative data.232The Pharmacy Programs Administrator already collates service data including patients’ Medicare numbers, which would enable linkage to other data sources such as the National Health Data Hub: see Pharmacy Programs Administrator (2025b) and AIHW (n.d.). My Health Record data isn’t currently available for secondary uses, such as research and public health, but work is underway to change this: Department of Health, Disability, and Ageing (2024g). When it becomes available for these purposes, this should also be linked.
8.3 Some existing services are poorly targeted or mispriced
Spending on some of the biggest services – medication reviews and dose administration aids – has grown substantially over the past 15 years (see Figure 8.1).
But despite technology reducing costs, and worrying evaluation findings in that period, governments have not reformed these services to ensure they are effective and good value.
Figure 8.1: Australia is spending more than ever on dose administration aids and MedsChecks
Expenditure, adjusted for inflation
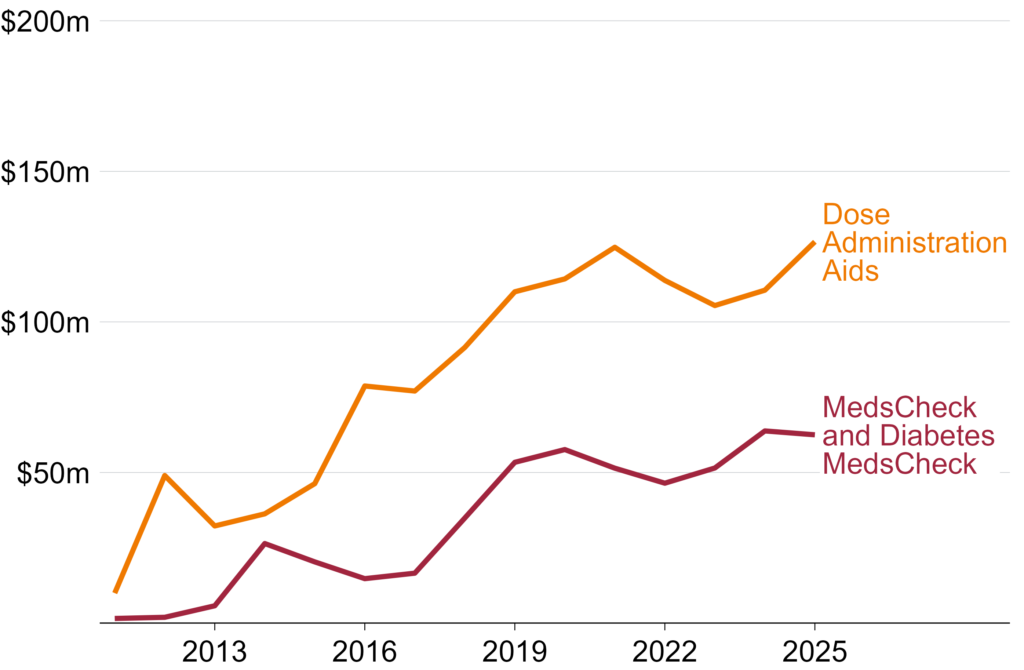
Notes: Expenditure has been inflated to March 2026 dollars using the Consumer Price Index: ABS (2026a). Years refer to financial year (e.g. 2024-25 is shown as 2025).
Source: Table 18 of the PBS Expenditure and Prescriptions reports from 2011-12 to 2024-25, available at Department of Health, Disability, and Ageing (2025j), though table numbers vary across editions.
8.3.1 MedsChecks are poorly targeted
The federal government pays pharmacies to deliver MedsChecks and Diabetes MedsChecks: brief, one-off medication reviews.233A medication review is a structured assessment of all of the medicines a patient is taking, intended to identify issues, optimise medicine use, and improve health outcomes: Rose et al (2020).
Almost a decade ago, a review of these services by the Medical Services Advisory Committee234MSAC is an independent scientific advisory committee that provides evidence-based advice to government to inform funding decisions about new medical services, including their safety, clinical effectiveness, and cost-effectiveness: Department of Health, Disability, and Ageing (2024d). found there was not enough evidence to demonstrate their effectiveness or value-for-money.235MSAC (2017). But MedsChecks have been retained in two subsequent Community Pharmacy Agreements, costing taxpayers a further $356 million.236Captures expenditures on MedsCheck and Diabetes MedsCheck services between June 2019 and December 2025: Department of Health, Disability, and Ageing (2025k). Past years’ expenditure has been inflated to March 2026 dollars using the Consumer Price Index: ABS (2026a).
Subsequent international evidence shows that some medication review services in community pharmacies are cost-effective. But they have tighter eligibility, more intensive service models, and stricter requirements for GP collaboration than Australia’s MedsChecks.237Dawoud et al (2019) and Price et al (2023).
MedsCheck eligibility criteria are broad and open to interpretation. To be eligible, a patient must take five or more prescription medicines, have recently had a significant medical episode, or be taking high-risk medicines.238Pharmacy Programs Administrator (n.d.).
These criteria don’t ensure services are provided to patients with high risk of medication-related harm. There is still no evidence that medication reviews with criteria this broad are cost-effective.239A recent scoping review shows that targeting interventions aimed to address problematic polypharmacy using a count of medicines taken is too broad: Tsang et al (2024). An older systematic review similarly found limited evidence to show that medication reviews were effective, and suggested that this reflected commonly used selection criteria, such as polypharmacy or age, being insufficient to identify patients with a genuine risk of medication-related harm that a medication review might avert: Huiskes et al (2017). And because Australian pharmacies can offer MedsChecks opportunistically and are paid per service, they have an incentive to deliver more services regardless of patient need.
When the program was launched, claims quickly exceeded expected volumes, and there were reports of pharmacy chains pressuring staff to conduct as many MedsChecks as possible.240ANAO (2015) and Metherell (2014).
To deal with surging costs, the government introduced caps on MedsChecks. Currently, each pharmacy is able to claim a maximum of 20 services per month.241Pharmacy Programs Administrator (n.d.). After that, they are able to continue providing MedsChecks by charging patients, but don’t receive government funding. This is a blunt way to manage costs, which doesn’t address the underlying targeting problem. The number and needs of a pharmacy’s patients vary, and a cap doesn’t ensure that the 20 services are delivered to the 20 people with the greatest need.
Instead, the government should tighten eligibility in line with international best practice, targeting only older patients with specific conditions.242The Diabetes MedsCheck already has a diagnosis requirement: Pharmacy Programs Administrator (ibid). This should be the case for both MedsCheck services. Pharmacists should use patients’ My Health Record, where available, to assess their eligibility. Innovative approaches, using algorithms to identify patients with certain conditions and a high risk of medication-related harms, could also improve targeting, pending results of an ongoing trial using similar methods in general practice: Spinks et al (2023). International models that have achieved cost-effectiveness target older adults and/or those with specific conditions, such as cardiovascular disease, or diabetes.243Price et al (2023, p. 465). Dawoud et al (2019) also finds that services including medication reviews in community pharmacy settings can be cost-effective, and all of the studies included in their review targeted based on age and/or condition. With these tighter eligibility requirements in place, government should remove the cap for MedsChecks, as well as equivalent caps for Home Medicines Reviews.244Home Medicines Reviews already have more stringent eligibility requirements, including a GP referral, and from 1 July 2027 an additional requirement for patients to have a current Chronic Disease Management Plan is being added: Department of Health, Disability, and Ageing (2025l, AN.0.52). Unlike MedsChecks, expenditure has not significantly increased in real terms in recent years: Department of Health, Disability, and Ageing (2026i) and Department of Health, Disability, and Ageing (2025k).
Pharmacists providing MedsChecks are not required to directly report back to a patient’s prescribing doctor. This reduces the chance that a MedsCheck results in changes to a patients’ prescriptions, probably makes reviews less effective,245Kolhatkar et al (2016, p. 517). and increases the risk of duplicated care. The requirement for service outcomes to be uploaded to My Health Record proposed in Section 8.2 would improve this information sharing, ensuring that the patient and their GP, as well as other healthcare providers, could see and act on MedsCheck recommendations.246The recommendations in this section align with the 2017 MSAC review, which recommended that targeting services to more appropriate patient populations and requiring formal collaboration with GPs and other providers could improve the value of MedsChecks: MSAC (2017).
8.3.2 Dose administration aid prices should be updated
Community pharmacies are paid to pack medicines in dose administration aids, such as Webster-paks,247Webster-paks are a widely used range of dose administration aids, manufactured by Webstercare. for patients who have difficulty managing their medication.248This includes patients with literacy or language issues, physical disabilities, cognitive difficulties, or patients who are taking more than five prescription medicines and have difficulty managing them. Patients must hold a concession card to be eligible. These aids improve medication adherence.249Chaudhri et al (n.d.).
Dose administration aids have been funded under the Community Pharmacy Agreement since 2007.250Haywood et al (2011). Since 2017, pharmacists have been paid a flat fee for each dose administration aid.251Pharmacy Guild of Australia (2017b). Before then, services were funded under a practice incentive payment, with payments made to pharmacies periodically based on the volume of services they provided and the number of prescriptions dispensed by the pharmacy: Health Consult (2016, p. 1). Pharmacies are also able to charge patients a fee for providing a dose administration aid, and there is some evidence to suggest that most pharmacies do. But there is no available data showing if this fee has changed over time, and there are signs that patients have a poor understanding of when they are being charged a fee and how much it is: Aslani et al (2024, p. 9).
But, as with other payments to pharmacies, there is no publicly available evidence to suggest that the current fee reflects the actual cost of providing the service.
The most recent available estimates of the cost of providing a dose administration aid are from 2010.2522010 Evaluation of Dose Administration Aid program, cited in: Health Consult (2016). In one more recent study, pharmacists claimed the average cost was between $10 and $14, depending on packaging type. But this was not independently validated: Aslani et al (2024). A lot has changed since 2010. But, despite some fluctuations, the price that government pays is very similar, after accounting for inflation, to what it was in 2012 (Figure 8.2).
Figure 8.2: The payment per dose administration aid has stayed high despite increasing automation
Expenditure per dose administration aid, adjusted for inflation
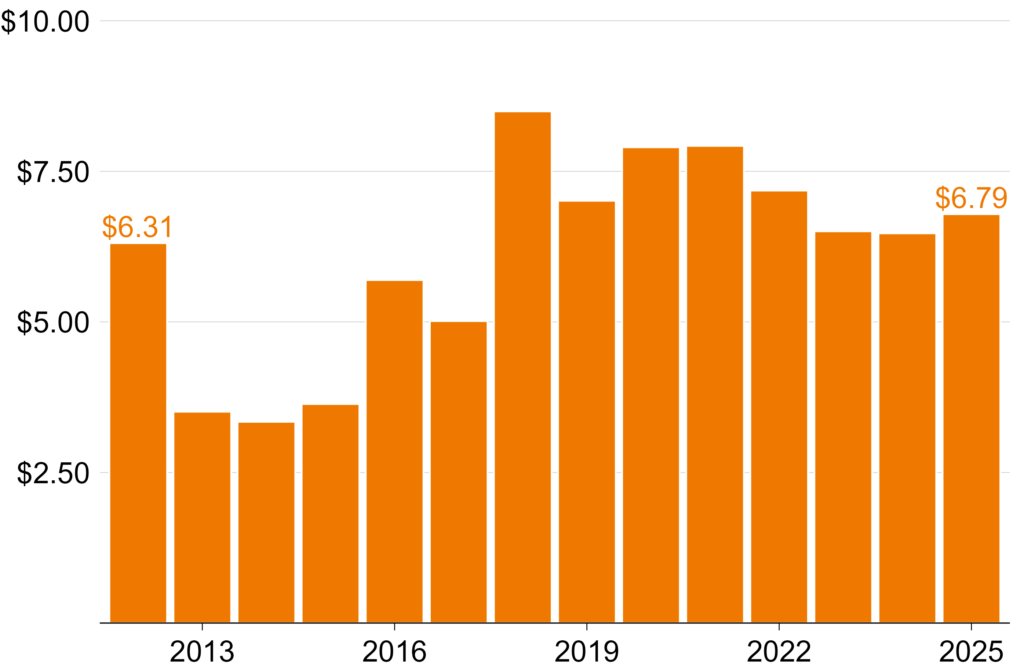
Notes: The structure of payments has changed over time. For comparison purposes, this chart shows total expenditure divided by total services delivered, which may not match other published estimates. Expenditure has been inflated to March 2026 dollars using the Consumer Price Index: ABS (2026a). Years refer to financial year (e.g. 2024-25 is shown as 2025).
Sources: Expenditure data are sourced from Table 18 of the PBS Expenditure and Prescriptions reports from 2011-12 to 2024-25, available at Department of Health, Disability, and Ageing (2025j), though table numbers vary across editions. Service counts are sourced from Department of Health, Disability, and Ageing (2026i) and Department of Health and Aged Care (2024b).
Pharmacies are now allowed to provide up to 90 dose administration aids per month, up from 30 in 2010.253Health Consult (2016) and Pharmacy Programs Administrator (2025b). And there are now a range of automated packing options explicitly advertised as a way to cut packing time and increase profit, so costs have probably fallen over time.254See, for example, Willach Pharmacy Solutions (n.d.) and Omnicell (n.d.).
As with dispensing fees, government should set the fee for a dose administration aid to cover the cost of providing an aid, plus a reasonable profit margin.255See Chapter 4. To do so, it should collect up-to-date data on the cost of providing these services that takes into account increasing scale and automation of packing.
And as with MedsChecks, government should abolish caps on how many dose administration aids services each pharmacy can provide.
8.4 Expanding services seems like a good deal …
The pharmacy industry has called for expansion beyond these longstanding services. The Guild and the Pharmaceutical Society have called for services such as community pharmacy prescribing, diagnosis, and disease management, which are traditionally the remit of general practice. They claim this would take pressure off GPs and improve health outcomes.256See Pharmacy Guild of Australia (2025c) and Pharmaceutical Society of Australia (2026).
At first, the case seems strong. Pharmacists have extensive training and already provide some of these services overseas.257Dineen-Griffin et al (2020b) and Price et al (2023). And community pharmacies are well-located, accessible, and highly trusted.258See Chapter 1.
Against this backdrop, many Australian states are trialling, or permanently expanding, pharmacy services.259All states and territories have either trialled or permanently expanded pharmacy services in recent years, and many have directly funded these services and/or implementation costs, such as training: Pharmacy Guild of Australia (2026b). In 2025-26 alone, Victoria, Tasmania, WA, and SA all announced funding for pharmacist service expansion in their state budgets, totalling $26.6 million: Victorian Department of Treasury and Finance (2025, p. 50), Government of South Australia (2025, p. 41), Premier of Tasmania (2025), and Government of Western Australia (2025, p. 307).
8.5 … but the evidence on cost-effectiveness is sobering
Evidence suggests that pharmacy services are safe and effective.260A 2025 systematic review found that pharmacy prescribing (and associated treatment, testing, and collaboration) had been successfully operationalised internationally, with evidence of clinical safety and patient satisfaction, based on 23 studies published between 2015 and 2025: Clemens et al (2025, p. 19). A recent Australian rapid review about community pharmacist prescribing, commissioned by the Royal Australian College of General Practitioners, found little strong evidence about clinical, cost, or safety outcomes – but this review was limited to only primary studies published between 2021 and 2025: Raghunandan et al (2026). Consumers also find pharmacy services convenient, and express high satisfaction.261Health New Zealand | Te Whatu Ora (2024) and Victorian Department of Health (2025). But evidence about the cost-effectiveness of pharmacy services is weak.262Lewis and Williams (2023), Sanyal and Husereau (2020), Sanyal and Husereau (2019), Paudyal et al (2018), Ou et al (2024), Ayorinde et al (2013), and Gudka et al (2013).
Government should only fund health services that are good value-for-money in the context of the broader health system. With rising demand for care, and government budgets under strain, this is more important than ever. And even where patients pay for services directly, government should still consider if those services are cost-effective.263It is difficult for patients to assess the necessity or quality of the services they are offered by a pharmacist. And pharmacies are heavily subsidised by government. Government should ensure this platform isn’t used to promote services which aren’t evidence-based, so patients aren’t left paying for services that aren’t beneficial.
Systematic reviews show mixed results for cost-effectiveness of extended-scope pharmacy services.264Dawoud et al (2019), Price et al (2023), and Phimarn et al (2023). See Appendix C for a summary of the evidence. Findings vary significantly by type of service, health system context, and implementation approach.265Sanyal and Husereau (2020), Sanyal and Husereau (2019), Price et al (2023), and Newman et al (2020). They suggest that some services are more effective and cost-effective than others, and point to specific risks to achieving value.
8.5.1 Community pharmacy services face risks to value
International evidence shows that pharmacy services can duplicate GP care, with the government (and possibly also the patient) paying twice.266This can occur where pharmacists are unable to fully resolve a patient’s health concern (see, for example, Gauly et al (2025)), or where protocols require pharmacists to refer patients with specific symptoms onto GPs (see, for example, Amador-Fernández et al (2022)).
And the community pharmacy setting increases the risk of low-value care. Usually an appointment isn’t needed, so patients may seek care for issues that would have resolved on their own.267This has played out overseas. A Spanish randomised controlled trial showed that people receiving pharmacy minor ailment services didn’t get better more often or more quickly than people who didn’t get the service: Amador-Fernández et al (2023). And fee-for-service funding encourages pharmacies to provide more services, even if they aren’t necessary (see Section 8.3.1). There is international evidence that when the same provider both prescribes and dispenses medicines, they prescribe more, and more expensive, medicines.268For example, Austrian GPs who gained the right to dispense medicines from an in-house pharmacy showed a 9.2 per cent increase in antibiotic dispensing rates, with the change driven by prescribing behaviour rather than patient mix: Stacherl et al (2023). English GPs in dispensing practices are more likely to prescribe higher-cost medicines even where there is no clinical evidence that those medicines are better than cheaper alternatives: Goldacre et al (2019). And when Taiwan introduced reforms separating prescribing and dispensing roles, medicine expenditure and prescribing volumes both fell: Chou (2003).
The cost-effectiveness evidence in Australia is also weak, and shows mixed results.269Much of our evidence comes from the Pharmacy Trials Program, a range of large, government-funded trials, including for chronic disease management, medication management, and screening and referral. The program was designed to generate an evidence base about cost-effectiveness, and the findings were not promising: Department of Health (2019) and Department of Health, Disability, and Ageing (2023b). Of the eight services trialled, the Medical Services Advisory Committee didn’t support any that were based in community pharmacy: Department of Health, Disability, and Ageing (2023b). There are reasons community pharmacy services might be less cost-effective here than overseas: a poor track record of managing existing services, broader health system problems, and emerging alternatives that may offer better value.
There has been sustained funding for poorly targeted and mispriced services in successive Community Pharmacy Agreements, despite independent reviews (see Section 8.3). That suggests new services are likely to be poorly designed and badly implemented.
The wider context matters too. Australia’s health system is fragmented and relies heavily on fee-for-service payments.270Breadon et al (2022). The incentives and information gaps this creates make duplication between pharmacy and GP services more likely.
And cost-effectiveness must be assessed against the alternatives, some of which have momentum. Designated registered nurses now have expanded prescribing powers.271In 2025, a new registration standard for designated registered nurse prescribers was introduced: Nursing and Midwifery Board of Australia (2025). Significant investment and reform is focused on urgent care centres and multidisciplinary general practice, including pharmacists working in general practices.272Urgent care clinics were introduced as a pilot program in 2023 and were made permanent in the 2026 Budget: Butler (2026a). The 2023 Budget funded Primary Health Network commissioning of multidisciplinary teams and increased Workforce Incentive Payments to encourage multidisciplinary primary care, and Minister Mark Butler has signalled commitment to further reform: Commonwealth of Australia (2023, p. 148), Butler (2024a), and Butler (2024b). If they prove cost-effective, the case for providing overlapping services in community pharmacies will get weaker.
8.6 Focus on the most promising new services
Given weak evidence and risks to value-for-money, the federal government should take a cautious and selective approach to expanding community pharmacy services. Only one proposed new service type – prescribing for uncomplicated urinary tract infections (UTIs) – has a strong enough evidence base to justify rolling it out at scale.
8.6.1 Fund pharmacists to treat uncomplicated UTIs
Government should fund pharmacists to treat uncomplicated UTIs in women aged 18 to 65, including through prescribing antibiotics.273‘Uncomplicated’ UTIs occur in people who are otherwise healthy and have a normal urinary tract. UTIs in males, older people, pregnant women, children, and people with specific risk factors require further investigation: Jarvis et al (2014). This has been shown to reduce overall costs and improve access to care.274A recent, high-quality evaluation of pharmacist prescribing for uncomplicated UTIs shows that the service is cost-effective. The PATH-UTI study estimates that the service could reduce total federal and state expenditure on care for uncomplicated UTIs in NSW by up to $4.6 million per year. But this estimate does not take into account the costs of training or implementation. See Dineen-Griffin et al (2026a). The evidence for this service is strong, but does not prove that other services will also be cost-effective.275PATH-OC was a trial of oral contraceptive repeat prescribing run at the same time as PATH-UTI. It was a much smaller trial and so was unable to produce the same level of high-quality evidence of cost-effectiveness. The study finds a much bigger saving, but this is more uncertain: Dineen-Griffin et al (2026b). The third arm of that study, on skin conditions, is yet to be released.
In funding pharmacists to treat uncomplicated UTIs, government should enable pharmacists to provide PBS prescriptions, subsidise services for concession card holders, and introduce caps on how much pharmacists can charge patients for a consultation, based on independent IHACPA pricing. Trials have shown that, without these settings in place, pharmacy services are disproportionately accessed by wealthier patients.276Under the PATH-UTI and PATH-OC trials, where most patients didn’t have to pay a consultation fee, but did have to pay the full cost of their medicine, services were disproportionately accessed by women from wealthier areas and with higher levels of education: Dineen-Griffin et al (2026a) and Dineen-Griffin et al (2026b).
We estimate that this would cost up to $2 million per year, if government chose to cover the cost for all eligible patients.277This number assumes that uptake is 13 per cent among all Australian women aged 18 to 65 who experience a UTI, and that pharmacies are paid $21.52 per consultation, based on Dineen-Griffin et al (2026a), but the actual price should be independently determined by IHACPA. The government may choose to require all, or some, patients to pay a co-payment, which would reduce the cost to government. See Appendix D for further detail about how we’ve costed this service.
8.6.2 Fund trials to test other services
Other pharmacy service types don’t yet have enough evidence to justify making them permanent. But some are promising enough that government should invest in large-scale trials, with carefully designed safeguards, to test their cost-effectiveness in the Australian context.278The federal government has announced a trial of subsidised pharmacy services, due to commence on 1 January 2027: Butler (2026b). This trial should be used to test cost-effectiveness, as described in this section. Currently, the scope of the trial is care for UTIs, and contraceptive prescribing for female concession card holders aged 18 to 55. But given the strong evidence base for UTI care, the government should not focus there, and instead use this opportunity to trial other services.
The services the government should focus on are: prescribing for other minor ailments beyond uncomplicated UTIs, oral contraceptive prescribing, smoking cessation, and chronic disease management for specific conditions such as diabetes and hypertension (see Box 8). International evidence suggests they are safe, effective, and probably cost-effective.279See Appendix C for a summary of cost-effectiveness evidence. Similar services have been safely implemented overseas: Wu et al (2021), Clemens et al (2025), and Chisari et al (2025). Early findings from Australian trials also suggest they are safe and can be implemented here.280See, for example, Victorian Department of Health (2025) and Nissen et al (2022).
Services without enough evidence to justify a large-scale government-funded trial include: screenings for chronic diseases or risk factors, and lifestyle change services for weight loss or reduced alcohol use.281See Appendix C for a summary of the evidence.
Box 8: Promising services that government should trial
Minor ailments services, which involve consulting with a patient, making a diagnosis, and potentially prescribing for minor, short-term ailments.aThis commonly includes conditions such as impetigo, mild plaque psoriasis, shingles, nausea, hay fever, and minor wounds.
Pharmacists are generally required to follow a protocolbe.g. the protocol for shingles in Queensland: Queensland Health (2025). outlining which data they must collect, medications they can prescribe, and risk factors that trigger referral for further assessment and treatment.cThis differs from ‘standard of care’ prescribing arrangements, which allow medical practitioners (such as GPs) to flexibly exercise clinical judgment based on available evidence: Mesbahi et al (2025).
Prescribing oral contraception, which similarly involves consulting with a patient, following a protocol, and where appropriate either initiating or continuing a prescription.
Smoking cessation services, which involve education, advice, and pharmacotherapy to help patients quit smoking.
Chronic disease management services, which focus on:
– Specific conditions, including diabetes and hypertension.
– Specific functions, such as education, medication management, repeat prescribing, and monitoring.
– GP collaboration, requiring a referral or periodic review.
See Appendix C for a summary of the evidence.
Get trials right this time
There have been more than 20 government-funded trials of new community pharmacy services in Australia over the past decade.282This includes trials under the Pharmacy Trials Program: Department of Health, Disability, and Ageing (2023b), and a range of state and territory government trials. But almost none provided the information needed to expand, or rule out, new services.283MSAC assessments of previous pharmacy trials have identified small size, insufficient data collection, and inappropriate comparators as barriers to conclusive clinical and cost-effectiveness findings: MSAC (2023a), MSAC (2022), MSAC (2021a), and Department of Health (2019). See also Raghunandan et al (2026). And many new and ongoing trials appear to be repeating this pattern, focusing on measures of patient satisfaction and safety, without rigorous evaluation of effectiveness and cost-effectiveness.284See, for example, Victorian Department of Health (2025). An exception is the recent PATH-UTI trial, which should be used as an example of what a sufficiently large, rigorous trial design looks like: Dineen-Griffin et al (2026a)
New trials must be different. They should be designed to test specific service models and generate evidence of effectiveness and cost-effectiveness sufficient to inform a health technology assessment.285A health technology assessment is a formal assessment of the safety, effectiveness, and cost-effectiveness of a new health technology or service, designed to provide advice to government about whether it should be government-subsidised: Department of Health, Disability, and Ageing (2025m). The Medical Services Advisory Committee is responsible for health technology assessments of new services. That assessment should be the threshold for introducing a new service into usual pharmacy practice.
That means trials should follow Australian Centre for Evaluation (ACE) and Medical Services Advisory Committee guidelines. ACE should also peer review and approve the trial designs before they start.286See Australian Centre for Evaluation (n.d.) and MSAC (2021b). ACE offers peer review of pre-analysis plans for impact evaluations run by the federal government. These guidelines specify how to choose appropriate patient health outcome measures and how to design a trial and recruitment strategy that minimises bias and facilitates economic analysis.
8.7 Integrated pharmacists are good value
Embedding pharmacists in general practices and Aboriginal Community Controlled Health Services is a different way to have pharmacists provide more services.
Integrated pharmacists don’t directly sell medicines to patients. Instead, they provide medicine reviews, education, and monitoring as part of a patient’s multidisciplinary care team. This includes providing patient services, as well as participating in case conferences and providing advice to other staff.
Integrated pharmacists in primary care are widespread overseas, particularly in the UK and, to a lesser extent, Canada.287Tan et al (2014a) and Sudeshika et al (2023). In England, pharmacists in general practices have been common for more than a decade.288Bradley et al (2018). More than 20 per cent of English general practices employ a pharmacist as part of their multidisciplinary team, for an average of eight hours per week: Chopra et al (2022).
They improve the clinical outcomes for people with chronic disease.289See Tan et al (2014a). The best results were observed where pharmacists spoke directly to GPs, and where pharmacists provided not only medicine reviews but also lifestyle advice, adherence support, and medication monitoring and adjustment.
Integrated pharmacists in general practices have been successfully trialled in Australia.290See, for example, Tan et al (2014b) and Benson et al (2018). And in 2023, the Medical Services Advisory Committee supported public funding for integrated pharmacists in Aboriginal Community Controlled Health Services, following a 15-month trial that found the model was safe, effective, and good value-for-money.291MSAC (2023b).
8.7.1 Integrated pharmacists provide expertise with fewer risks
Integrated pharmacists would increase access to the unique medicines expertise of pharmacists, while avoiding many of the risks from offering services in a community pharmacy, which were discussed in Section 8.5.1.
The duplication risk is reduced because integrated pharmacists have highly collaborative relationships with GPs.292Sudeshika et al (2023). They share a physical clinic, and all the record-keeping and care coordination infrastructure that sits within it.
The risk of low-value care is reduced by locating pharmacists within a clinic, rather than a shopfront. Typically, a patient would be referred to the pharmacist or explicitly make an appointment.293See Tan et al (2014b). A large trial now running in Queensland uses algorithms applied to a patient’s clinic records, alongside their My Health Record, to automatically flag for pharmacist consultation patients who are at risk of medication-related harm. Should this trial’s findings be positive, similar approaches could be expanded to improve targeting of integrated pharmacist services: Spinks et al (2023).
And integrated pharmacists do not have the conflicts of interest that come with a retail setting.
8.7.2 Invest in integrated primary care pharmacists
The federal government should get Primary Health Networks to commission integrated pharmacists in general practices. Primary Health Networks should assess proposals for integrated pharmacists from general practices, make funding decisions informed by their population’s health needs, and support continuing improvement.294Primary Health Networks are already required to conduct regular Needs Assessments using qualitative and quantitative evidence to identify the needs of their region’s population. These form the basis of commissioning decisions: Department of Health (2021a). Primary Health Networks already support continuing improvement for integrated pharmacists through the Aged Care On-site Pharmacy Program: Department of Health, Disability, and Ageing (2026k).
We estimate that this would cost about $57 million per year.295See Appendix D for an explanation of our estimate. This could support about one in every eight Australian general practices (about 900 clinics) to employ a pharmacist for two days each week.296Note that the actual number of clinics and working hours might vary, as Primary Health Networks and general practices identify their specific needs. Our costings are based on two days a week of pharmacist time per general practice, which is equivalent to trials run by the ACT, North Western Melbourne, and South Eastern Melbourne Primary Health Networks: Deeks et al (2018), Ball et al (2021), and South Eastern Melbourne PHN (2024).
The government should also fund the National Aboriginal Community Controlled Health Organisation (NACCHO) to commission the model of integrated pharmacists in Aboriginal Community Controlled Health Services that the Medical Services Advisory Committee supported in 2023, which would cost about $23 million per year.297MSAC (2023b, p. 27).
This could support every Aboriginal Community Controlled Health Service to employ a pharmacist for at least one day each week. At full scale, this would mean an additional 500 pharmacists working across general practice and the ACCHS.298The government should do modelling to plan for the establishment of this workforce, including its implications for the supply of pharmacists working in other sectors. Grattan has previously recommended the establishment of an independent health workforce planning body that could undertake this analysis: Breadon et al (2025, pp. 22–23).
9 Build a better future for pharmacy
Community pharmacy is a crucial part of Australia’s healthcare system, and it will only get more important. Every year, Australia’s population gets older and sicker, new medicines are added to the Pharmaceutical Benefits Scheme (PBS), more scripts are dispensed, and government healthcare spending rises.
Australia has trusted medicines experts in almost every community, available without an appointment. It’s vital that we make the most of them. The reforms in this report would do that. Together, they would build a sector that delivers three things Australians should be able to expect.
The first is affordable medicines.
Patients would stop paying fees that buy nothing. They could get a discount on any medicine, at any pharmacy that wants to compete for their business. And the Safety Net would kick in automatically, so no one misses out on savings they’re entitled to. Taxpayers would pay dispensing fees based on what dispensing actually costs, and get the full benefit of manufacturer discounts.
The second is competition that drives innovation and cuts prices, like it does in the rest of the economy.
New pharmacies could open where patients are. The best operators could grow. Longer opening hours, home delivery, and lower prices would spread because they win customers, not because an agreement allows them. Rural Australians would get guaranteed access to medicines, not subsidies that don’t go where they’re needed.
The third is pharmacists doing more of what they are trained for.
Pharmacists would treat uncomplicated urinary tract infections, with PBS prescriptions and capped fees. Within a few years, rigorous
national trials would settle which other services are worth rolling out at scale. 500 pharmacists would work in general practice and in
Aboriginal Community Controlled Health Services, where the evidence shows their expertise improves care.
With these reforms, the sector will give some things up: guaranteed revenue, protected locations, and fees set by bargaining. But it will get more in return.
Owners would get fees that cover their costs, faster payment for expensive stock, freedom to grow, and targeted funding if they serve communities that can’t sustain a business without government support.
Pharmacists would get a bigger clinical role, in a system that measures and values the quality of their work.
The current Community Pharmacy Agreement expires in mid-2029. Three years is enough time to collect cost data, start trials, legislate competition reforms, and set up quality monitoring. If the federal government acts now, the eighth agreement can be what it should be: the last.
Acknowledgements
This report was written by Peter Breadon, Mia Jessurun, Molly Chapman, and Thomas Shortridge. Jonathon Bolton provided research assistance. The report was edited by Paul Austin.
We would like to thank Philip Clarke, Amjad Alsaeed, and Vinita Fonteyn for reviewing this report, alongside numerous other government and industry participants and officials who reviewed the report or gave input.
The opinions in this report are those of the authors and do not necessarily represent the views of Grattan Institute’s founding members, affiliates, individual board members, reference group members, or reviewers. The authors are responsible for any errors or omissions.
Grattan Institute is an independent think tank focused on Australian public policy. Our work is independent, practical, and rigorous. We aim to improve policy by engaging with decision makers and the broader community.
We acknowledge and celebrate the First Nations people on whose traditional lands we meet and work, and whose cultures are among the oldest in human history.
For further information on Grattan’s programs, or to join our mailing list, please go to: www.grattan.edu.au. You can donate to support future Grattan reports here: www.grattan.edu.au/donate.