Overview
Australia spent $87 billion on public hospitals in 2024. That’s a 50 per cent increase from $56 billion just a decade ago. Yet hospitals are still under strain. Ambulances are ramping outside emergency departments, waits for surgery are getting longer, and staff say they’re burning out.
Demand will only grow as Australians live longer with more chronic disease. Public hospital spending per person will increase by a third in the next decade, from $2,500 to $3,300 each.
Governments will need to spend even more. But budgets are under pressure. Even with tax hikes or cuts to public services, there are limits to what they can afford.
Smarter spending can make every dollar go further. Some hospitals show the way. We estimate the average cost of a knee replacement in Victoria varies by $13,600 between high- and low-cost hospitals, after accounting for many differences between patients and hospitals. In Queensland, the gap is $11,000. In NSW, $9,000.
It’s the same for other procedures, and in every state and territory. If costly hospitals reached the middle of the pack for efficiency in their state, governments would save $1.2 billion every year. That could pay for an extra 160,000 hospital visits.
Cutting costs doesn’t mean cutting quality. There are plenty of opportunities to safely deliver care for less. In England, doctors use AI notetakers to spend less time on paperwork and more time with patients. In Canada, one in three people who get a hip or knee replacement safely go home the same day, freeing up hospital beds.
But Australia’s approach to funding hospitals is broken, and it blocks productivity. State governments set unrealistically low budgets at the start of the year, then bail out hospitals when they run a deficit at the end of the year. The annual rollercoaster makes it harder for hospital leaders to properly plan and invest.
We need a reset. To end budget blowouts and bailouts, funding should be fair and predictable. The federal government’s contribution should rise in line with growing demand for care. But to promote productivity, federal funding should grow a little slower than the growth in costs. And the federal government should pay for temporary solutions for patients stuck in hospital waiting for aged care or disability services.
State governments should set realistic budgets for their hospital systems based on cost and population growth. To get the most out of those budgets, new, more efficient prices for each admission should encourage best practices, such as safe same-day care. The states that adopt more efficient prices should get a more generous cap on funding growth from the federal government.
States should also harness savings from scale by centralising procurement and procedures, and slashing the cost of temporary staff.
Each hospital should get a realistic budget, so it can plan and invest in efficiency. In exchange, states must drive productivity. Scot-free bailouts should end. There should be serious consequences for hospital deficits, including CEOs and boards losing their jobs. But good performers should get three-year budgets, and all hospitals should get support to improve.
Hospitals are too important to be held hostage by bogus budgets. But they need to get more efficient to meet ever-growing demand for care. Governments must solve both problems by giving hospitals the money, support, and incentives they need to spend smarter and provide more care.
Recommendations
The next National Health Reform Agreement should:
Recommendation 1
Make funding fair
- The federal funding cap should be based on realistic demand forecasts and cost growth.
- The pricing authority should review the pricing model to make sure the costs of treating older and more complex patients are covered.
- The federal government should fully cover the cost of patients waiting in hospital for an NDIS package or aged care facility place, including the cost of alternative accommodation.
- The pricing authority should audit cost and clinical data quality.
Recommendation 2
Set productive prices
- Governments should ask the independent pricing authority to develop prices that reflect what care should cost, freeing up at least $1 billion to reinvest in care. After five years, the new prices should be used as the national prices for hospital care.
- The federal funding cap should be adjusted down while there is evidence of substantial avoidable costs. States that adopt the new, productive prices early should be exempt from the deduction.
Recommendation 3
Increase transparency on hospital productivity
- Governments should publish comparable hospital-level data on cost, length of stay, complications, and staffing.
All state and territory governments should:
Recommendation 4
Make hospital budgets fair
- Give hospitals realistic budgets, based on fair estimates of cost and demand.
- Give hospitals with a good track record of financial management three-year budgets.
Recommendation 5
Hold hospitals to account
- Set performance expectations with criteria-based standards, monitor closely, and follow through on consequences including sacking CEOs and boards for unwarranted deficits.
Recommendation 6
Help hospitals improve
- Give hospitals clear advice on improving productivity.
- Fund major productivity transitions, such as new IT systems.
Recommendation 7
Take advantage of scale
- Buy more goods and services in bulk at a state level.
- Cap the wages hospitals can pay temporary doctors and nurses.
- Centralise more procedures in high-volume surgical centres.
Victoria should:
Recommendation 8
Increase transparency on hospital productivity
- Governments should publish comparable hospital-level data on cost, length of stay, complications, and staffing.
1 Hospital spending is high and rising
Public hospital spending in Australia is high and rising fast. Spending pressure will continue to grow as Australians live longer with more chronic conditions, and new treatments are developed.
Hospitals will keep costing more, leaving governments with tough decisions: bigger tax hikes, squeezing other public services, or hollowing out hospitals.
We need to get the best value out of every hospital dollar to ensure Australians can count on getting essential care.
1.1 Public hospital spending is rising fast
Australian governments spend more than $87 billion a year on public hospitals – more than on any other part of the health system.1AIHW (2025a). About 46 per cent of the government health budget goes to public hospitals, up from 40 per cent a decade ago (Figure 1.1).
Figure 1.1: Public hospitals are a large and growing share of health spending
Total government health spending, 2025 dollars
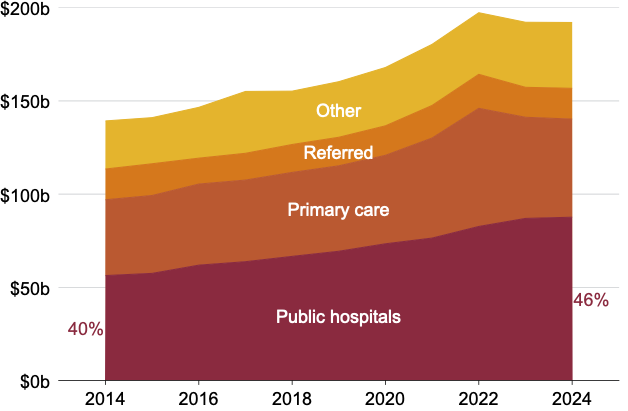
Notes: Federal, state, and territory government spending. ‘Other’ includes private hospital services, research, capital expenditure, medical expenses, and tax rebates.
Source: Grattan Institute analysis of AIHW (2025a).
Spending is growing fast. Real public hospital spending grew by an average of $3 billion, or 4.5 per cent, a year in the past decade.2The spending growth between 2023 and 2024 was the smallest in a decade, but the big increases in spending between 2020 and 2023 remain baked in. For convenience, throughout this chapter, we refer to each financial year based on its end year: for example, 2023-24 is ‘2024’.
The single biggest chunk of public hospital spending – and our focus in this report – is acute admissions.3Acute care accounted for 61 per cent of total public hospital spending in 2024-25: NHFB (2025).
1.2 Cost growth is driving spending growth
Rising costs are the main reason spending is surging. Real cost growth accounted for 58 per cent of the increase in real spending on acute admissions between 2018 and 2023 (Figure 1.2). Population growth accounted for 35 per cent, and 6 per cent was from more hospital use per person.
Figure 1.2: In the past five years, real cost growth has added to spending growth in every state
Average annual growth in real spending
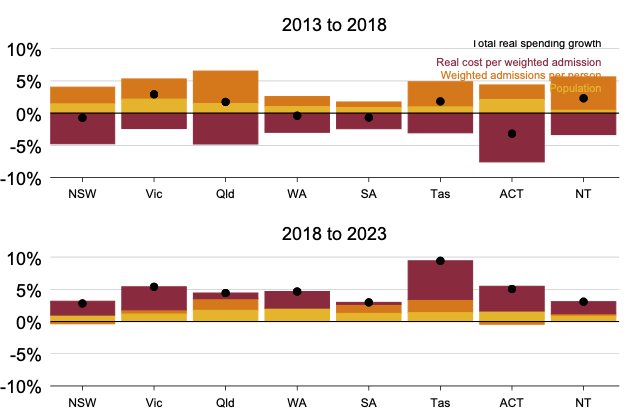
Notes: Based on a Shapley decomposition of total real spending on acute public hospital admissions. The figures for the ACT are for 2018 to 2022, because it did not provide cost and volume data for 2023.
Source: Grattan Institute analysis of ABS (2025b) and Productivity Commission (2025a).
The typical cost of an admission increased from $5,782 in 2018 to $6,451 in 2023.4All figures in this chapter are in 2025 dollars: ABS (2025a). In every state,5In this report, ‘state’ is used to mean state or territory. the real cost per admission increased. Part of this is due to the COVID pandemic, which put pressure on hospital staff and added new infection control practices. But those effects weren’t reversed after the pandemic’s peak. In 2023, real costs grew again, suggesting some costs may now be embedded (Figure 1.3).6Victorian Department of Health (2024a).
Figure 1.3: Real cost growth has made a comeback since 2020
Annual growth in real spending
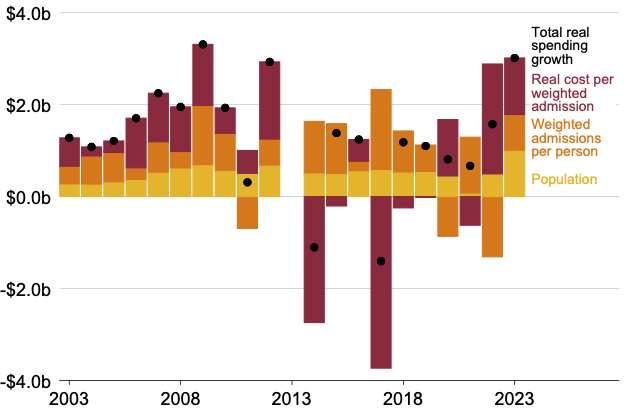
Notes: Based on a Shapley decomposition of total real spending on acute public hospital admissions. 2012-13 is excluded because data collection changes mean it was not comparable with 2011-12.
Source: Grattan Institute analysis of ABS (2025b) and Productivity Commission (2025a).
This is a stark break from earlier trends. Between 2013 and 2018, just after activity-based funding was introduced nationwide (Box 1), the real cost per admission fell in every state (Figure 1.2). This offset growth in the population and intensity of hospital use, moderating overall spending growth.
Staffing costs are the biggest part of public hospital spending, and accounted for more than half of real cost growth between 2018 and 2023 (Figure 1.4). Real salaries haven’t changed much.7The average full-time equivalent salary for public hospital doctors was $267,000 in 2018, and $273,000 in 2024 (in 2025 dollars): AIHW (2025b). For nurses, it was about $128,000 in both 2018 and 2024. The big shift is in patients per worker. The typical doctor, nurse, or administrative employee now covers fewer admissions than they did 10 years ago, even after adjusting for the complexity of admissions (Figure 1.5). This may reflect reductions in legislated nurse-to-patient ratios, increasing use of single-bed wards, and more use of temporary labour, which is not captured in permanent staff numbers (Chapter 9).8Cusack et al (2023), and Tait et al (2024).
Figure 1.4: Staffing accounts for more than 60 per cent of the rise in costs
Increase in real cost per weighted admission between 2018 and 2023, in 2025 dollars
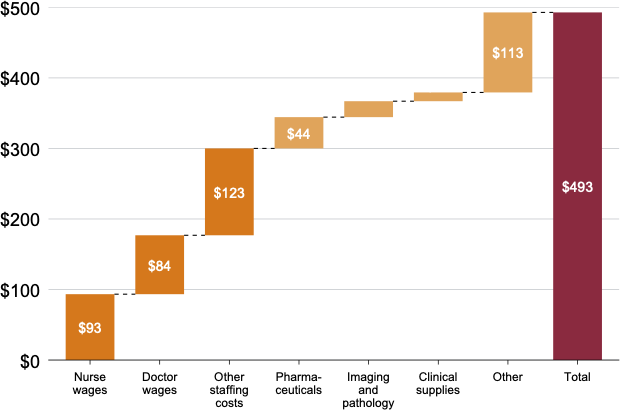
Notes: Average cost per weighted acute admission. ‘Clinical supplies’ includes medical supplies, good and services, and prostheses. ‘Other’ includes depreciation, hotels, patient travel, corporate, blood, and lease.
Source: Grattan Institute analysis of IHACPA (2019) and IHACPA (2023).
Figure 1.5: Most hospital staff look after fewer patients than they used to
Weighted admissions per full-time-equivalent staff member
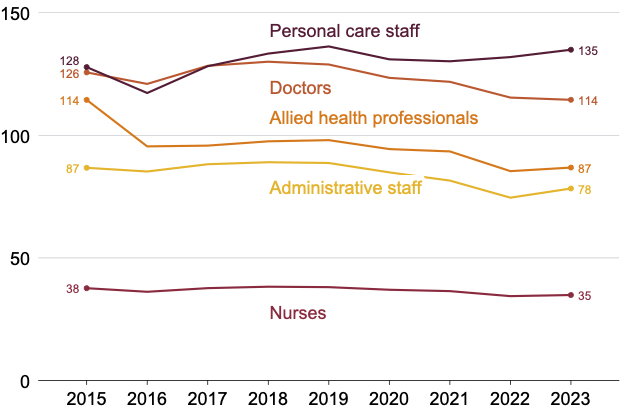
Notes: Allied health professionals include diagnostic professionals. Personal care staff include domestic care staff.
Source: Grattan Institute analysis of AIHW (2025c) and Productivity Commission (2025a).
Other input costs have grown too. Nearly all hospital operating costs rose faster than economy-wide prices in the five years to 2023. Only the costs of medical supplies and prostheses fell in real terms.
Box 1: How public hospitals are funded
‘Activity-based funding’ is the main way public hospitals are funded. This means they get paid a fixed price for similar admissions. For example, in 2025-26, hospitals get $716 for performing dialysis, $17,363 for an intermediate complexity Caesarean delivery, and $209,509 for a heart transplant.
Hospitals that spend more than the fixed price lose money on that admission, while hospitals that spend less make money.
The price paid for a particular admission depends on two things: the national efficient price and the ‘weighted activity units’ assigned to the admission.
The national efficient price and weights are calculated by the Independent Health and Aged Care Pricing Authority using hospital data on admission costs. Lags in data processing mean the estimates comes from three years earlier, indexed up.
The weighted activity units depend on the type and complexity of the admission. The weight is also adjusted for the characteristics of patients (such as a loading for Indigenous patients and children) and the hospital (rural hospitals get more).
If implemented as designed, activity-based funding promotes efficiency.aB. H. Nguyen et al (2024), Biørn et al (2010), and Cavalieri et al (2018). After this funding approach was rolled out nationwide in 2012, average admission costs fell (Figure 1.3).
Governments also spend about $10.5 billion a year on public hospitals outside activity-based funding. This includes block funding for small rural hospitals; teaching, training, and research funding; and funding for highly specialised therapies.bNHFB (2025).
1.3 Smarter hospital spending is increasingly urgent
Hospital demand will only grow in the coming years. If we don’t spend smarter, rising costs may see governments impose reactive, untargeted cuts that hurt hospitals and patients.
1.3.1 There’s no spending respite in sight
Despite the record funding being poured into hospitals, cost and performance pressures are still acute. An ageing population and new treatments will only add to demand.
Wait times for emergency care and elective surgery have worsened in the past five years, adding to pressure for more investment (Figure 1.6).9For example, AMA (2025a). In 2023-24, 67 per cent of people presenting to an emergency department were seen on time: AIHW (2025d). In 2018-19, that was 71 per cent: AIHW (2020). Ambulance ramping – delays in the transfer of patient care from paramedics to hospital staff – has also worsened since COVID: AMA (2025b).
Figure 1.6: Elective surgery waiting times have blown out since COVID
Proportion of patients waiting longer than clinically recommended for elective surgery
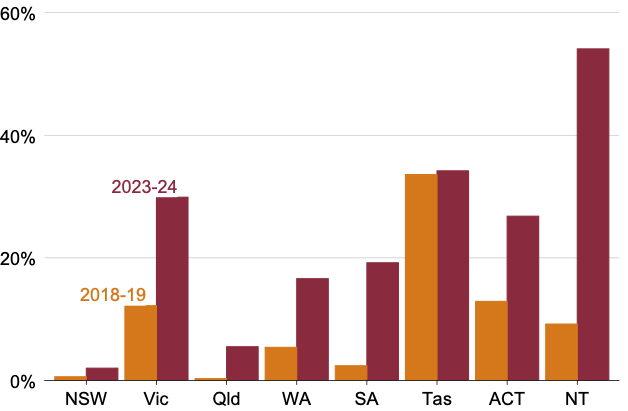
Note: The latest figure for the NT is for 2022-23, because 2023-24 data were not available.
Source: Grattan Institute analysis of Productivity Commission (2025a).
Staffing costs will probably increase. In 2024, the Fair Work Commission found that aged care work was undervalued because it was historically dominated by women, and increased pay rates for aged care nurses and personal care workers.10Fair Work Commission (2024). This means base pay for aged care nurses is about the same as, or even a little higher than, for public hospital nurses; in the past, it was typically lower.11For example, in 2019, an entry-level nursing assistant typically earned 13 per cent more in public hospitals than in aged care; in 2025, they earn 4 per cent less. A level 1 registered nurse earned 9 per cent more in public hospitals in 2019; now, 2 per cent less: ANMF (2019, p. 28) and ANMF (2025, p. 26). That alone will probably add to wage pressure in hospitals. Other gender-based undervaluation cases covering nurses and other health and care workers are still to be determined.12Fair Work Commission (2025a), and Fair Work Commission (2025b). And doctors are seeking higher wages in enterprise bargaining agreements, even taking industrial action in NSW.13Block (2025).
Over time, hospital demand will continue to grow because our population is ageing, chronic disease is becoming more common, and more treatments are being developed.14Investments in prevention and primary care can help change that trajectory: Breadon and Romanes (2022). If the past decade’s trend continues, spending per person will reach $3,250 by 2035 – a 32 per cent increase in just over a decade.15From $2,460 in 2024, in 2025 dollars. Based on current spending per person by age and sex (AIHW (2025e)), multiplied by Treasury population forecasts (Centre for Population (2024)), inflated by average annual growth in spending per person, by age and sex, between 2014 and 2024 (overall, about 2.3 per cent).
This will add up to health rising as a share of government spending. The federal government projects health will be the biggest area of federal spending by 2063, amounting to 6 per cent of GDP.16Treasury (2023). And the NSW government forecasts that health’s share of spending will grow from 29 per cent in 2018-19 to 38 per cent by 2060-61.17NSW Treasury (2024).
1.3.2 State budgets are under pressure
State government budgets are vulnerable to hospital financial pressures. Hospitals are the single biggest area of spending for state governments.18In 2024, hospitals were the biggest area of spending for every state and territory government except WA, which spent more on school education (hospitals were second biggest). One in every six dollars spent by state governments goes to hospitals, amounting to $66 billion in 2024.19Grattan Institute analysis of ABS (2025c).
Spending growth has been relentless. State government spending on hospitals has grown by 60 per cent, in real terms, in a decade.
The fiscal consequences are beginning to bite. The ACT recently introduced a new tax on property owners to help cover its health budget blowout.20ACT Government (2025a). NT’s Treasury warned that current spending on hospitals and other services risked pushing it toward its debt ceiling.21Garrick (2024).
In the ACT, health services were specifically identified by S&P Global as an area of concern that could ‘further erode justification for its AA+/Negative/A-1+ rating’.22Bushnell (2025). The ratings agency called out all states’ cost blowouts and poor budgeting as a risk to credit ratings.23S. Wright (2025). Lower credit ratings make it more expensive for governments to borrow.
1.3.3 Something’s gotta give
As hospital demand grows, governments will face hard choices: raise revenue through higher taxes or cut services, or both.
Health budgets aren’t immune to fiscal pressures. If we do nothing about ballooning costs, austerity threatens. In the UK, austerity policies meant per-person health funding was effectively flat for a decade.24Gainsbury and Appleby (2022). And many European countries have made across-the-board cuts to health budgets in response to budget pressures.25Clemens et al (2014), and WHO (2021).
Blunt, indiscriminate cuts are dangerous. Austerity measures during the 2008-10 global financial crisis resulted in a deterioration in access to healthcare in most European countries, with poorer people more likely to miss out on care.26Doetsch et al (2023), and Stuckler et al (2017). New builds and maintenance are often the first things to be cut, borrowing savings from the future.27Clemens et al (2014). In England, half of the efficiency savings in the National Health Service were from non-recurrent spending.28Jefferies and Wickens (2025).
Working conditions for frontline staff can also get worse. Working in crumbling, understaffed hospitals, unable to provide timely, high-quality care, increases the risk of poor morale and burnout.29Owens et al (2019), Kerasidou (2019), and Morley et al (2019).
If governments don’t target their efforts to improve efficiency, we risk stumbling into damaging austerity by default.
1.4 Getting better value for hospital spending
This report shows that there is another way. With smarter spending, we can get better care for every hospital dollar.
At the moment, we spend too much on avoidable costs – funding that doesn’t necessarily deliver better quality (Chapter 3) and could go towards tackling waiting lists and providing more care (Chapter 2).
To get better value for every hospital dollar, governments need to:
- end the toxic cycle of bailouts (Chapter 4), and reset budgets to allow hospitals to improve efficiency (Chapter 5);
- set new prices to send better signals about what care should cost (Chapter 6);
- hold hospital leaders to account (Chapter 7);
- help hospitals innovate (Chapter 8); and
- centralise procurement and procedures to take advantage of economies of scale (Chapter 9).
1.5 What this report is not about
In this report, we focus on costs once patients are admitted to hospital. There’s plenty that governments can do to prevent hospital admissions in the first place, including investing in prevention,30Breadon et al (2023). primary care,31Breadon and Romanes (2022). better access to specialist treatment,32Breadon et al (2025). and hospital diversion programs.33Breadon (2023).
Within hospitals, we focus on admitted acute care. This accounts for the biggest share – 61 per cent – of total hospital spending.34NHFB (2025). It has flow-on effects for other parts of hospitals – for example, a lack of inpatient beds contributes to emergency department overcrowding and ambulance ramping.35NSW Parliament Portfolio Committee No. 2 – Health (2022). We wrote about specialist outpatient clinics in our 2025 report, Special treatment: Improving Australians’ access to specialist care.36Breadon et al (2025).
2 A billion dollars of hospital spending could be put to better use
There are huge differences in how much a hospital visit costs from one hospital to the next, even within the same state. We estimate the average cost of a knee replacement in Victoria varies by $13,600 between high- and low-cost hospitals, after controlling for many differences between patients and hospitals. In Queensland, the gap is $11,000. In NSW, it’s $9,000.
Across all admissions, we estimate there’s $1.2 billion of hospital spending every year that could be put to better use. That’s enough to pay for an extra 160,000 visits.
2.1 Some hospitals spend a lot less to deliver the same care
Some hospitals spend less than others to deliver the same procedures, even after accounting for patient characteristics (such as age, health conditions, and socio-economic status) and fixed hospital characteristics (such as scale, scope, state, and region) (Box 2).37In our analysis in this report, we adjust for a wide range of legitimate causes of cost. But other legitimate cost drivers are not captured in the data and may be responsible for some of the observed variation. The numbers throughout this chapter are based on analysis of the National Hospital Cost Data Collection. This is the best aggregated source of data on hospital costs, but it’s not perfect – for example, there may be differences in the way costs are recorded across states. See Appendix B for more detail on data, methods, and limitations.
We looked at eight common reasons people go to hospital: getting a new hip, knee, or baby (by Caesarean or spontaneous delivery); having their tonsils, appendix, or gall bladder removed; or needing a hernia repair.38Each of these procedures was done at least 13,000 times in Australia in 2022-23. For each of these, in every large state, the difference between the highest-cost and lowest-cost hospital was at least $2,500, after controlling for patient and hospital characteristics (Figure 2.1).
Figure 2.1: The cost of new knees, hips, babies, and other common procedures varies widely within each state
Difference between actual and expected admission cost, by hospital
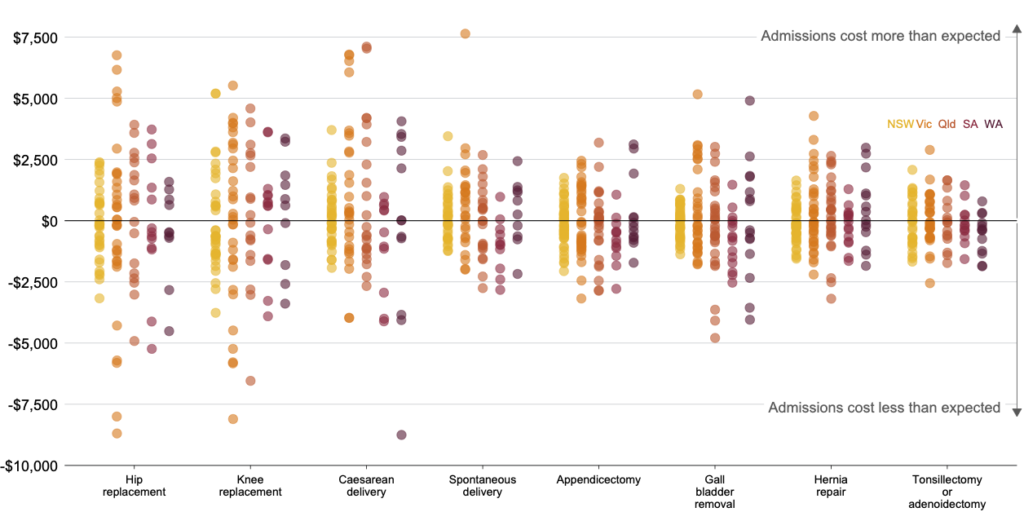
Notes: Expected cost is the total admission cost predicted by our regression model (which accounts for patient and hospital characteristics), applied to that admission’s profile. Each point is the mean residual, by hospital. Hospitals below the 5th percentile and above the 95th percentile are excluded. In our analysis we adjust for a wide range of legitimate causes of cost. However, other legitimate cost drivers are not captured in the data and may be responsible for some of the observed variation. The numbers throughout this chapter are based on analysis of the National Hospital Cost Data Collection. This is the best aggregated source of data on hospital costs, but it’s not perfect – for example, there may be differences in the way costs are recorded across states. See Appendix B for more detail on data, methods, and limitations.
Source: Grattan Institute analysis of IHACPA (2025).
The cost of a Caesarean delivery varies by up to $10,000 in WA, Victoria, and Queensland. It varies by up to $5,000 in NSW and SA. The cost of a spontaneous delivery also varies widely: by up to $4,600 in WA, NSW, and Queensland, and $9,600 in Victoria.
It’s a similar story for knee and hip replacements. The average cost of a knee replacement in Victoria varies by $13,600 between high- and low-cost hospitals. In Queensland, the gap is $11,000; in NSW, $9,000. For hips, the difference is more than $15,000 in Victoria, and more than $8,800 in Queensland and SA.
Even relatively simple procedures vary by thousands of dollars on average. A typical gall bladder removal at the highest-cost WA hospital costs $8,950 more than at the cheapest. The cost of hernia repairs varies by up to $6,500 in Victoria. And the cost of appendicectomies varies by $6,000 in Queensland.
These are just some examples. We repeated this analysis for all acute public hospital admissions. After accounting for case mix, patient characteristics, fixed hospital characteristics, and state, some hospitals’ admissions consistently cost far less than expected, and some far more (Figure 2.2). The spread between high-cost and low-cost hospitals is increasing over time (Figure 2.3).
Figure 2.2: Hospital costs vary a lot within every state
Difference between actual and expected admission cost, by hospital
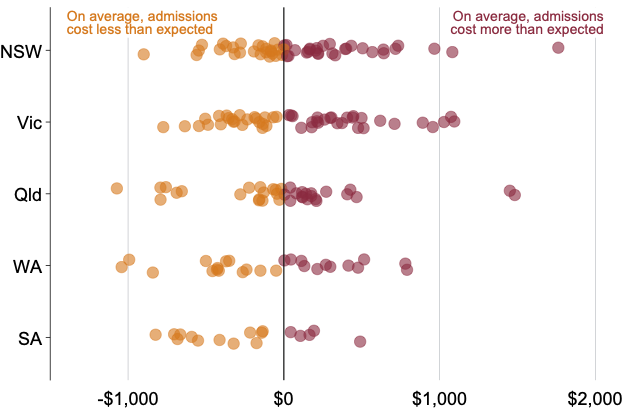
Note: : Expected cost is the total admission cost predicted by our regression model (which accounts for patient and hospital characteristics), applied to that admission’s profile. Each point represents the mean residual by hospital. In our analysis we adjust for a wide range of legitimate causes of cost. However, other legitimate cost drivers are not captured in the data and may be responsible for some of the observed variation. The numbers throughout this chapter are based on analysis of the National Hospital Cost Data Collection. This is the best aggregated source of data on hospital costs, but it’s not perfect – for example, there may be differences in the way costs are recorded across states. See Appendix B for more detail on data, methods, and limitations.
Source: Grattan Institute analysis of IHACPA (2025a).
Figure 2.3: Unexplained cost variation has increased since 2018
Percentile of unexplained cost
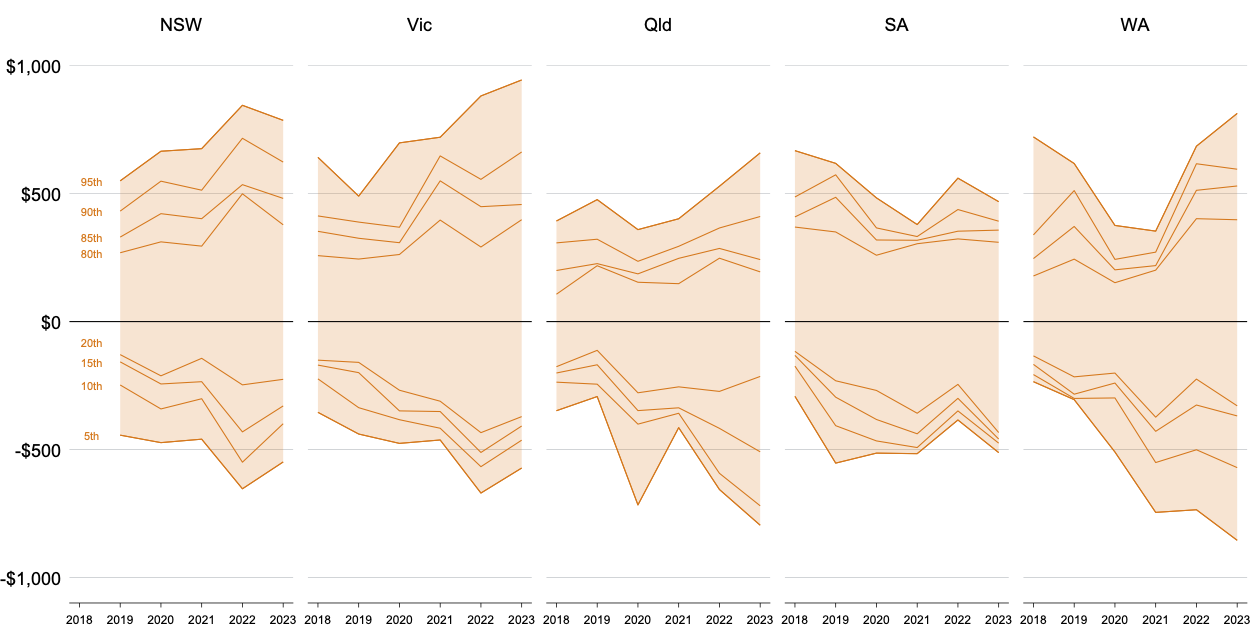
Notes: Percentiles of average residual, by hospital, from cost regression, standardised so the median within each state is zero every year. Estimates are inflated by the growth in the national efficient price for comparability across years. In our analysis we adjust for a wide range of legitimate causes of cost. However, other legitimate cost drivers are not captured in the data and may be responsible for some of the observed variation. The numbers throughout this chapter are based on analysis of the National Hospital Cost Data Collection. This is the best aggregated source of data on hospital costs, but it’s not perfect – for example, there may be differences in the way costs are recorded across states. See Appendix B for more detail on data, methods, and limitations.
Source: Grattan Institute analysis of IHACPA (2025a).
High variation suggests that some costs may be avoidable. Hospitals in the same state, in the same year, delivered the same care to similar patients for much less than others.
We estimate there is up to $1.2 billion in avoidable costs every year (Figure 2.4). That’s enough to pay for 160,000 hospital visits.39The national efficient price is $7,258 per visit in 2025-26.
Figure 2.4: There’s more than $1 billion of avoidable costs across the country
Avoidable costs as share of total costs
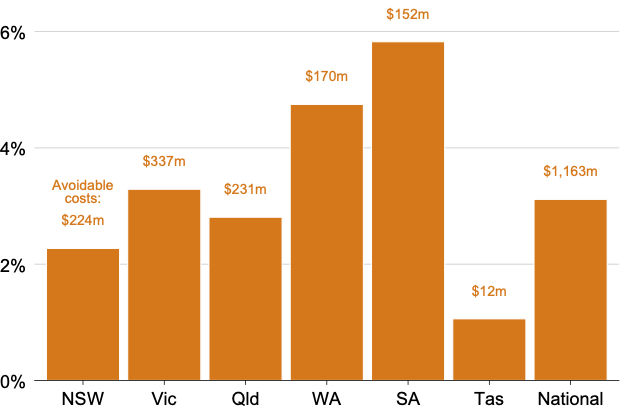
Notes: Avoidable costs are those above the median of unexplained costs, as share of in-scope total costs (Box 2). Estimates are scaled up by the change in the national efficient price between 2022-23 and 2025-26, and for admissions excluded from the regression model (including the ACT for the national estimate). In our analysis we adjust for a wide range of legitimate causes of cost. However, other legitimate cost drivers are not captured in the data and may be responsible for some of the observed variation. The numbers throughout this chapter are based on analysis of the National Hospital Cost Data Collection. This is the best aggregated source of data on hospital costs, but it’s not perfect – for example, there may be differences in the way costs are recorded across states. See Appendix B for more detail on data, methods, and limitations.
Source: Grattan Institute analysis of IHACPA (2025a).
This estimate is conservative. It recognises there are costs hospitals can’t control that aren’t captured in our data: for example, a hospital layout that adds time to ward rounds, or unrecorded differences in how severe patients’ illnesses are.40Another factor that varies between hospitals, and for which we do not control, is whether a patient elects to be treated as a private patient. This is associated with a higher admission cost: Appendix B.7. We assume only the top half of the extra cost is potentially avoidable – that is, we compare every hospital’s unexplained cost to the median unexplained cost in the state. Box 2 explains our methods and assumptions in more detail.
Our analysis is also conservative because it assumes that all variation in cost between states is legitimate. But government decisions can influence hospital costs. Some take advantage of buying in bulk to get better deals; others do not (Chapter 9). Some have more restrictive conditions in enterprise bargaining agreements than others.
Tasmania, Western Australia, South Australia, and Victoria have a higher typical cost of admission, even after accounting for differences in patients’ age, socio-economic status, and health status, and whether hospitals are in urban or regional areas (Figure 2.5).
Figure 2.5: Costs vary a lot between states
Marginal cost of being treated in each state, relative to weighted national average
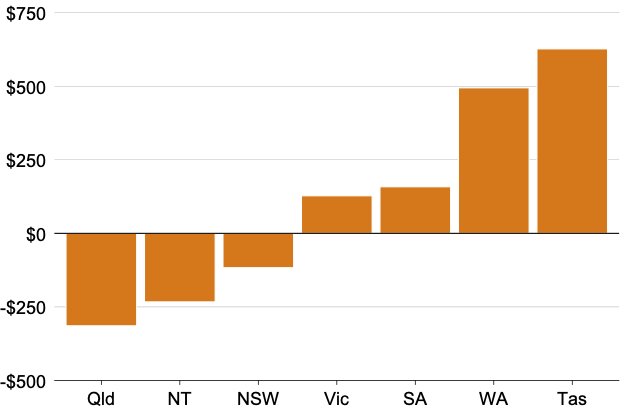
Note: Coefficients on state dummy variables from cost regression, relative to weighted national average of state effects. In our analysis we adjust for a wide range of legitimate causes of cost. However, other legitimate cost drivers are not captured in the data and may be responsible for some of the observed variation. The numbers throughout this chapter are based on analysis of the National Hospital Cost Data Collection. This is the best aggregated source of data on hospital costs, but it’s not perfect – for example, there may be differences in the way costs are recorded across states. See Appendix B for more detail on data, methods, and limitations.
Source: Grattan Institute analysis of IHACPA (ibid).
For some common procedures, cost differences between states are even bigger. The cost of a hip replacement in Tasmania is $5,500 more than in Victoria.41The difference would be enough to cover two business-class return flights from Hobart to Melbourne, with a lot of change to spare. And the cost of a Caesarean delivery in Victoria is $4,100 more than in NSW.42Again, the difference would more than cover two business-class return flights from Melbourne to Sydney.
Box 2: How we estimated avoidable cost
First, we created a model of the total cost of every public hospital admission, based on the patient’s age, socio-economic status, comorbidities, weighted activity units, mechanical ventilation, admission mode, admission urgency, and discharge destination; and the hospital’s size, diagnosis complexity, specialisation, remoteness, and state.
We used this to predict the cost of every admission. Then, we calculated the ‘unexplained cost’ – the difference between the expected cost and actual cost (that is, the residual). This is sometimes higher (the admission costs more than expected, based on observable characteristics), and sometimes lower.
Second, we calculated the mean unexplained cost for every hospital. A hospital with a roughly even number of unexpectedly high- and low-cost admissions, of about the same magnitude, would have an average unexplained cost of about zero. One with mostly unexpectedly cheap admissions would have a negative average unexplained cost.
Next, we calculated ‘avoidable costs’, defined as unexplained costs above the median hospital’s unexplained cost in every state. This is a conservative assumption that reflects that some unexplained cost differences are legitimate, even if unobserved. Half the hospitals in each state already have lower unexplained costs than the median.
Our main estimates are based on data on every public hospital admission between 1 July 2022 and 30 June 2023 from the National Hospital Cost Data Collection. This was the most recent year for which data are available, but COVID may still have affected costs to different degrees across different hospitals and states (for example due to differing infection control practices or use of contracted care). We also tested the model for earlier years and found similar results.
The national cost data collection is the best aggregated source of data on hospital costs, but there are limitations to our analysis. For example, we cannot link non-admitted costs associated with an admission, so different models of care may appear more or less costly because different costs are in scope of the admitted care dataset. See Appendix B for more detail on data, methods, and limitations.
Figure 2.6: An illustration of our method for calculating avoidable cost
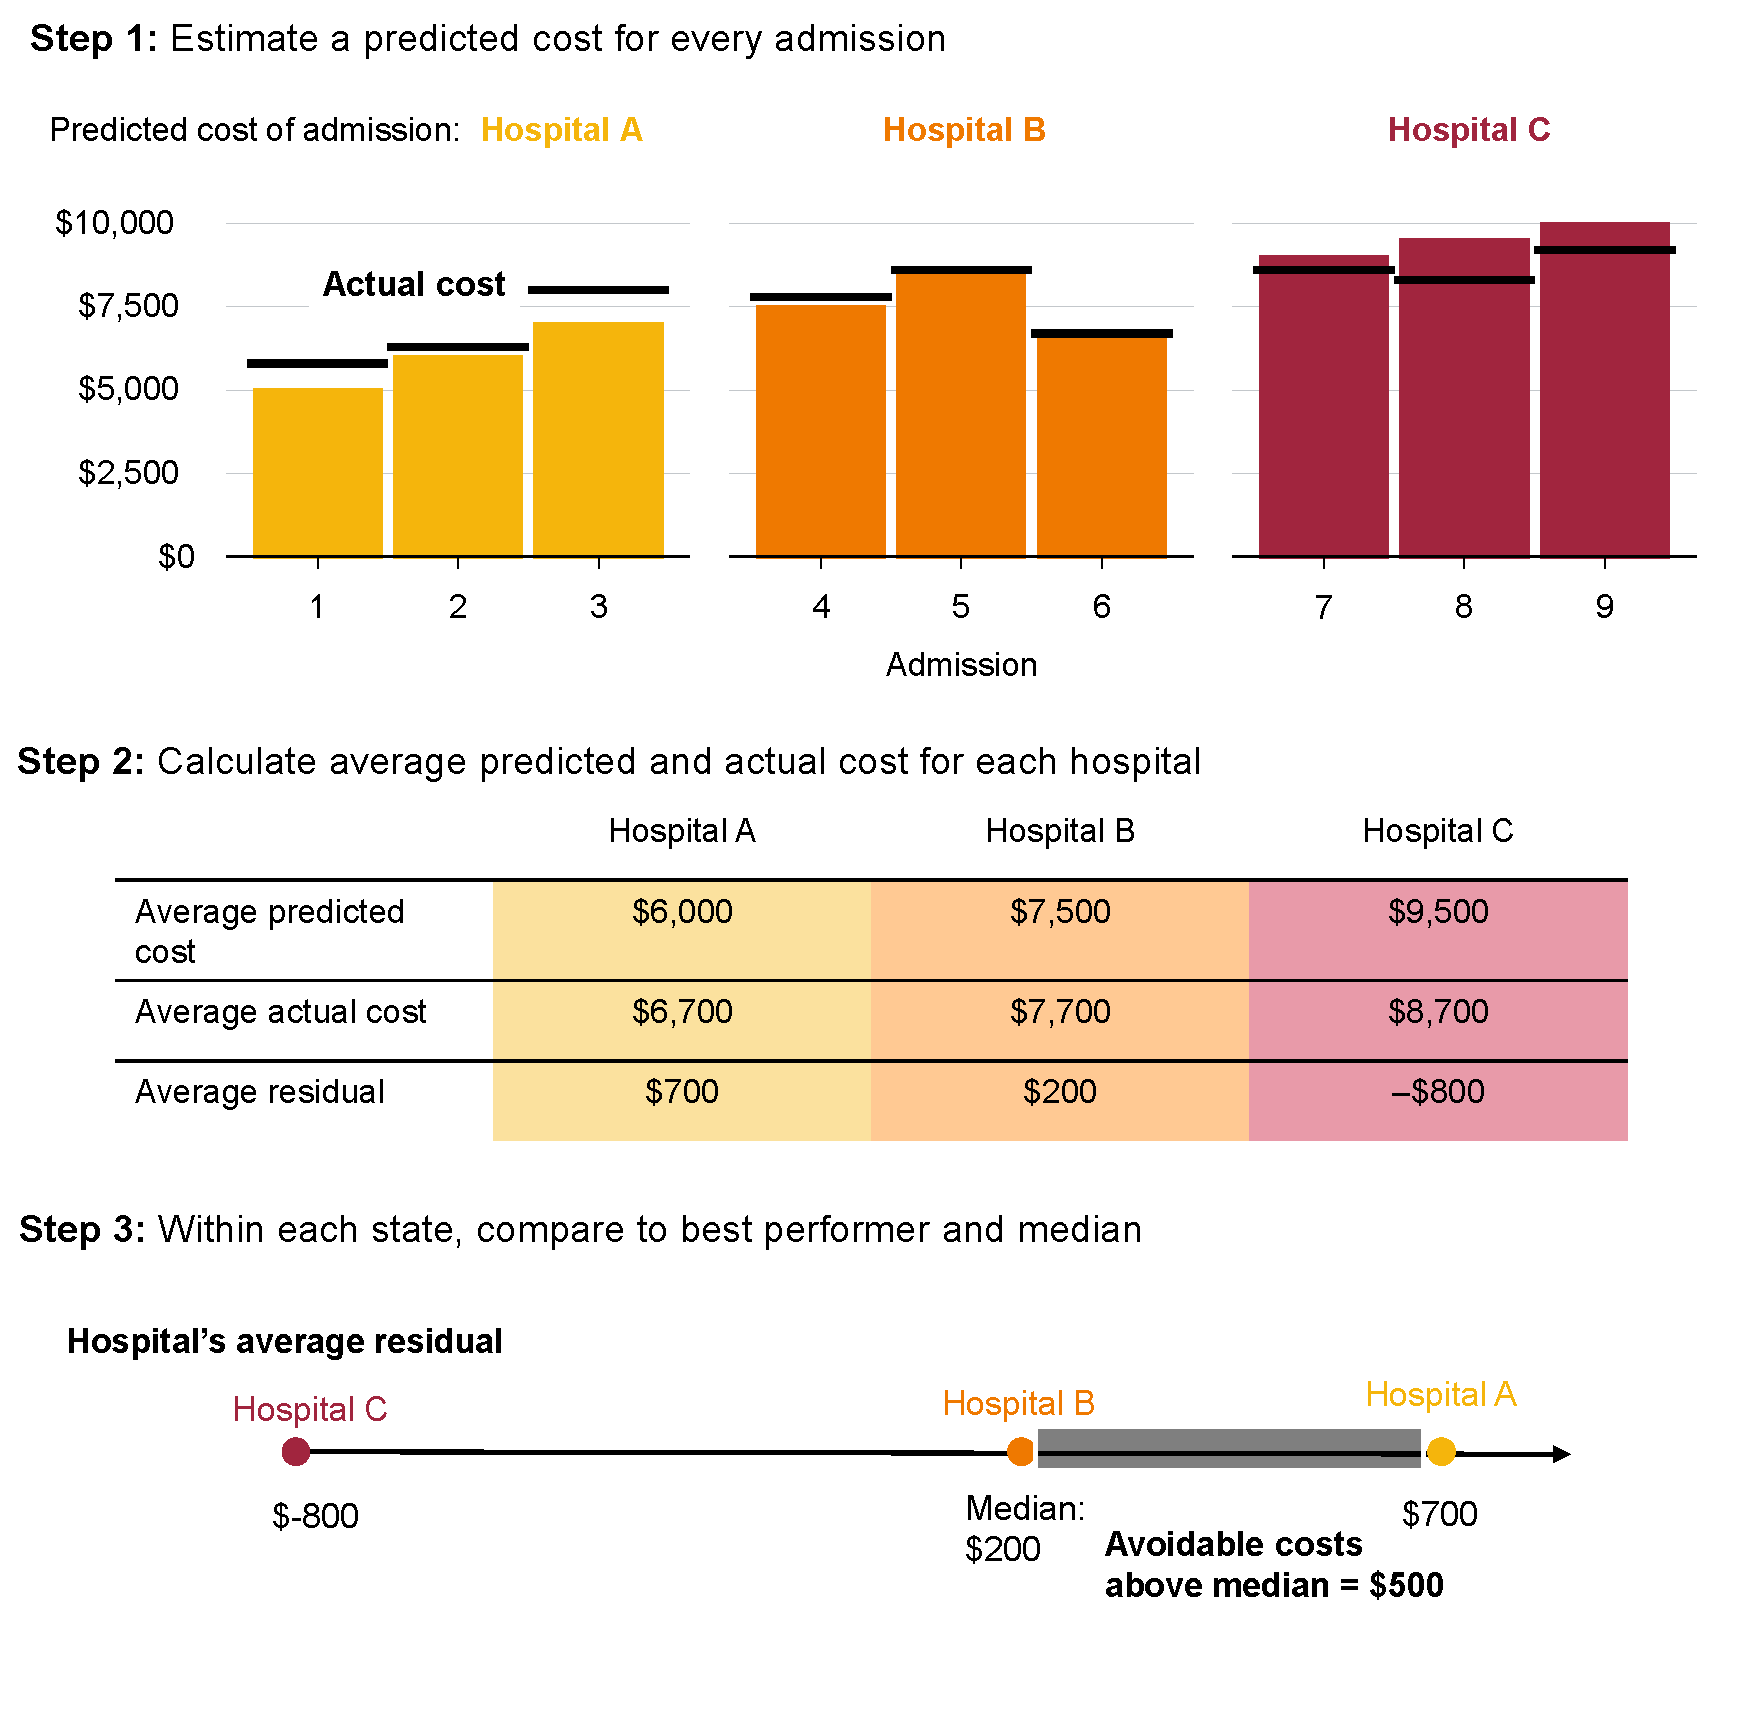
Source: Grattan Institute.
3 Cutting cost doesn’t mean cutting quality
Higher-cost hospitals aren’t necessarily providing better care.43Dubas-Jakóbczyk et al (2022), Hussey et al (2013), Jamalabadi et al (2020), and Søgaard and Enemark (2017). We also tested for a relationship between unexplained costs and unexplained mortality in our data, and found no significant relationship: see Appendix B.9. One systematic review found there was no significant relationship between cost and quality in about half of the 192 included studies (Figure 3.1). About a third found a positive relationship. And in about 20 per cent, the relationship was negative or non-linear.44A non-linear relationship means that, when quality is low, safer care saves money, whereas when quality is already high, additional improvements may be costly.
Figure 3.1: The evidence is mixed on whether money buys better hospital outcomes
Share of studies, by relationship between cost and outcome
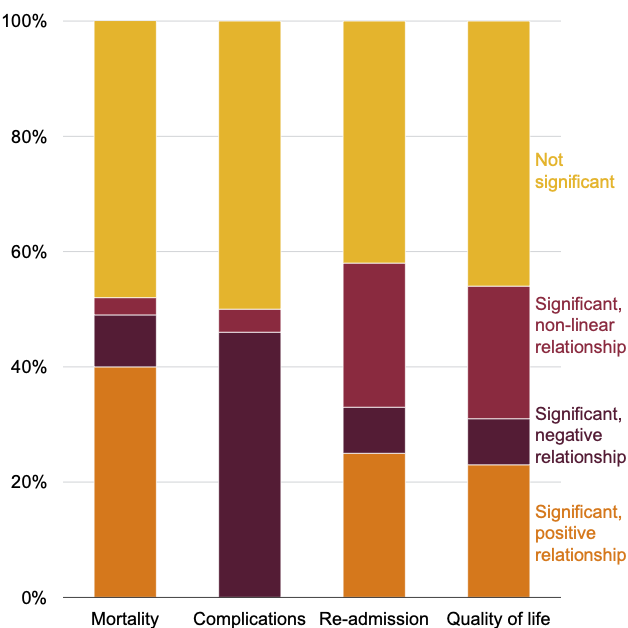
Note: 140 studies reported on mortality, 26 on complications/ morbidity, 12 on re-admission, and 13 on a quality of life index.
Source: Jamalabadi et al (2020).
It’s what hospital dollars are spent on that matters. More spending on nurse staffing hours might deliver better outcomes for patients,45McHugh et al (2021), Brennan et al (2013), and Twigg et al (2019). but unnecessary CAT scans aren’t benefiting anyone.
There are many ways costs can be reduced without compromising care: shorter hospital stays, safer care, and making better use of workers’ skills. This chapter outlines just a few examples.
3.1 Shorter stays for many surgeries are safer and cheaper
Length of stay is a big driver of cost, and hospitals vary a lot in how soon they send patients home (Figure 3.2). The differences can’t be fully explained by differences in patients’ characteristics.46Victorian Auditor General’s Office (2016), and SA Health Performance Council (2023).
Figure 3.2: There is big variation in the average length of stay for common procedures
Average length of overnight stay (says), by hospital 2023-24
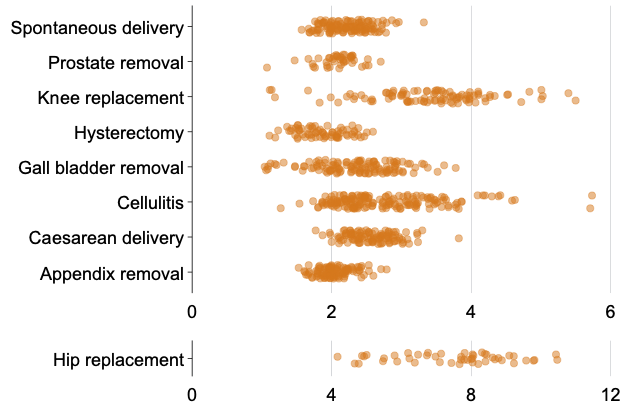
Note: Each point represents one public hospital. For each procedure, only the top 75 per cent of hospitals, by number of overnight admissions, are shown. Three hospitals with longer average lengths of stay are omitted for space reasons.
Source: Grattan Institute analysis of AIHW (2025f).
In NSW, the average risk-adjusted length of stay for a hip replacement varies from 3.2 days (at Goulburn Base Hospital) to 5.8 days (at Fairfield Hospital).47The risk adjustment factors were: age, sex, season, emergency or planned, level of home support, hospital-in-the-home usage, Charlson comorbidity score, and a history of the condition within the past year: Bureau of Health Information (2023). For knee replacements, it varies from 2 days (at Goulburn again) to 5.4 days (at Prince of Wales Hospital).
Reducing length of stay could reduce costs and free up beds without compromising patient safety.48Better discharge planning and enhanced recovery after surgery programs reduce time in hospital without affecting patient outcomes: S. Williams et al (2022), Sauro et al (2024), Langhorne et al (2017), and Gonçalves-Bradley et al (2022). For example, shorter stays for joint replacements are cheaper for hospitals and better for patients (Box 3).
Figure 3.3: Australia lags on same-day surgery
Share of joint replacements where patient goes home on day of surgery
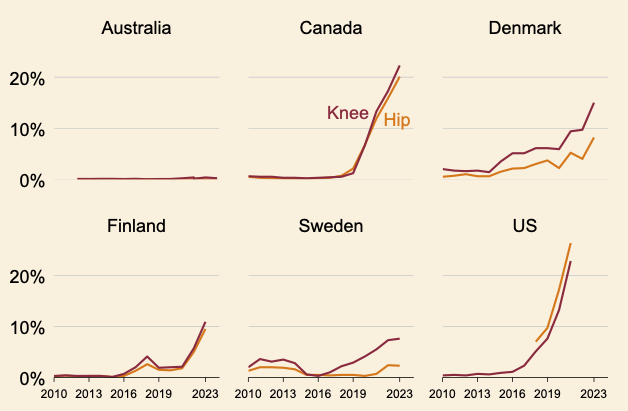
Notes: The data come from different sources so have slightly different definitions. The US estimates are the share of US Medicare/Medicaid patients who had a recorded length of stay of zero days for total knee or hip replacements. All other countries are ‘day’ rates for total or partial, including revision, joint replacements.
Sources: Australia: AIHW (2025f). US: Sandoval et al (2025) and Sanchez et al (2024). All other countries: OECD (2025).
It’s not just joints. Many more procedures are safely done without an overnight stay in other countries (Figure 3.4). The NSW health department worked with clinical experts to set targets for common procedures where many patients can be discharged in one day, including tonsillectomies, mastectomies, and gall bladder removals. These targets have been incorporated into hospitals’ service agreements.49For example: NSW Health (2025a).
Figure 3.4: Many other countries do much more same-day care
Proportion of stays that are same day
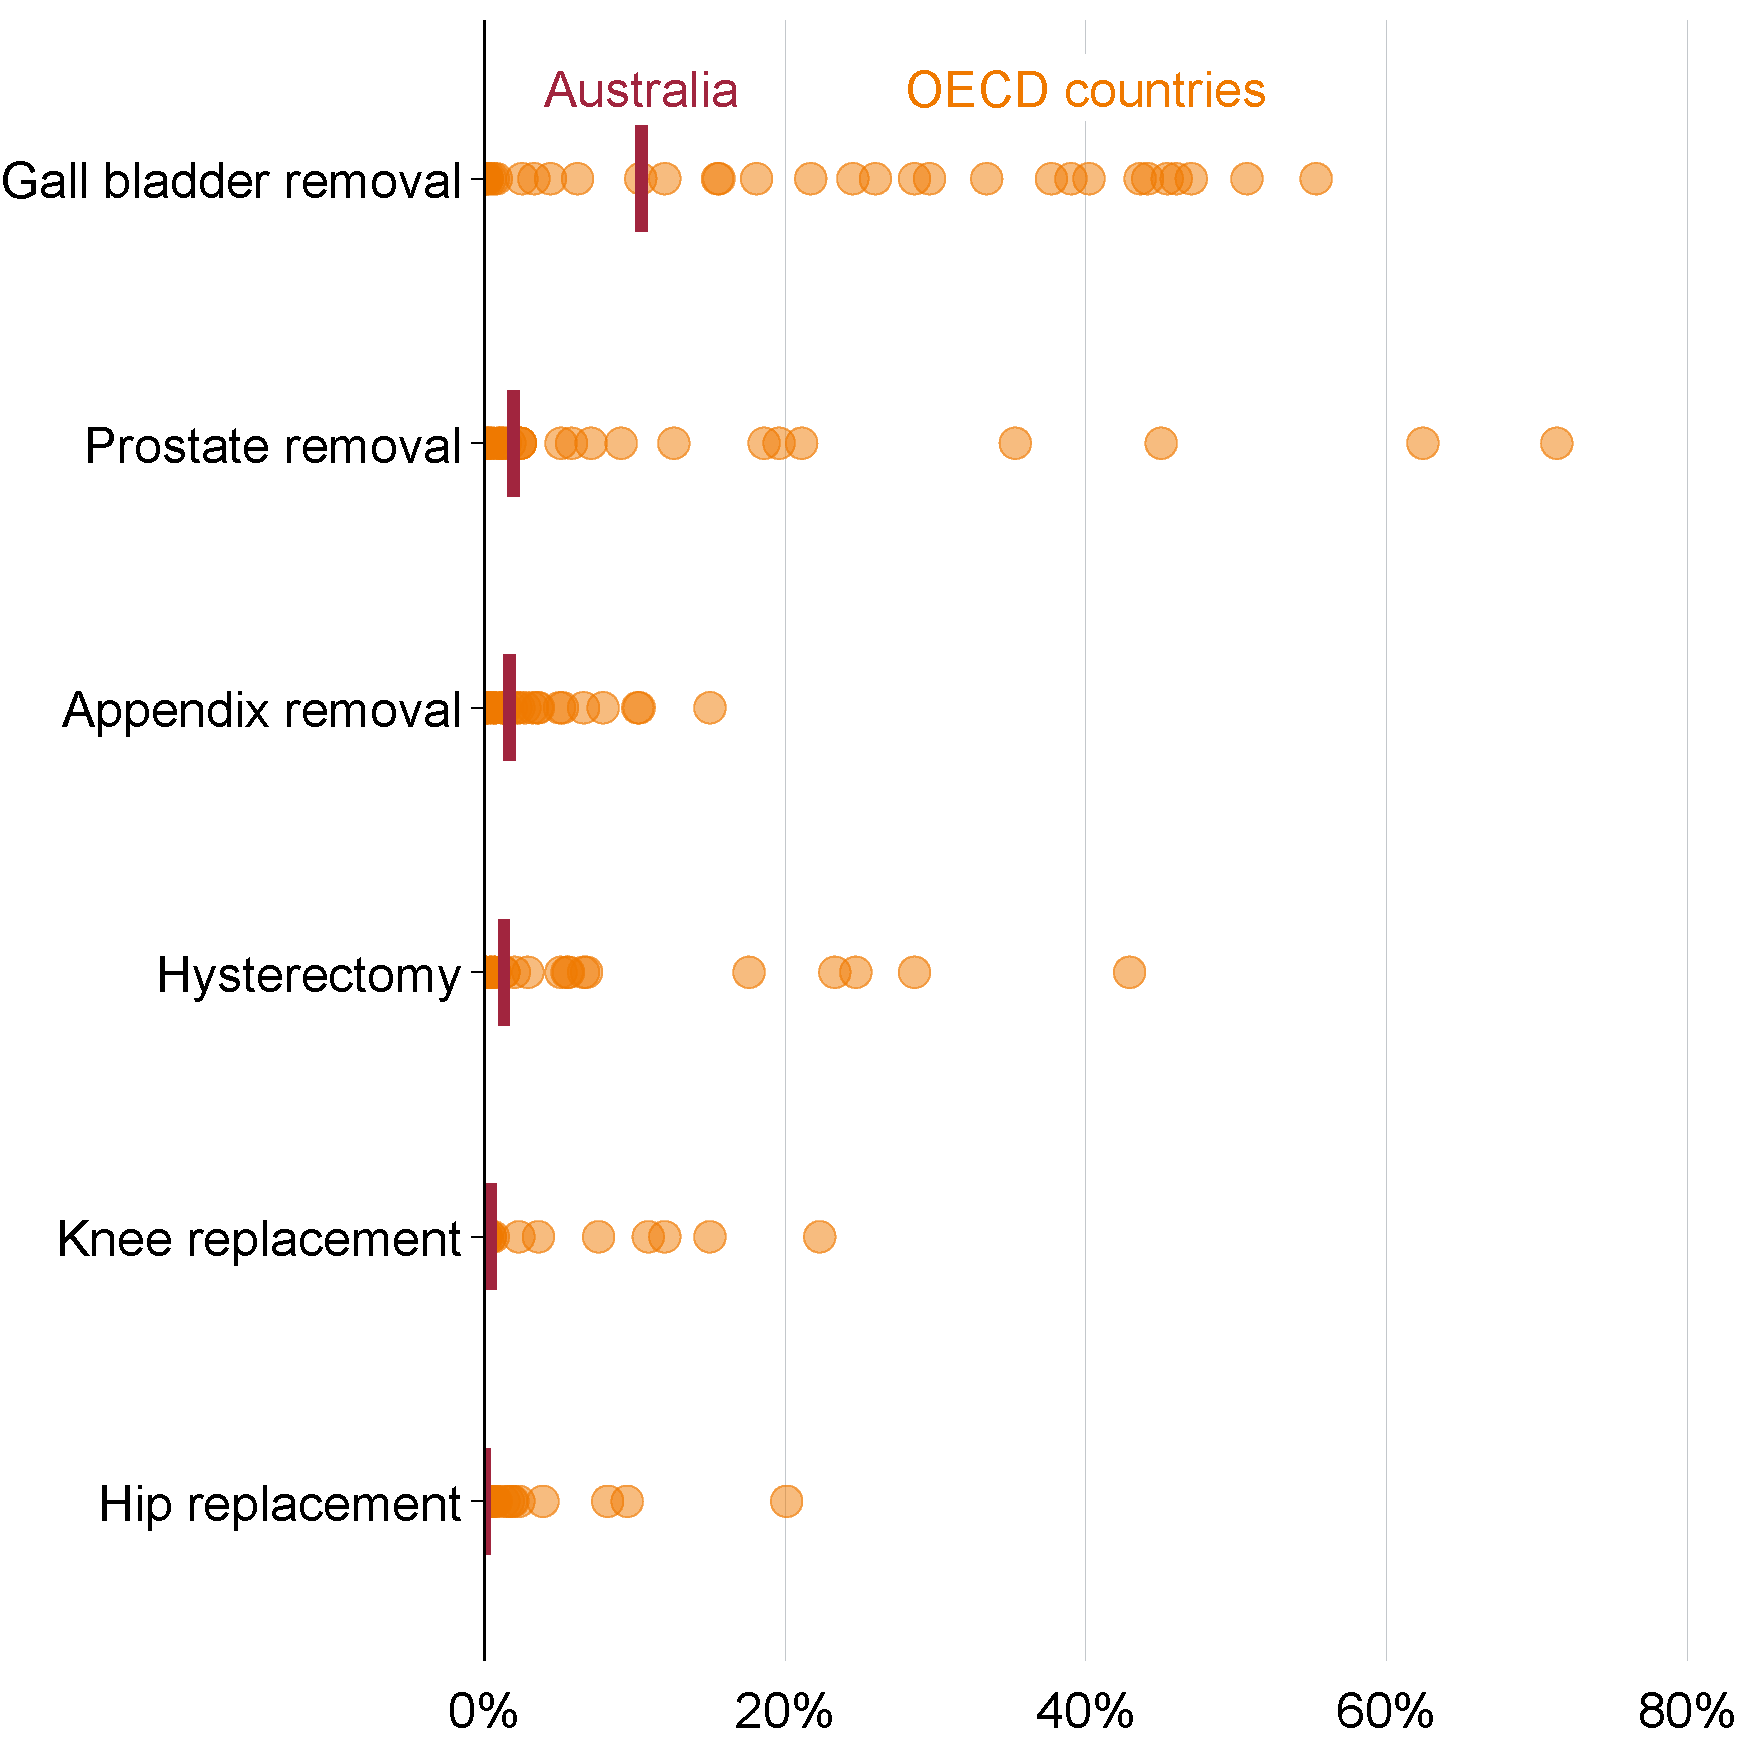
Notes: Data for Australia is 2023-24 national public hospital weighted average. Data for OECD countries are latest available year. Data for OECD countries for prostate removal are for transurethral prostatectomy.
Sources: Grattan Institute analysis of OECD (2025) and AIHW (2025f).
Box 3: Shorter stays for joint replacements are good for patients and hospitals
Many health systems are moving to shorten stays for hip and knee replacements. Patients are discharged on the same day as their operation, or soon after, and supported to rehabilitate at home.
Same-day joint replacements aren’t right for all patients. But for low-risk patients with an appropriate home environment,aNSW Agency for Clinical Innovation (2022), and Meneghini et al (2017). they are safe.bOne study estimated that three quarters of all patients could be successfully discharged in one day, with appropriate education and preparation: Verdier et al (2022). Complication, re-admission, and re-operation rates are similar to rates for conventional models.cHoffmann et al (2018), Bayoumi et al (2023), Berkovic et al (2023), and Goyal et al (2017).
Many more Australians could get to sleep in their own bed after getting a new joint. In 2023-24, across private and public hospitals, there were just 152 same-day hip replacements – 0.3 per cent of the 46,170 non-trauma hip replacements. There were 147 same-day knee replacements, 0.2 per cent of the total 67,407 knee replacements.dAIHW (2024).
Rates in comparable countries are much higher, and have increased rapidly (Figure 3.3).
In Australia, same-day joint replacements have been trialled successfully.eQurashi et al (2022). NSW has had a pilot program since 2023. At one pilot site, Grafton Base Hospital, 8.5 per cent of people getting a new knee or hip were discharged on the same day, and 65 per cent were discharged in two or fewer days. Complication and re-admission rates were similar to standard care, and more than 90 per cent of patients said they were very satisfied with their experience.fTutty et al (2024).
Spreading these practices would save hospitals money.gLovald et al (2014), Aynardi et al (2014), and Naylor et al (2017). An Australian study found that shortening ward stays by just two days, while expanding outpatient rehabilitation, could save $640 per joint (in 2023 dollars), and free up more than 9,000 bed days per year.hLloyd et al (2024).
3.2 Complications hurt patients and budgets
Every year, about 750,000 Australians pick up a complication during their stay in a public hospital.50AIHW (2025g). Patients acquire an extra condition during one in every five overnight admissions, leading to unnecessary pain and suffering, and delays returning home. Some people die from their complications.
Not all complications are avoidable, but many are. The official healthcare safety and quality agency defines 16 complications – such as pressure injuries (bedsores), delirium, and staph infections – which can be reduced with clinical risk mitigation strategies.51ACSQHC (2025). These conditions arise in one in every 50 hospital admissions.52AIHW (2025g).
Hospital-acquired complications add to the cost of care.53Mitsutake et al (2025), Fernando-Canavan et al (2020), and Nghiem et al (2022b). The additional conditions must be treated, and patients usually stay longer. Reducing the rate of all complications to the level of the safest 10 per cent of hospitals could save $1.5 billion a year.54Based on 2014-15 data: Duckett and Jorm (2018a).
Australia has made some progress on reducing these complications. After financial penalties were introduced for 13 complications in 2018, rates declined about by about 17 per cent.55Slawomirski et al (2025).
But there’s more work to do. Even after adjusting for risk factors, there’s wide variation in hospital performance, suggesting laggards could learn from leaders.56Nghiem et al (2022a) and Duke et al (2022). Hospital-wide strategies to identify high-risk moments, apply evidence-based interventions, and constantly review and tweak initiatives can achieve and sustain reductions in complications.57Q. C. Li et al (2024). Efforts should be expanded beyond the 13 complications that have been the focus of financial penalties to date.58Duckett and Jorm (2018b).
3.3 There’s too much low-value (but high-cost) care
Every year, hospitals in Australia carry out procedures that aren’t supported by evidence.59Duckett and Breadon (2015), and ACSQHC (2021). For example, clinical guidelines do not support arthroscopes to treat knee osteoarthritis,60ACSQHC (2024). yet every year hundreds are done.61De Oliveira Costa et al (2021), and L. Smith et al (2020).
There are also too many pointless tests and too much pointless imaging that won’t change a patient’s treatment plan. International meta-analyses suggest 20-to-25 per cent of diagnostic tests are clinically irrelevant or inappropriate.62Müskens et al (2022), Choosing Wisely (2022), and Zhi et al (2013). Rates are also high in Australia,63For example, 15 per cent of pathology tests in SA hospitals were inappropriate: Banker et al (2024). ICU clinicians estimated a third of routine tests were unnecessary: Litton et al (2021). There was no need for half of all blood gas tests at two Melbourne ICUs: Cunanan et al (2024). Forty-one per cent of pre-operative blood tests were incorrectly ordered at Sunshine Coast Hospital: Choosing Wisely Australia (2021). Eight per cent of imaging requests for inpatient cancer patients were inappropriate at Westmead Hospital: Gupta et al (2014). Eight per cent of CT scans at a rural NSW hospital were inappropriate: Barrett et al (2019). and there’s significant variation in imaging across hospitals.64L. Smith et al (2020), and Wabe et al (2021b).
Low-value procedures and tests don’t make patients better.65In fact, they carry risks: some people acquire complications while in hospital for a low-value procedure: Badgery-Parker et al (2019b). But they do cost money.66Kjelle et al (2024). One study examined the prevalence of 27 low-value procedures in NSW in 2017. If its results hold today, national costs could be up to $490 million.67Badgery-Parker et al (2019a). Scaled up according to NSW’s share of public hospital admissions, in 2025 dollars. The study reported a narrower and broader definition of low-value care; our estimate uses the broader definition. And if 20 per cent of all pathology and imaging tests in public hospitals are inappropriate (the lower end of international estimates), governments could save more than $500 million.68Public hospitals spent $2.4 billion on pathology and imaging tests in 2022-23: IHACPA (2023).
Low-value care and tests have costs beyond their sticker price. They can delay tests and treatment for other patients who really need it, cause patients to be woken up, block flow through the hospital, and contribute to the health system’s carbon footprint.69Wabe et al (2021a), H. Walker et al (2025), and Barratt et al (2022).
3.4 Unlocking skills in hospitals
Too many highly trained health professionals spend time doing work that could be done by someone with fewer qualifications and skills.70Duckett and Breadon (2014a). This leads to higher costs, staff shortages, and less-satisfying jobs.
For example, specialist nurses with additional training can do some simple procedures usually limited to doctors. Nurse endoscopists can perform simple endoscopies as safely as gastroenterologists.71Stephens et al (2015), J. Williams et al (2009), and Day et al (2014). Nurse anaesthetists can safely sedate patients for low-risk procedures.72Hidalgo-Cabanillas et al (2025), Qi et al (2021), and Henschke et al (2025). This reduces staffing costs and can increase efficiency by allowing more cases to be scheduled without having to work around specialists’ case loads.73Duckett and Breadon (2014a), and Wiggins et al (2019). There are a few nurses performing endoscopies in Victoria and Queensland, but these roles could be expanded a lot.74N. Duncan et al (2017), Wiggins et al (2019), and Michaels and Foran (2023).
Another example is allied health assistants, who support allied health workers (such as physiotherapists and speech pathologists) with less complex care, prepare equipment, and help with administration and other tasks. They free up health professionals for more complex work without compromising patient safety.75Snowdon et al (2020). Allied health assistants work in hospitals across Australia, and some states have highlighted their potential contribution.76Office of the Chief Allied Health Officer (2022), NSW Health (2022), and Victorian Department of Health (2024b). But for now, they remain rare.
It’s important that new workforce roles have enough training, a clear scope, and appropriate supervision.77Duffield et al (2019), Leng (2025), Cooper et al (2025), and Bridges et al (2019). But when those measures are in place, freeing up health professionals in these ways is safe for patients78Mutsekwa et al (2022). and saves money. In 2014, we estimated that expanding just a few roles could save public hospitals $430 million a year.79Duckett and Breadon (2014a).
3.5 AI can help hospitals deliver better care for less
Uses of AI in hospitals are still being developed, but there is promising evidence it can help clinicians deliver better care more efficiently.80Ali et al (2023), Agency for Clinical Innovation (2024a), and Agency for Clinical Innovation (2025).
AI can help catch patient problems early, allowing for faster treatment. For example, a meta-analysis of 73 in-hospital studies found that all AI models tested were significantly better than traditional scoring systems at predicting sepsis risk.81Yadgarov et al (2024). Another meta-analysis, of five studies, found that using AI systems to predict clinical deterioration reduced in-hospital mortality risk by 24 per cent, and length of stay by about a third of a day.82Yuan et al (2025). AI tools have also been used to flag medication errors and predict the risk of falls, pressure injuries, and infections.83De Micco et al (2025), Radaelli et al (2024), and Choudhury and Asan (2020).
AI can also help hospitals make better use of valuable resources, such as clinicians’ time.84Nasef et al (2025), Sasseville et al (2025), and Hassan et al (2025). A large trial in English clinics found AI scribes increased the time doctors spent interacting with patients by 24 per cent, while decreasing overall appointment length by 8 per cent.85Great Ormond Street Hospital NHS Foundation Trust (2025). Hospitals have used AI to improve scheduling – for example, reducing fallow periods in operating rooms between surgeries.86Ozen et al (2016), and Henderson et al (2024). Others have used AI tools to improve patient flow and optimise bed occupancy.87Nunes et al (2025).
Some Australian hospitals are using AI – for example, to improve discharge planning and monitor vital signs.88For example, Kovoor et al (2025) and Trentino et al (2022). But overall, we lag peers overseas in using AI to deliver better hospital care.89Van der Vegt et al (2024), Kovoor et al (2024), Hains et al (2025), and Productivity Commission (2024).
4 Hospital budgets are broken
Hospital budgets in many states have become a sham. That’s one reason cost variation persists and we’re leaving efficiency gains on the table.
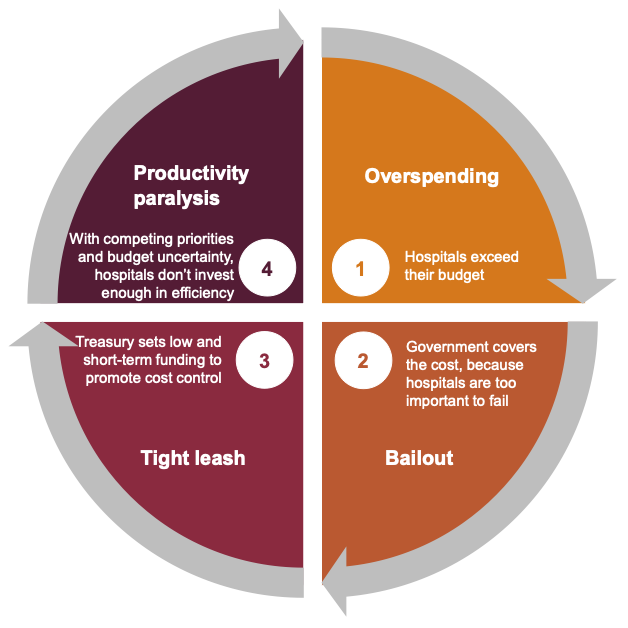
We’ve fallen into a cycle of soft budgeting that impedes productivity (Figure 4.1). Governments routinely bail out hospitals in deficit. Then, trying to enforce discipline (and kick tough decisions down the road), they set unrealistically low future budgets. But this only deepens the problem. With uncertain and unrealistic budgets, hospitals have little incentive or ability to invest to improve productivity, so they overspend again, and the cycle repeats.
Figure 4.1: The soft budgeting cycle
Source: Grattan Institute.
4.1 Stage one: Hospitals overspend their budgets
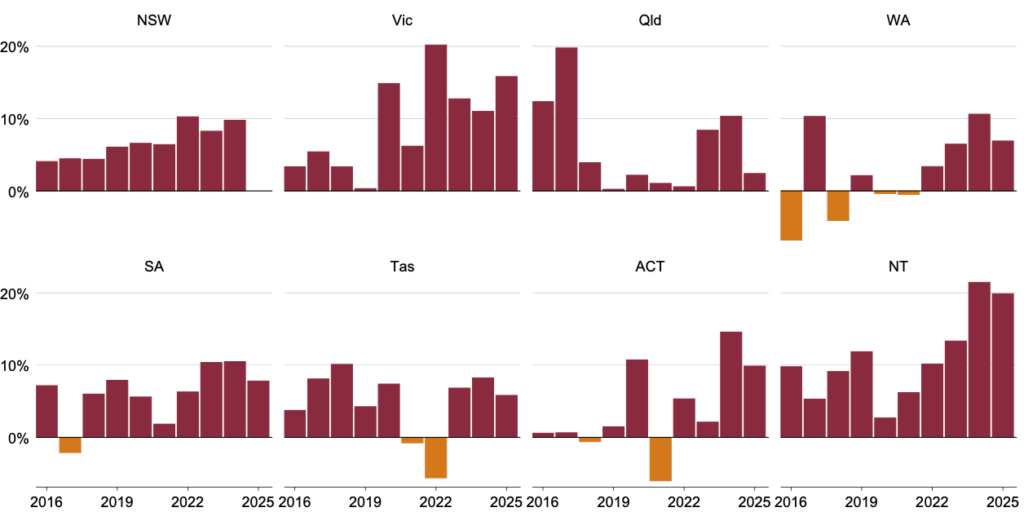
Hospitals90For convenience, we use ‘hospitals’ to refer to local hospital networks: the publicly owned, board-governed entities responsible for delivering public hospital services. Local hospital networks are known by other names, including Local Health Districts in NSW, Hospital and Health Services in Queensland, and Tasmanian Health Organisations. overspend their budgets in most states in most years (Figure 4.2).
Figure 4.2: States almost always overspend their hospital budgets
Hospital budget overrun or underrun, as share of initial budget
Notes: Initial budget spending compared to final actual spending. Data for NSW for 2025 were not available at the time of publication. Source: Grattan Institute analysis. See Appendix A for sources and definitions of in-scope spending (which differ by state).
Deficits were less common, and smaller, in the COVID years, when governments poured money into the health system. But since then, budget overruns are back with a vengeance. Hospital spending exceeded budgets in every state for the latest three years with data available.
These are not small deficits. On average, since 2016, actual spending exceeded budgeted funds by 6 per cent. In NSW and Victoria, the deficits averaged $1.3 billion a year (in 2025 dollars). In Queensland and SA, it was more than $400 million a year.
Overspending plays out as an end-of-year cash crunch for hospitals. Three quarters of Queensland’s local hospital networks ended the 2023-24 financial year with negative net cash.91Queensland Audit Office (2024). And several Victorian hospitals had cash-flow deficits equivalent to several days of operating expenses at the end of 2023-24.92Wong and Willingham (2024).
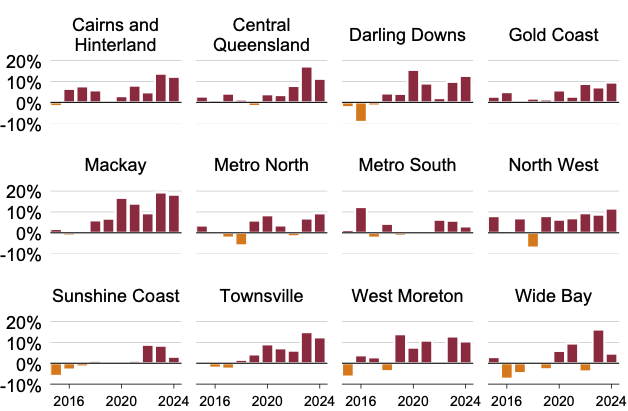
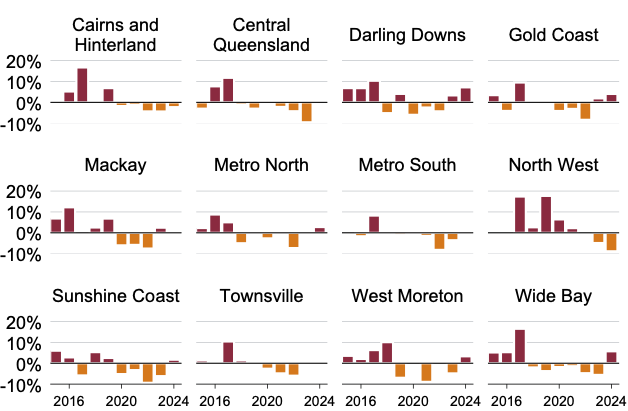
In Queensland, which publishes the most granular data, deficits are mostly driven by cost overruns. For the past decade, the actual cost per weighted activity unit has been higher than budgeted for most years, in all hospital networks (Figure 4.3). The pattern for volume is less consistent – some years it’s higher, some years lower (Figure 4.4).
Figure 4.3: In Queensland, budget overruns are mostly driven by higher costs…
Cost per weighted admission, overrun or underrun, as share of initial target
Note: Children’s Health Queensland, Torres and Cape, and South West local hospital networks are excluded because of data gaps.
Source: Grattan Institute analysis of Queensland Health (2025a).
Figure 4.4: …rather than activity
Weighted inpatient admissions, overrun or underrun, as share of initial target
Note: Children’s Health Queensland, Torres and Cape, and South West local hospital networks are excluded because of data gaps.
Source: Grattan Institute analysis of Queensland Health (ibid).
4.2 Stage two: Governments bail hospitals out
Governments step in with a bailout so hospitals can stay open. The alternative would be hospital services closing because they can’t pay their bills.93Some organisations in England that run deficits have reported delaying payments to suppliers: Jefferies and Wickens (2025). That would be devastating for patients, and political suicide for governments.
Hospital bailouts are outside the usual budget process. They come out of contingency funds,94Such as Treasurer’s advances: The Centre for Public Integrity (2025). or supplementary appropriation bills.
In 2025, the ACT recorded its largest ever bailout of $227 million after a ‘perfect storm’ of higher costs and increased demand.95Lindell (2025).
In 2023, Victoria handed a $422 million bailout to more than 20 hospitals that were forecast to finish the financial year in the red.96Carmody (2024).
In South Australia, the 2024 Mid-Year Budget Review revealed a hospital funding top up of $672 million in addition to the $1.6 billion in extra funding already announced in June that year.97SA Treasury (2024).
Bailouts happened before COVID too. In 2019, the NT chief minister called out the health department as one of the ‘serial offenders’ for overspending.98E. Smith (2019). In 2012, NSW gave hospitals $73 million to cover deficits.99Duckett and Breadon (2014b).
4.3 Stage three: Tighter leash
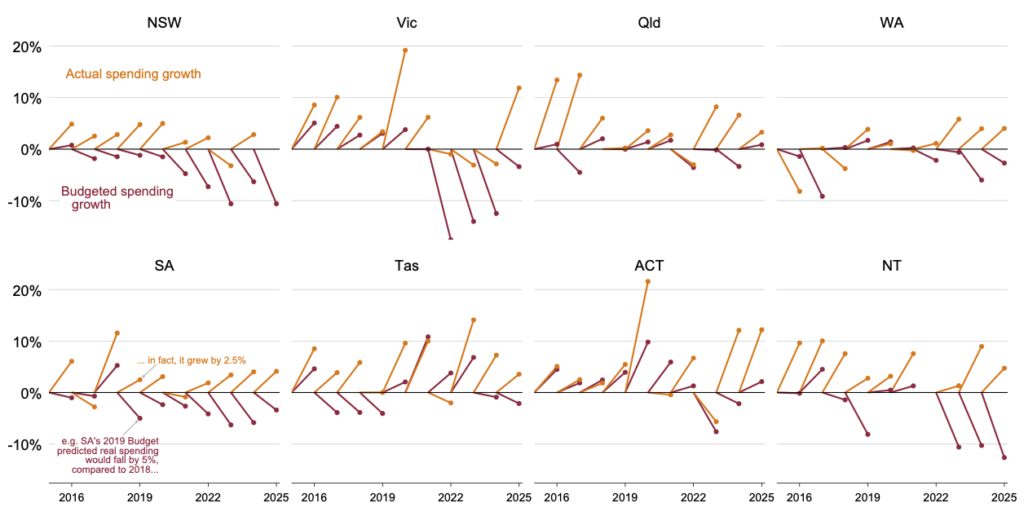
Governments try to enforce discipline on hospitals by imposing unrealistically tight budgets. Health budgets are often forecast to decrease in real terms (Figure 4.5). That’s despite population growth and ageing, which push spending up, not down.
Figure 4.5: Hospital spending almost never goes down… but state budgets often assume it will
Percentage change from last year’s actual spending, 2025 dollars
Note: Actual data for NSW for 2025 were not available at the time of publication.
Source: Grattan Institute analysis. See Appendix A for sources and definitions of in-scope spending (which differ by state).
Many states’ hospital budgets are a triumph of hope over experience. Even before COVID, NSW, SA, Tasmania, and the NT routinely forecast real spending declines. And since COVID, Victoria, Queensland, WA, and the ACT have also budgeted less hospital spending, in real terms, than the year before. In reality, real hospital spending almost always increases.
Unrealistic budgets beget bailouts. Governments lose credibility to enforce targets without forcing hospitals to close services or compromise care. And canny CEOs know other hospitals will probably also exceed their unrealistic budgets, reducing the ignominy of a deficit.
4.4 Stage four: Hospital productivity is paralysed
The soft budgeting cycle dulls hospitals’ incentive and ability to invest in efficiency.
Hospital leaders have many competing priorities: elective surgery wait times, emergency department wait times, patient safety, and staff satisfaction, among others. If managers anticipate that budget deficits will be covered, it’s easy for efficiency to fall to the bottom of the list.100Brekke et al (2015).
This has flow-on effects through the hospital. Clinicians can be less receptive to productivity initiatives if they see no downside in financial overspends and no reward for responsible cost control. And uncertain budgets make it hard to plan well. Hospitals may not know their final budget until very close to the start of the financial year.101For example, NSW did not release local hospital network budgets for the 2024-25 financial year until 20 June 2024: Central Coast Local Health District (2025). This can make it harder to make long-term investments, retain staff, hire for new initiatives, or enter into agreements with partners (such as Primary Health Networks).102Beasley (2025).
4.5 Rinse and repeat
Soft budgeting is a self-fulfilling prophecy. Even a small, one-off bailout can be enough for the belief to take hold that budget constraints are aspirational, rather than binding.103Pettersson-Lidbom (2010), and D. J. Wright (2016). That changes decision making, making blowouts more likely next year.
Soft budgeting has been documented overseas, in hospitals and other institutional settings.104Including in Sweden (Dietrichson and Ellegård (2015) and Pettersson-Lidbom (2010)), Austria (Berger et al (2020)), Germany (Fink and Stratmann (2011)), Norway (Tjerbo and Hagen (2009)), Italy (Levaggi and Menoncin (2013)), the US (Shen and Eggleston (2009)), Poland (Dobrowolski et al (2023)), and the Netherlands (Allers (2015)).
For example, in Italy, regional governments persistently overspent their health budgets during the 1990s, anticipating that the central government would bail them out.105Bordignon and Turati (2009). Bailout expectations – and overspending – abruptly stopped when Italy made strict fiscal reforms to enter the Eurozone. But once expectations of rescue returned, overspending returned too.
In Austria, hospitals were consistently bailed out by state governments in the early 2000s.106Berger et al (2020). After the 2009 Eurozone crisis, some states had high levels of debt and were unable to bail out hospitals. Hospitals in those states improved their efficiency relative to hospitals in low-debt states, which continued to operate under soft budget constraints.
5 Provide realistic budgets
To break the bailout cycle, public hospital budgets need a reset. State governments should give hospitals realistic budgets based on credible, transparent cost and demand projections. Good performers should get three-year, rather than one-year, budgets.
To enable the budget reset, the federal government and state treasuries need to move on from crude caps and fanciful forecasts to stable and realistic funding. Ultimately, this will help hospitals plan and invest to improve productivity and deliver more care for every dollar.
5.1 Hospital funding should reflect predictable cost drivers
Going to hospital might be unexpected for an individual. But at a community level, hospital demand is usually fairly predictable. A bigger population means more hospital visits. Older, sicker, and poorer people visit the hospital more. Costs rise when doctors and nurses negotiate higher salaries or expensive new technologies are rolled out.
It sounds basic. But even before COVID, most state budgets routinely forecast hospital spending would fall in real terms – despite population growth and ageing (Figure 4.5). That’s one reason budgets have run over in most states, in most years, in the past decade (Chapter 4).
We ran a very simple model predicting hospital spending based on the previous year’s actual spending and the state’s average growth rate over the decade (Figure 5.1).107While each year’s final spending won’t be known when the next budget is put together, most include an estimate. It had a much lower prediction error than official budget numbers.108It might be unfair to allow our model to look forward, so we re-ran it using only past years for the growth rate. That model still did better than the budget estimates in every state except Victoria and the ACT.
Figure 5.1: Budgets are less accurate than a simple trend line
Mean annual prediction error, 2016–2025
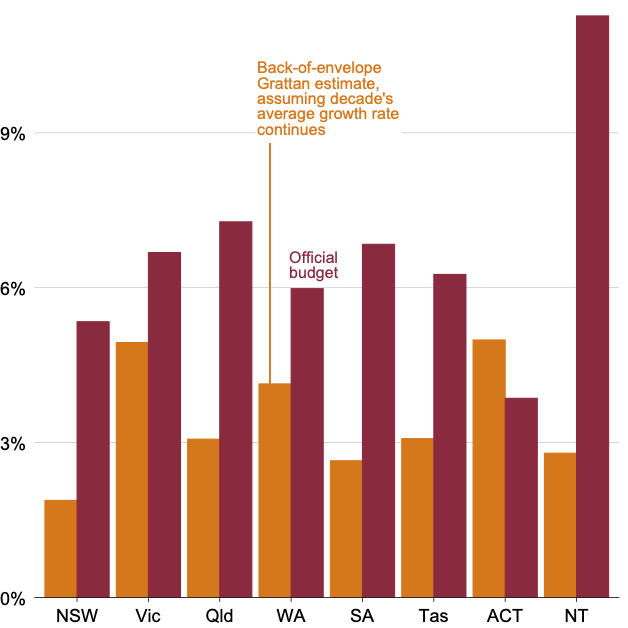
Notes: Mean prediction error is the mean absolute difference from actual hospital spending, as share of actual hospital spending. Our model calculates the growth rate for each state from 2016 to 2025 (2024 for NSW). We exclude the COVID period (2020, 2021, and 2022). We then applied that growth rate to the previous year’s actual real spending to get our prediction for each state.
Source: Grattan Institute analysis. See Appendix A for sources and definitions.
Other countries have more sophisticated approaches. In England, Scotland, the Netherlands, and parts of Canada and Sweden, local health funding is allocated according to the cost of care and measures of local healthcare need.109Including age, socio-economic status, morbidity, and mortality: Penno et al (2013). Before activity-based funding, NSW used a similar approach to distribute funding to health districts.110Gibbs et al (2002).
Australia, too, should use population data to estimate hospital demand, and better evidence to predict cost. This should inform federal and state funding decisions.
That doesn’t mean that budgets will be set by omnipotent formula, with governments forced to foot the bill unquestioningly. We elect governments to make tough decisions about taxing and spending across portfolios and service systems, of which hospitals are just one.
But this approach provides a good baseline to understand roughly what it will really cost, when all the bills come due. Then we can have a realistic debate about whether that level should be adjusted up or down, and what trade-offs we’re willing to make to pay for it.
5.2 Change the crude growth cap
The federal government should relax its crude cap on hospital spending growth and contribute to reasonable increases in demand and cost. But the cap should push productivity. It should be reduced while there is clear evidence of avoidable cost – except for states that adopt pricing reforms.
Since 2017, the federal government has limited the growth of its public hospital funding to 6.5 per cent a year (Box 4).
The cap means the federal government’s share of spending growth falls when inflation is high,111One anonymised jurisdiction reported that, historically, price growth accounted for 40 per cent of the available extra federal dollars, but consumed 69 per cent of extra dollars after 2022-23: Huxtable (2023). or when a state’s population is booming. Since 2018, state governments have funded three quarters of the growth in public hospital spending.112Duckett (2025a).
Ignoring the structural drivers of cost growth risks funding shortfalls and dilutes accountability. And the cap gives states an incentive to deliver 6.5 per cent growth every year. Otherwise, future federal contributions to every dollar under 6.5 per cent are effectively lost.113Huxtable (2023).
Hospital spending is determined by the number of admissions and the cost of each admission. The federal government shouldn’t lump them together. Its cap should separate demand growth and cost growth.
The federal government should pay its fair share – the agreed Commonwealth contribution rate – of demand growth based on recent trends.114Weighted activity, reflecting the number and complexity of admissions. It should set an annual cap for each state based on expected population growth115Adjusted for age, morbidity, and socio-economic status. State-specific caps reflect states’ different population health needs, which are expected to diverge further. For example, Treasury projects that the share of Tasmania’s population 70 years or older will grow from 16 per cent in 2024, to 21 per cent in 2035, while Victoria’s will grow from 12 per cent to 14 per cent: Centre for Population (2024). Given that these data are available, we think this is a better approach than a flat cap of 4-to-5 per cent, as recommended by Huxtable (2023). and national patterns of hospital use by demographic group.116Current patterns would be the baseline, but governments could agree to exceptions, for example, to address long waiting times for some regions.
That would share the cost of population shifts, make it easier for states to set realistic budgets, and give the federal government extra motivation to improve primary care, which can reduce hospital visits.117Breadon and Romanes (2022).
The federal government’s contribution to cost growth should rise and fall with the cost of care – the national efficient price. But its contribution should be adjusted down while there is clear evidence of avoidable cost in the national efficient price, as we show in Chapter 2.118We recommend that the Independent Health and Aged Care Pricing Authority conduct similar analysis, which can inform future deliberations: Chapter 6. States that agree to adopt new, more efficient prices developed by the pricing authority (Chapter 6) should be exempt from the avoidable cost deduction.
The deduction should be large enough to give states a strong incentive to adopt the new efficient prices, and to protect the federal government from full exposure to inefficient cost growth.
Box 4: The federal government’s growth cap
Federal and state governments jointly fund and provide health services under the National Health Reform Agreement (NHRA).aThe federal government also contributes through the Commonwealth Grants Commission, and pays Medicare benefits (worth $790 million, in 2023-24) for private patients in public hospitals: AIHW (2025a).
The first NHRA, which introduced activity-based funding, was signed in 2011. The Gillard government agreed to pay 45 per cent of the ‘efficient growth’ in public hospital costs, increasing to 50 per cent by 2017-18.bMaskell-Knight (2021).
Equal cost sharing was never achieved. In 2014, the Abbott government scrapped the 50:50 cost sharing target. When the NHRA was amended in 2017, the Turnbull government capped the federal government’s spending growth to 6.5 per cent a year. The federal government’s share of overall public hospital funding has declined since then: from 45 per cent in 2016-17 to 39 per cent in 2023-24.cAIHW (2025a).
State and territory governments argue that the 6.5 per cent cap is too low, and that the federal government’s share of public hospital spending is growing too slowly.dHuxtable (2023, p. 31). In a joint statement, first ministers said the federal government’s public hospital funding will fall ‘tens of billions of dollars short of what is needed’.eCouncil for the Australian Federation (2025).
The Albanese government has committed to increasing its overall share of funding to 45 per cent by 2035, and to a more generous growth cap.fButler (2025).
5.3 State governments should set realistic budgets
All states should adopt a predictable, realistic approach to hospital budget setting. Baseline budgets should grow in line with the population and inflation. Population growth should be adjusted for age and morbidity.119OECD (2024). Inflation assumptions should reflect hospital-specific cost growth, such as new treatments, agreed wage increases in enterprise bargaining agreements, and the cost impact of other terms agreed in bargaining (such as changes in staff-to-patient ratios).
Just like overall hospital budget setting, local hospital network budgets should be based on a transparent, realistic assessment of needs. They should reflect population growth, adjusted for age, disease prevalence, and socio-economic status.
Even simple rules of thumb based on past spending trends and population growth would be an improvement on current practices. NSW has the right elements of a guiding formula: it applies a baseline assumption that hospital spending will increase by 4 per cent (2.5 per cent for cost growth, and 1.5 per cent for service growth).120The baseline is adjusted for exceptional factors, such as high levels of inflation, and to reflect policy decisions: Beasley (2025). But persistent budget overruns suggest it may need to be re-calibrated.
Over time, states should work towards more sophisticated models, incorporating changing expectations and technological change. For example, the Netherlands incorporates the impact of new technology, new pharmaceuticals, and income growth in its medium-term health expenditure projections.121OECD (2024). Once budgeting has stabilised, states should move to multi-year budgeting for health spending, like the UK and New Zealand, enabling departments to plan better.122Gainsbury (2025), and Ministry of Health NZ (2024).
Initially, these changes would make each state’s budget look materially worse. But we shouldn’t hide from the inevitable. Today, the extra hospital spending comes anyway, it’s just hidden in Treasurer’s Advances or special measures at the end of the financial year. Putting it on the books would be good for budget honesty and transparency.123The Centre for Public Integrity (2025).
Realistic budgets are also essential for reawakening productivity in hospitals. A credible budget means each hospital can be held to account for its financial performance – good or bad (Chapter 7).
That’s essential for restoring the incentive, and culture, for continuous improvement that can drive all hospitals, even today’s best performers, to do better every year.
5.4 Transition to multi-year budgets
Hospitals that have demonstrated sufficient financial management capability should be given three-year budgets, enabling them to plan better and focus on long-term efficiency and quality of care.
At the moment, many hospitals don’t get their final budgets until a month or two before the financial year starts, or even partway through the year.124The Special Commission of Inquiry into Healthcare Funding (2024).
This makes it harder to invest in initiatives that take a while to deliver benefits. It can take months to hire staff for new service models, and positions may be hard to fill if hospitals can’t offer long-term contracts because of funding uncertainty.125In consultations, we heard that short-term budgets can cause employment insecurity and stress for staff, who can’t be offered contracts until the last minute because hospitals don’t know their final budgets. New processes often have teething problems before they start delivering benefits. Multi-year budgets would enable hospitals to recoup, and reinvest, surpluses from efficiency.
Introducing multi-year budgets is a big change. State governments should start with hospitals that have demonstrated good financial management and met other key performance measures (Chapter 7). And they should invest in financial management capability across the system, to set the stage for further expansion.
Multi-year budgets don’t mean governments write a cheque and walk away. They must be accompanied by comprehensive monitoring, throughout the budget period, to ensure hospitals are on track on financial and other metrics – as well as clear consequences for poor performance (Chapter 7).
6 Set the right price
Realistic budgets and better performance management (Chapter 7) will end bailouts and restore productivity incentives. But even more progress can be made with more efficient, fairer prices.
The prices hospitals are paid cover avoidable costs that should be out, while excluding necessary costs that should be in. Prices should change to reflect the true cost of efficiently providing high-quality care. That will underpin better budgeting, and make prices fairer.
The pricing authority should develop pricing model changes that exclude at least $1 billion of unnecessary costs. States should adopt these changes to get the best value for their hospital dollars. States that do should get more generous growth funding from the federal government.
At the same time, the pricing authority should review the price to make sure the cost of treating older and more complex patients is covered. And the federal government should foot the bill for temporary accommodation for patients waiting in hospital for an NDIS plan or aged care place.
To support these changes, the accuracy of data used to calculate hospital prices should be continuously improved through stronger oversight by the pricing authority.
6.1 Don’t pay for unnecessary costs
As Chapter 2 shows, an estimated $1.2 billion in public hospital spending isn’t needed, and doesn’t help patients. The prices hospitals get for each admission should exclude more unnecessary costs, and move closer to paying only for best-practice care.
This will send a strong signal to hospitals about where savings can be made without harming patients. And it can help break the soft budgeting cycle, by giving governments confidence that spending is on high-value services and cost growth will be contained. That will help unlock the realistic, predictable budgets we proposed in Chapter 5, and avoid crude cuts.
Governments should ask the pricing authority to develop pricing models that cut at least $1 billion of avoidable costs. The new models should be applied nationally in the next funding agreement, from 2031. In the meantime, states should be able to apply them to their own hospital prices. States that do should get a more generous federal spending cap (Chapter 5).
The following sections outline some of the models the pricing authority should develop, and those it shouldn’t.
6.1.1 Prices should encourage best-practice short stays
For some kinds of care, short and same-day visits are better for patients and government budgets (Chapter 2). Many countries have changed prices to reflect that.
Austria, Denmark, England, France, Germany, and Norway have hospital prices that encourage same-day care. Most pay the same for same-day and longer visits, creating a strong incentive to send patients home sooner.126Kreutzberg et al (2024). Germany pays the same base amount, with a per-night deduction that can reduce the payment by, at most, 30 per cent: Hengel (2023). England pays more for some same-day visits.127Gaughan et al (2019).
These policies generally cover many different types of procedures. For example, France’s ‘single tariff’ list covers more than 40 groups of procedures, including cataract extraction, paediatric tonsillectomy, varicose vein surgery, inguinal hernia repair, and cholecystectomy.128French Association of Ambulatory Surgery (2015). Germany’s policy is even broader, applying to any care that can be provided in the same day.129As long as it lasts at least six hours, is considered appropriate by the hospital or doctor, and the patient agrees: Hengel (2023).
In Australia, for many procedures, hospitals get a lower payment for same-day stays than longer stays.130For the 121 procedures that have a special same-day payment rate, the overnight stay payment is, on average, 4.2 times higher than the same-day payment: IHACPA (2025b).
The pricing authority should adjust prices to offer a stronger incentive for same-day and short-stay care, for procedures where clinical experts advise it is safe. Same-day visits should get the same payment as longer stays. And that price should be based on expert advice on the overall share of procedures that should be same-day admissions.
6.1.2 Overhaul the outliers
Visits shorter than one third of the average length of stay, and those more than three times the average, are considered outliers. They are not used to calculate standard payments, to stop unusual or inappropriate visits from influencing payment levels (Box 5).
There is no clear rationale for Australia’s outlier thresholds, which were first developed when activity-based funding was introduced in Victoria in the 1990s. Back then, hospital visits were much longer. Today, average lengths of stay are shorter, and the distribution of visits within each diagnosis-related group has changed.131KPMG (2019). Most visits are much shorter than the average length of stay.132For most diagnosis-related groups, the average length of stay falls between the 60th and 75th percentile, excluding diagnosis-related groups with a high proportion of same-day or one-night admissions: PricewaterhouseCoopers (2019).
The current rules exclude a large swathe of short visits: in most diagnosis-related groups, one in four visits are short-stay outliers.133There’s significant variation across diagnosis-related groups, with the share excluded ranging from close to zero to more than 50 per cent: PricewaterhouseCoopers (ibid). This analysis excluded diagnosis-related groups that are on the same-day list or have a high proportion of one-night separations. By contrast, very few long visits are excluded – only about 2.5 per cent for most diagnosis-related groups.
Other countries’ rules include shorter stays and exclude longer stays. In some countries, no visits are excluded for being ‘too short’ when calculating payments for inlier visits.134Among six systems assessed in Stephani et al (2018), England, Denmark, and the US had no lower-bound limits. Some countries without lower-bound rules price same-day care separately, so those episodes are not in the length-of-stay distribution. And most have a stricter upper limit, excluding more long-stay care.135England and Denmark use the third quartile of the distribution plus 1.5 times the interquartile range: Stephani et al (ibid). In France, the range is from approximately 40 per cent to 250 per cent of the average: French Technical Agency for Hospital Information (2010). In Austria, it is from 50 per cent to 150 per cent of the average (to 130 per cent for psychiatry): Belgian Ministry of Social Affairs, Health, Care and Consumer Protection (2025). Estonia includes admissions within two standard deviations of the mean: Stephani et al (2018). Ireland includes admissions within two standard deviations of the log-transformed mean: KPMG (2019).
Adopting these rules would lead to more short-stay outliers being included, and more long-stay outliers being excluded.136For example, when KPMG (ibid) applied the interquartile range method to Australian data, the lower bound decreased in 43 per cent of groups, and the upper bound decreased in 91 per cent of groups. When they applied the Irish trimming method, the lower bound decreased in 35 per cent of diagnosis groups, and the upper bound decreased in 59 per cent of groups. The pricing authority should revise its definition of length-of-stay outliers to better capture efficient care, drawing on international best practice and local clinical expertise.
For some diagnosis-related groups, the new limits might still include some long-stay visits that drag up the average cost too far.137For example, under the current thresholds, there were more than 40 diagnosis-related groups where, for the average admission, price exceeded cost by more than 10 per cent: PricewaterhouseCoopers (2019, p. 24). If that happens, the pricing authority should use the median instead of the average to calculate the cost weight for those groups.138EY (2019).
Box 5: How activity-based payments are calculated
The pricing authority sets a single base price called the national efficient price (NEP).aThis box presents a simplified summary, based on IHACPA (2025c). Despite the name, the NEP is essentially the average cost of care, after some adjustments.
Hospital visits are grouped into diagnosis-related groups of similar kinds of care, and subgroups based on complexity. For each, the authority calculates price ‘weights’ that set payments as a proportion of the NEP – a small fraction for cheap types of care, and higher than the NEP for expensive types of care.
The weights differ based on how long a patient stays:
– Short-stay outliers less than a third of the average length of stay get a base cost plus a daily payment.bThe base cost is the average of total operating room, special procedure suite, and prosthesis costs.
– Inlier visits last between a third and three times the average length of stay and are funded at the average cost of those visits.
– Long-stay outliers are more than three times the average length of stay. They receive the inlier visit price, plus a daily payment for days beyond the maximum inlier visit length.cThe inlier bound is narrower for 21 diagnosis-related groups with very high-cost long-stay outliers.
This approach is intended to stop unusually short and long visits from shifting the price up or down.
6.1.3 Remove avoidable costs
The pricing authority could directly estimate avoidable cost in the system and tell states how much they need to reduce their state price to exclude remaining avoidable costs.139The authority could calculate avoidable cost in a similar way to our estimate in Appendix B. It should also consider more sophisticated techniques such as stochastic frontier analysis or data envelopment analysis, although there are fewer precedents for using them to determine funding: O’Donnell and K. Nguyen (2011). Each state funds hospitals at a different proportion of the national efficient price (some are higher, some are lower, and some states use multiple prices). The pricing authority would tell them how much to reduce their price(s) to remove avoidable costs remaining after length-of-stay pricing changes.
England has used a similar approach. Potential efficiency gains are estimated from variation in hospitals’ costs, after controlling for case mix, patient, and hospital characteristics.140Monitor (2016a). This estimate informs the ‘efficiency factor’ applied to prices each year.141Every year, prices increase by inflation, less the efficiency factor. The modelling results are one input into the determination of the efficiency factor: e.g. Monitor (2016b). Since COVID, the model has not been used: NHS England (2025a).
Removing avoidable costs is based on statistical analysis, not clinical evidence and judgement, and is based on cost, not length of stay. Since it is harder to review, this change should be phased in more slowly to reduce risk and enable monitoring of any unwanted impacts.
6.1.4 Pricing models not to focus on
More complex ways to pay for best-practice care have been tried in other countries, and a large body of evidence now suggests that they are unlikely to achieve significant cost reductions.
These models include payments for a bundle of care in different settings (such as acute care and rehabilitation for a surgery), payments for achieving outcomes, or payments for specific clinical or reporting activities. Despite their popularity, there is no clear evidence that they significantly improve outcomes or reduce costs, with a few exceptions (Box 6).
Box 6: Value-based payments haven’t lived up to expectations
Value-based payment models try to promote high-value care through financial incentives. Models include:
– Bundled payment: a single, fixed payment that covers all services related to an episode of care (such as maternity care).aIHACPA (2025d).
– Pay-for-performance (P4P): P4P models reward hospitals for desirable health outcomes or care processes and penalise undesirable ones. They are usually implemented alongside activity-based funding.bCutler (2022).
Value-based payment is more complex than activity-based funding. Authorities must comprehensively define condition- and procedure-specific performance measures.
Reviews suggest value-based payment models have limited impact on quality and cost. A 2024 review of patient safety P4P in hospitals found more than half of all included studies showed no improvement. Studies that did show an improvement were not high quality.cSlawomirski et al (2024). These findings align with an earlier systematic review of P4P in hospitals, which found little to no impact in their favour: Mathes et al (2019). A 2023 review found that bundled payments for joint replacements can lower costs while maintaining or improving care quality.dOECD (2023). However, the evidence on the impact of bundled payments for other conditions is mixed, and researchers are still identifying the factors that predict success.eSteenhuis et al (2020).
Australia has already changed pricing to improve quality and safety. The results have been encouraging, but there may be limited scope to reduce unnecessary costs by taking these reforms further (Box 7).
That’s why we recommend simpler, easier to implement approaches that still move closer to paying for what care should cost.
Box 7: Safety and quality pricing in Australian public hospitals
Between 2017 and 2019, Australia implemented three safety and quality pricing reforms:aIHACPA (2025e).
– Hospital-acquired complications (HACs): a funding cut when a patient develops one of 13 potentially avoidable complications.
– Avoidable hospital re-admissions (AHRs): a funding cut when patients are re-admitted for a condition clinically related to their initial admission, if that re-admission could have been avoided through better clinical management or discharge planning.
– Sentinel events: hospitals receive no funding for sentinel events – ‘never events’. For example, a medication error leading to serious harm or death, or discharging an infant to an unauthorised person.
The financial penalty for HACs has shown the most promise. One study suggested the policy resulted in 98,970 fewer HAC episodes from 2018 to 2021.bSlawomirski et al (2025).
Opportunities for this payment model to reduce avoidable costs may be limited. For example, Slawomirski et al (2025) found that most of the fall in HACs happened in the first year the financial penalty was announced.
6.2 Pay for necessary costs
6.2.1 Cover the cost of more complex patients
It costs more to treat older patients and people with more co-existing health conditions. That should be reflected in hospitals’ payments.
We isolated the cost of caring for patients who are older and have more health conditions.142See Appendix B for more information on how we conducted this analysis. Estimates are inflated to 2025 dollars by the growth in the national efficient price. After taking other factors into account, it costs $210 more to treat a patient in their 70s, and $416 more to treat a patient in their 80s, than someone in their 40s.143Older people tend to be more frail, which increases treatment costs: Álvarez-Bustos et al (2022). PricewaterhouseCoopers (2019) also found that older patients are more costly to treat, and recommended a price adjustment. Those costs have increased in the past six years (Figure 6.1). And a patient with more health conditions costs $611 more to treat.144Effect of a one standard deviation increase in Elixhauser index: Appendix B. People with multiple conditions, even those not directly related to the main reason they are in hospital, tend to stay longer and need more intensive care: Breen et al (2020) and Stahl-Toyota et al (2023).
Figure 6.1: The cost of treating elderly and more complex patients has increased
Marginal cost compared to patients aged 40-49
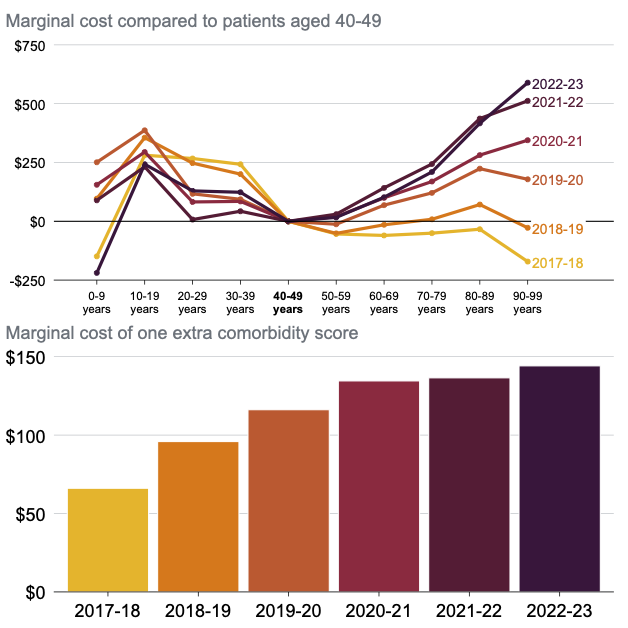
Notes: Point estimates from separate regressions for each year. We inflated estimates to 2025 dollars, using growth in the national efficient price, for comparability. We adjust for a wide range of legitimate causes of cost. However, other legitimate cost drivers are not captured in the data and may be responsible for some observed variation. The numbers in this chapter are based on analysis of the National Hospital Cost Data Collection. This is the best aggregated source of data on hospital costs, but it’s not perfect – for example, there may be differences in the way costs are recorded across states. See Appendix B for more detail on data, methods, and limitations.
Source: Grattan Institute analysis of IHACPA (2025a).
These estimates are on top of the cost differences already captured in the price hospitals are paid for a hospital visit. Australia’s pricing model makes some adjustments for age and complexity.145For some diagnosis-related groups, an admission is classified as ‘major’, ‘intermediate’, or ‘minor’ complexity, depending on a patient’s comorbidities and other factors (including age, in a small number of diagnostic groups): IHACPA (2025f). But our analysis shows that these limited adjustments aren’t capturing all the extra costs of treating older patients and people with more health conditions.
Patient profiles vary across hospitals (Figure B.2), so these costs create unfunded burdens for some hospitals and windfalls for others. That puts quality of care at risk, could widen gaps in health outcomes, and makes hospital funding less fair. Plus, it makes it harder for some hospitals to meet their budgets, perpetuating cost overruns and bailouts.
Other countries have taken steps to make hospital prices fairer. Canadian hospital funding uses five age groups within each diagnostic group.146Neonates, paediatric, 18-59, 60-79, and 80 and older. See for example the application in Ontario: Canadian Institute for Health Information (2016). Many state Medicaid programs in the US use a pricing model that adjusts for severity of illness and risk of dying.147On top of diagnosis-related groups and splits: Institute for Medicaid Innovation (2023).
Australia’s pricing authority should review options to adjust prices so they more accurately reflect the expected cost of treating every patient, and implement any recommended changes by 2029. This won’t cost money, but it will shift funding to the hospitals and patients that need it.
6.2.2 Cover the cost of getting healthy patients out of hospital
Some patients stay in hospital after they are medically ready for discharge because there is nowhere else for them to go. They might be waiting for a place in residential aged care, or for a decision on an NDIS or guardianship application.148Salonga-Reyes and Scott (2016). Those extra bed days should be funded differently from bed days that are needed for health reasons.
In 2022-23, about 1.32 per cent of all hospital patient days were taken up by patients waiting for a place in a residential aged care facility.149Productivity Commission (2025b). The average NDIS participant waits 16 days in hospital after being assessed medically ready for discharge.150National Disablity Insurance Agency (2025). State governments report that, all up, about 8-to-10 per cent of public hospital bed days are taken up by people waiting to be discharged somewhere else.151Duckett (2025b).
No one likes being in hospital longer than necessary. Patients can become bored or depressed, and are at risk of picking up extra infections or complications (Section 3.2).152Rojas-García et al (2018), and Everall et al (2019).
And providing acute care for these patients is expensive. The average cost of a hospital visit for a new resident at an aged care facility is $6,552 higher than for an otherwise identical patient returning home.153We inflated the marginal effect from 2022-23 by the growth in the national efficient price to 2025-26. This estimate is a lower bound, because some people who are discharged back home or to an existing place at a residential aged care facility might also spend extra time in hospital waiting for more intensive support packages.
Across all patients, this adds up to about $75 million per year.154About 11,500 patients were discharged to a new place in an aged care facility in 2022-23. Delayed discharge also creates downstream costs, blocking beds and flow through the hospital.
The extra cost is driven by a long tail of admissions with very high unexplained cost, after accounting for age, comorbidities, and other admission and fixed hospital characteristics (Figure 6.2).
Figure 6.2: New aged care residents have higher unexplained costs
Difference between actual and expected cost
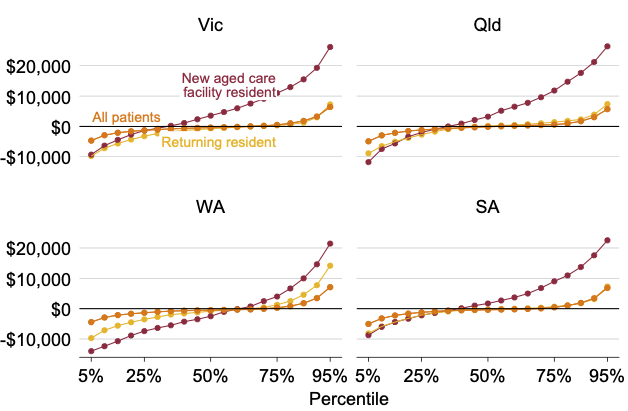
Notes: Residual from admission cost regression, without controlling for discharge destination, on subset of population discharged to an aged care facility. We adjust for a wide range of legitimate causes of cost. However, other legitimate cost drivers are not captured in the data and may be responsible for some of the observed variation. The numbers throughout this chapter are based on analysis of the National Hospital Cost Data Collection. This is the best aggregated source of data on hospital costs, but it’s not perfect – for example, there may be differences in the way costs are recorded across states. See Appendix B for more detail on data, methods, and limitations.
Source: Grattan Institute analysis of IHACPA 2025.
The federal government is responsible for aged care and the NDIS. It should pay for the cost of hospital stays after someone is medically ready to leave, plus the cost of a temporary solution (such as hospital-in-the-home, or private accommodation) arranged by the state government or hospital until permanent accommodation is found.155This penalty would only apply when discharge is contingent on NDIS-funded supports, such as housing support.
This will strengthen the incentive for the federal government to improve its systems. Overseas experience suggests financial penalties for governments responsible for community care can reduce hospital length of stay (Box 8).
To give the federal government time to identify and overcome barriers to accepting healthy patients from hospital, the policy should kick in after one year.
Box 8: Several countries impose financial penalties for hospital exit blockers
Delays in discharging patients to community care services is not unique to Australia.
Other countries have responded by applying financial penalties on levels of government responsible for community care services.
Since 1992, municipalities in Sweden have been financially liable for patients reported as ‘exit blockers’. In 2018, as part of the Care Coordination Act, the grace period before an exit blocker triggered a financial penalty was cut from five days to three. An evaluation of the Act found it reduce average length of stay, resulting in 248,521 fewer care days over a period of 21 months.aSpangler et al (2023).
Following the example of Sweden, the Community Care Act 2003 in England allowed National Health Service Trusts to fine local authorities £100 per day two days after the patient is deemed medically fit for discharge.bUK Government (2003). In 2022, the UK abolished the penalty payment. The UK now focuses on home discharge assessments to reduce the number of delayed discharged patients: Rogers et al (2023).
Norway, too, requires municipalities to pay hospitals a set fee per day for patients medically fit to be discharged to a community service.cAmbugo and Hagen (2019). In 2016, the fee was about A$700 per day. One study found the introduction of the penalty reduced bed blocking by about 58 per cent – even larger than originally expected, because more patients were actually ready for discharge than recorded before the policy changed.dKverndokk and Melberg (2021).
6.3 Ensure pricing data are accurate
Every patient admission is assigned a clinical code that determines activity-based funding. Clinical coding can be wrong due to missing patient information.156In the UK, the average accuracy of coding is about 83 per cent: Dong et al (2022). One NSW study found 19 per cent of diabetes diagnoses, and 51 per cent of hypertension diagnoses, weren’t recorded: Assareh et al (2016). Another Australian study found more than 20 per cent of stroke cases were missing from hospital codes: Ryan et al (2021). But errors aren’t always mistakes. There is evidence of ‘upcoding’ – intentionally inflating the complexity of a patient’s case to increase funding.157Pongpirul and Robinson (2013), Crespin et al (2024), and J. Lin and Pantano (2025).
Our recommendations would remove avoidable costs, and impose bigger consequences for deficits. That would increase the incentive to upcode, or inflate the cost data used to set the price for care.158Hospitals may also reclassify parts of a visit to reduce apparent length of stay.
There are safeguards in place, including the pricing authority’s national costing standards, financial reviews,159KPMG and IHACPA (2022). clinical coder training and accreditation, state audits of clinical coding,160For example, Queensland Health (2018). continual improvement of clinical coding standards,161Health Information Management Association Australia (2025). and promotion of best practice.
But stronger incentives to misreport data should be matched with stronger safeguards. As an independent body, the pricing authority should commission audits of cost data and clinical coding.162The independent Audit Commission in the UK commissioned extensive audits of hospital data accuracy: Capita (2013) and Peskett et al (2008). Audits in the US have recouped significant funding: Harrison and Barksdale (2013). A reference group of hospitals should also be established with good data processes, practices, and accuracy. This would help the pricing authority identify data issues outside these hospitals, while highlighting and promoting best practices.
7 Hold hospitals to account
Realistic budgets and fairer prices shouldn’t be cheque and forget. Health departments should be active system managers – setting clear expectations, regularly monitoring performance, and holding hospitals to account.
It’s a two-way street. Well-run hospitals should be rewarded with greater autonomy (including multi-year budgets), while those that overspend should face escalating scrutiny and interventions.
Most states already have elements of this approach in place, at least on paper. But none has the royal flush of financial management supports and controls, and none has consistently followed through with tough consequences for persistent deficits.
7.1 Set clear expectations
Governments should outline clear performance frameworks with a limited number of priorities. One should be financial performance.
Each hospital’s service or performance agreement should include an explicit expectation that hospitals break even. This is only fair if budgets are realistic (Chapter 5). Once budgets are reset, that’s it: failure to meet expectations – unless there are extreme, extenuating circumstances – should trigger interventions.
Performance frameworks should have measurable, objective metrics and criteria (see Box 9 for an example).163Peake et al (2022). This helps make sure everyone – clinicians, executives, bureaucrats, and ministers – is clear about priorities. And it creates a default of intervention if expectations aren’t met. A hands-off minister or department must justify why they’ve failed to take action.
Box 9: England’s Oversight Framework
National Health Service England’s Oversight Framework for 2025-26 offers an example of codified, objective performance assessment at a system level.aNHS England (2025b).
Under the new framework, each acute-care organisation will get a score (1-to-4) for key metrics covering waiting times, re-admission rates, mortality, infection rates, patient and staff survey scores, and financial performance.
Each organisation is assigned an overall score based on the average of the metric scores. The results are published, alongside an overall ranking of performance on a four-point scale. Organisations in the top 25 per cent are assigned the highest overall rating, and so on. But, crucially, there is a ‘financial performance override’: an organisation in deficit cannot be assigned one of the top two ratings.
The final rating influences how much central oversight and support the organisation receives. The top performers take a leadership role in sharing best practice, and may be able to use some of their surplus for capital expenditure. Those in the bottom half are more intensely scrutinised, and expected to deliver on recovery KPIs and trajectories. And the senior leaders of organisations in serious strife won’t get pay boosts.
7.2 Impose consequences for poor performance
Health departments should actively and regularly monitor performance against the framework, with escalating interventions for poor performance, and rewards for good performance (Figure 7.1).
Figure 7.1: The diamond of consequences
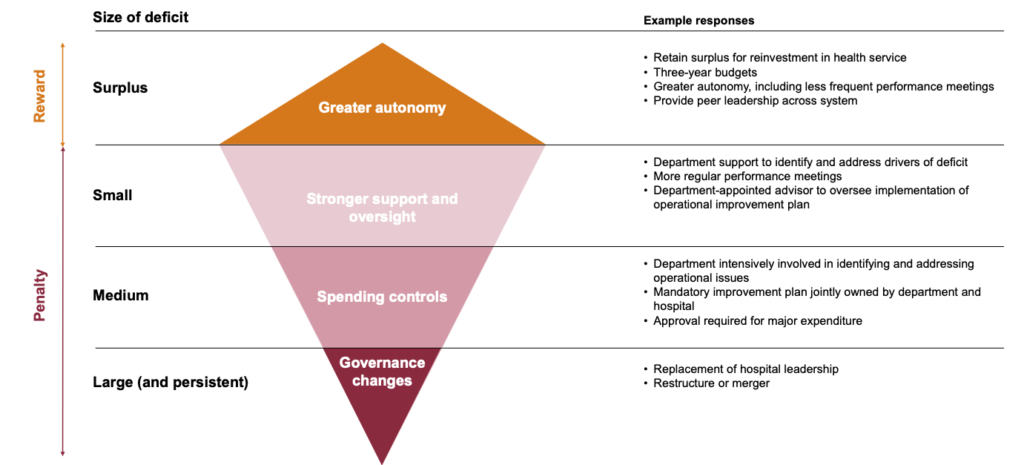
Source: Grattan Institute.
Hospitals will be able to plan better with realistic budgets. There should be no surprises at the end of the financial year. Departments should monitor hospitals’ financial and other performance indicators monthly. That requires the technical expertise to interrogate the financial data and identify emerging risks.
Hospitals that deliver a surplus and meet other key performance criteria should be rewarded with greater autonomy. They should be permitted to keep their surplus to invest in improving care and working conditions, providing a positive incentive for good financial management.164A WA review recommended this, subject to a central framework on permitted uses: Peake et al (2022). In England, organisations that deliver a surplus will soon be permitted to keep it to reinvest: NHS England (2025c).
They should get three-year budgets, allowing them to make bigger productivity investments that take longer to pay off (Chapter 5). And a history of strong management should be a factor in allocating capital for innovation (such as new research facilities), or in deciding which hospitals should be hubs for particular procedures (Chapter 9).165Victorian Department of Health (2025a).
Hospitals at risk of a budget overrun should get help to get back on track. State health departments should ensure that each hospital’s governing team has the skills they need – for example, ensuring each board has the right mix of skills, and supporting executives to further develop their financial and other management capability.166In England, CEOs explain about 6 per cent of the variance in surpluses across different organisations: Janke et al (2019).
When there are warnings of a performance issue, the government should work with the hospital to diagnose issues and develop a plan to rectify them. They should meet more regularly to ensure progress is being made.
If this isn’t enough, or there is a risk of a larger deficit, the government should opt for tougher interventions. The department should work intensively with the hospital to identify and remediate the sources of poor performance, review major expenditures, and appoint a delegate to the board.
Finally, after sustained, large deficits, local hospital network governance should change. Hospital boards and CEOs should be replaced, and broader governance reform options – such as amalgamation with neighbouring networks – should be considered.167In England, between 1998 and 2005, CEOs who delivered a bad budget one year were more likely to turn over the next; as financial performance improved, turnover rates fell: Ballantine et al (2008). Financial discipline has deteriorated more recently: NHS England (2025c).
Most states already have elements of these performance frameworks and ‘responsive regulation’ models.168e.g. Victorian Department of Health (2025a), NSW Health (2023), SA Health (2025), and WA Department of Health (2025). But in practice, none do them all: setting explicit expectations, monthly financial monitoring, allowing surpluses, and tough sanctions including removal of CEOs and boards.169For example, the independent review of WA’s health system called for enhanced use of existing, underutilised provisions permitting the Minister to appoint an advisor to a board to address performance concerns: Peake et al (2022). As we showed in Chapter 4, hospital bailouts persist, often for many years.
All states should commit to timely, accessible publication of key data on each hospital’s performance. Transparency will help everyone with an interest in public hospital spending – the federal government, treasuries, and ultimately, patients – to hold hospitals to account.
8 Help hospitals improve
Health departments should help hospitals implement best practices. They should give hospitals advice and targets to prioritise high-value productivity initiatives. Hospitals should get better, more comparable data to benchmark with peers. And they should be able to get funding for large transitions.
8.1 Prioritising improvement is important
There’s no shortage of ideas to improve hospitals. There are literally thousands of process improvement pilots and initiatives every year.170We counted 774 in Tasmania (Tasmanian Department of Health (2025a)), 528 in Queensland (Clinical Excellence Queensland (2025)), 83 in Victoria (Safer Care Victoria (n.d.)), and 68 in NSW (Agency for Clinical Innovation (2024b)) – and these are just the tip of the iceberg. At one large WA tertiary hospital, there was an average of 353 quality improvement initiatives a year – almost one a day (Figure 8.1).
Figure 8.1: Hospital innovation initiatives are common; success, less so
Number of quality improvement initiatives in one large WA tertiary hospital, by recorded outcome
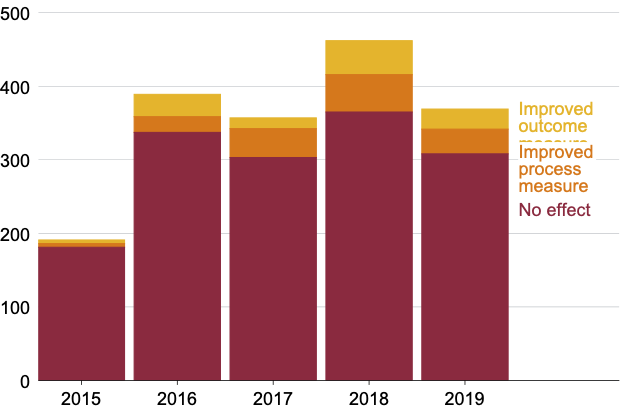
Note: ‘Improved process measure’ is net of those that improved outcomes.
Source: Q. C. Li et al (2023).
These initiatives are costly. Setting up projects, attending training, and buying new tools takes time and money.171Moon et al (2022), and Donovan et al (2023). Yet many don’t work,172Q. C. Li et al (2023), Braithwaite et al (2020), and Moraros et al (2016). or don’t last long.173Zurynski et al (2023). A study of 130 US hospitals found just 20 per cent sustained length-of-stay reductions for two years: Glasgow et al (2012). A study of 94 diabetes trials found 40 per cent of successful initiatives were not sustained. And 19 per cent of ineffective initiatives were sustained: Kearsley-Ho et al (2020).
Too many pilots means few can stick. Staff can become fatigued by constant change, and less likely to engage with new projects.174Fakha et al (2021) and Le-Dao et al (2020). And common tools, such as checklists and alerts, can lose their effectiveness when overused.175Page et al (2017), Ancker et al (2017), and Grigg (2015).
Changes have a better chance when they are prioritised, championed by executives, and integrated into regular ways of working.176Fakha et al (2021), and Woiceshyn et al (2017). Time and attention is limited: only a few projects can get the red-carpet treatment. Governments should help prioritise.
8.2 Set clear directions on productivity opportunities
State health departments or clinical improvement agencies should set clear directions for hospitals on the most promising productivity opportunities. They should publish guidance and set specific targets for high-value productivity improvements.
Most states already have bodies dedicated to supporting clinical innovation, but they are often particularly focused on safety, and could be doing more to promote system-wide efficiency.177Peake et al (2022, p. 46).
Agencies should support hospitals with expert advice on change management and implementation, including detailed case studies.178Le-Dao et al (2020). The ‘soft’ parts of innovations, such as changes in staff culture and routines, are just as important as the technical components: Moon et al (2022) and Horton et al (2018). For example, England’s National Health Service replicated all the technical components of a successful program to reduce catheter infections, but without cultural changes, such as empowering nurses to call out doctors, the initiative had little effect: Dixon-Woods et al (2013). They should link up hospitals to learn together and from high-performing hospitals, with clinical leaders spearheading change efforts.179For example, England’s Getting it Right First Time program aims to address unwarranted variation. Clinical leaders work with colleagues and hospital managers to benchmark practices and support them to improve: A. Duncan and Sayers (2023).
8.3 Give hospitals data to compare to peers
Hospital leaders, and governments, need comparable data to know which improvement efforts are needed where.
In the National Health Reform Agreement, governments should commit to publishing hospital-level data on key productivity and safety measures, including length of stay, all hospital-acquired complications,180Duckett and Jorm (2018b). cost per admission, staffing costs, and staffing numbers.
The data should be adjusted for differences between patients and hospitals, so hospitals can meaningfully compare their performance.181See Appendix B for an example. For example, some hospital-level data on hospital-acquired complications is published (IHACPA (2025g)), but it doesn’t adjust for risk factors such as age — so a hospital with a high rate of complications may simply have an older population.
8.4 Fund big transitions
Most productivity investments should stack up under multi-year budgets, since hospitals will have longer to earn back cost-saving investments.182In one Australian paediatric hospital, an effort to reduce low-value iron studies paid for itself in three days. For low-value electrocardiograms, it took 22 days, and for low-value thyroid function tests, 16 months: Lawrence et al (2024). But for really big transformations, such as embedding new workforce roles (Section 3.4) and upgrading IT systems, governments should provide transition funding.
Funding should go through the standard state and territory budget processes, and be additional to baseline hospital budgets (Chapter 5).183Alternatively, if governments establish an Innovation Fund and National Innovation Reform Agency, it could provide the funding and guidance for productivity-enhancing innovation: Huxtable (2023). And it should come with strings to get the best value, such as requiring that new IT systems be compatible across the state.
9 Save through scale
When it comes to hospitals, bigger is often better. States should leverage their size to get better value.
States should buy hospital supplies in bulk to get lower prices, and cut spending on temporary staff by setting maximum daily rates. They should also centralise more procedures in high-volume units, which are typically cheaper and safer.
And Victoria should consolidate hospital governance. That doesn’t mean fewer hospitals, just less back-office duplication.
9.1 Buy in bulk
Hospitals need a lot of the same things, from masks, to meals, to MRI machines.184Altogether, supplies and services make up about one quarter of total operating costs: Victorian Auditor General’s Office (2025). State governments should buy in bulk and use the savings to pay for more and better care.
Combining buying power typically leads to lower prices (Box 10).185There’s a lot of variation – wiggle room – when it comes to prices for many hospital supplies and services: Grennan (2013) and Bandiera et al (2009). Many products are specialised, so suppliers have some market power. And the guarantee of a large contract could let a producer take advantage of economies of scale. And it means less administrative time duplicated on negotiation.186Victorian Auditor General’s Office (2025).
Box 10: Consolidated contracts cut costs
Overseas and Australian evidence shows that hospitals pay less when they join forces for procurement.
In the US, many hospitals join ‘group purchasing organisations’ for this purpose. Being part of a group reduces the price hospitals pay for goods.aBurns and Lee (2008), Jisan et al (2025), and Grennan (2013). And there’s a direct relationship between the size of the group and the cost reduction: bigger contracts mean cheaper contracts.bH. Lin and Wang (2025).
In Italy, the introduction of centralised procurement within regional healthcare systems reduced per person health expenditure by between 2 per cent and 8 per cent, without affecting services.cFerraresi et al (2021).
In NSW, the consolidation of pathology and forensic services reduced spending on goods and services by 14 per cent between 2016 and 2023.dSusan McKinnon Foundation (2024).
The Queensland government has applied the same principle in broader public procurement. By moving all its departments to one retail electricity contract, it saved about $35 million in 2020-21.eQueensland Audit Office (2022).
Some states have already taken steps in this direction: NSW, Victoria, Queensland, and WA all have centralised procurement agencies.187In NSW, all hospital items worth more than $250,000 must be bought through HealthShare (Box 11). In Victoria, about 20 per cent of hospital supplies go through a similar agency: Victorian Auditor General’s Office (2025). In WA, about 30 per cent of contracts are managed by the government’s Health Support Services agency: Government of Western Australia (2025a) and Peake et al (2022). And Queensland Health’s system procurement branch works with hospitals on procurement: Queensland Health (2025b). But they vary in scope, and there’s room to do more.
States should ramp up central procurement, working with hospitals to identify opportunities for statewide contracts.188Peake et al (2022). Following NSW’s lead, good candidates include uniforms, patient transport, meals, linen, and payroll (Box 11).189HealthShare NSW (2025a). Another is statewide purchasing of private hospital care, for example, to expand elective surgery capacity.190Along the lines of Queensland’s Surgery Connect program, which buys activity in private hospitals: Queensland Health (2025c).
Centralising procurement within states is an easy place to start. But the same principles apply on a broader scale too. Smaller states should seek to join larger neighbours’ procurement agencies (for example, the ACT could purchase goods through HealthShare NSW).191The smaller jurisdiction could pay a small premium to compensate the bigger state for the administrative costs of running the agency. But both would win: larger contracts usually mean even better deals: Jisan et al (2025). And for some specialised technologies, a national approach might be best.192For example, in New Zealand, central bodies procure all medical devices and supplies: NZ Government (2025).
Box 11: HealthShare NSW centralises a wide range of services
HealthShare NSW is one of the more advanced shared service agencies in Australia. In addition to its procurement service, it offers a range of other centralised services including:
– Uniforms: NSW Health introduced a statewide uniform, which makes it easier for staff to work across different hospital networks. HealthShare NSW works with the supplier to ensure uniforms meet quality standards and are delivered on time.
– Food: Every year, HealthShare NSW provides more than 26 million meals to public hospital patients. It has also introduced standardised menus across all hospitals.aABC News (2025), and HealthShare NSW (2025b).
– Employee and financial shared services: HealthShare NSW provides payroll, financial management, and payment processing services for NSW Health. This includes paying more than 180,000 NSW Health Employees and 2.2 million invoices each year.bHealthShare NSW (2025b).
– Patient transport: HealthShare NSW offers a centralised booking and dispatch service for non-emergency patient transport. It also has a ‘Make Ready’ service, which cleans and restocks ambulances, and organises minor repairs.cHealthShare NSW (2025c).
– Linen: HealthShare NSW provides more than 16 million bed sheets to public hospitals.dIbid.
9.2 Cut spending on temporary doctors and nurses
Spending on temporary doctors and nurses is high and increasing. State governments should cap the amount hospitals can spend on temporary doctors and nurses, to help stop bidding wars between hospitals and regions.
Hospitals, particularly in regional and rural areas, rely on temporary workers to cover workforce shortages. Their use, and cost, has only increased since the COVID-19 pandemic.193Between 2021 and 2024, the cost of temporary staff tripled in Tasmania, reaching $183 million: Balen (2024). Between 2019 and 2024, the cost of temporary doctors in NSW more than doubled, to $270 million: NSW Health (2024).
Temporary staff are paid much more than permanent staff: usually about double, for doctors.194Based on implied full-time equivalent visiting doctor pay in NSW Health (2024), compared with salaried doctor pay in AIHW (2025c). Rural Doctors Association Tasmania (2025) also estimates that locum specialists cost twice as much. And they are often recruited through third-party agencies which charge a commission, typically about 15 per cent of the placement fee for doctors.195Griffiths (2024). In 2023-24, HealthShare Victoria spent more than $48 million on locum agency fees: Victorian Auditor General’s Office (2025). NSW hospitals spent $44 million on commission fees: NSW Parliament (2025).
Hospitals independently negotiate rates and commissions, bidding against one another and driving up prices.196Griffiths (2024), Garling (2008), and Prager and Schmitt (2021). State governments should stop the bidding wars by setting a maximum daily rate, as Queensland has (Box 12). When England introduced price controls in 2015, prices dropped sharply.197Triggle et al (2022).
The maximum rate should be higher for more qualified staff, and for regional and rural areas. If patient safety is at risk because hospitals can’t attract staff without exceeding the prescribed maximum price, executives should seek approval from the state’s health department to override the cap. If that happens frequently, the state government should review the cap and loadings.
The more states adopt a cap the more effective it will be, because workers won’t be able to go over the border for a better deal.
As well as capping rates, states should consider creating an in-house locum agency to cut out middleman agency fees. WA provides a model: its NurseWest agency manages temporary nurses and midwives directly or through contracted private agencies.198The agency filled 1.8 million hours in 2023-24: WA Health Support Services (2025). That’s about 5 per cent of the total hours worked by salaried nurses in WA that year: AIHW (2025c).
Setting maximum daily rates and establishing in-house locum agencies would help reduce the cost of temporary staff. But the long-term solution is better workforce planning. Governments should identify the workforce required to meet the population’s health needs, and tie funding for training to meeting those targets.199Breadon et al (2025).
Box 12: Queensland has set a maximum daily rate for temporary doctors
Queensland Health has set a maximum daily rate for temporary doctors working in public hospitals.aQueensland Health (2024).
The maximum daily rate includes a base ratebThe base rate is $1,980 (excluding GST) for senior medical officers and between $990 and $1,485 (excluding GST) for resident medical officers. plus a specialist loading and a regional loading.
The specialist loading reflects the doctor’s level of skill and ranges from 15 per cent to 30 per cent. The highest loading is applied to doctors with a specialist registration in a speciality other than general practice.
The regional loading is based on the hospital’s remoteness.cAccording to the Modified Monash Model (MMM) classification. For example, temporary doctors working in very remote communities can be paid up to 30 per cent above the maximum daily rate.dThe regional loadings are: Metropolitan (MM1) = 0 per cent, Regional centre (MM2) = 1.5 per cent, Large rural towns (MM3) = 2.5 per cent, Medium rural towns (MM4) = 5 per cent, Small rural towns (MM5) = 10 per cent, Remote communities (MM6) = 20 per cent, and Very remote communities (MM7) = 30 per cent.
9.3 Centralise some procedures
State governments and hospital networks should explore opportunities to centralise some procedures into high-volume surgical centres.
Specialisation can improve patient outcomes and reduce cost (Box 13). Doctors who perform a lot of the same procedure tend to have lower patient complication and mortality rates. High-volume hospitals are more likely to follow best-practice guidelines and have better patient flow, reducing cost.
Yet in Australia, some specialised procedures, such as cancer surgeries, are performed at small-volume hospitals (Figure 9.1).200Cameron et al (2024) found some highly specialised services are delivered at a relatively large number of Victorian hospitals. For example, cardiothoracic surgery is performed in twice as many hospitals per person in Victoria as in England. And even some high-volume operations are too diffuse. For example, joint replacements are safer in hospitals that do at least 50 a year,201Gemeinsamer Bundesausschuss (2025), and Blümel et al (2020). but in 2018-19, more than 900 knee replacements, and 675 hip replacements, took place in hospitals that do less than 50 per year.202Grattan Institute analysis of IHACPA (2025g).
Figure 9.1: Some highly specialised procedures are performed in small-volume sites in Australia’s cities
Share of procedures in city’s public hospitals at small-volume hospitals, 2022-23
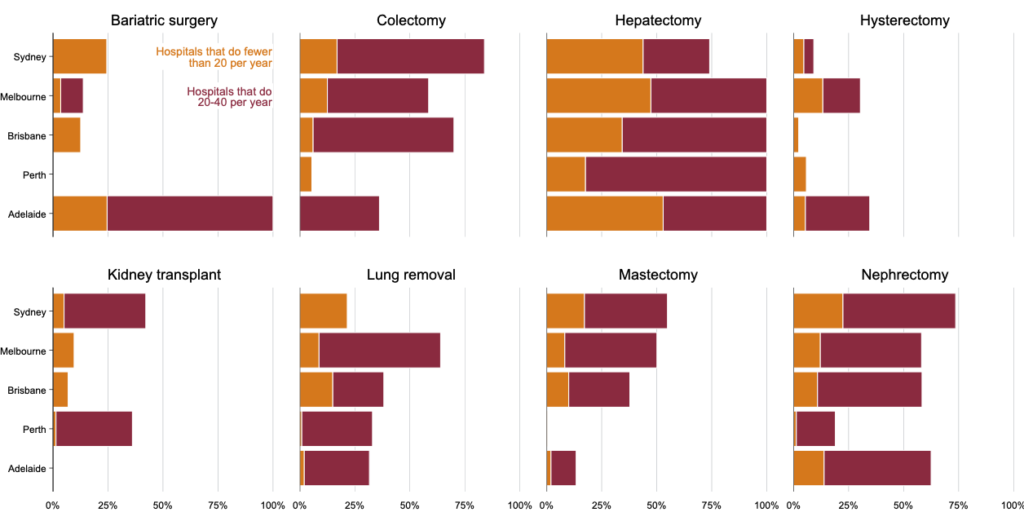
Notes: Procedures are defined in Appendix B. Hospital volume is based on bins of hospital volume for related procedures; no individual hospitals are shown. The remaining share of procedures are at hospitals with more than 40 cases of that procedure. Bariatric surgery in Perth is omitted.
Source: Grattan Institute analysis of IHACPA (2025a).
Centralising care doesn’t mean building whizz-bang new hospitals. State governments should look for opportunities, guided by evidence, to reorganise care into existing, successful sites, starting within cities. And they should make sure patient transport schemes are available, so extra travel isn’t a barrier to accessing safer care.203Scharfe et al (2025), Ramsay et al (2025), and Cameron et al (2024).
Box 13: Procedure practice makes perfect
For many procedures, higher hospital and surgeon volumes are associated with better outcomes. Systematic reviews have found a positive relationship for many types of cancer surgery, cardiac surgery, spinal surgery, gynaecology surgery, bariatric surgery, hernias, and hip, knee, and shoulder replacements.aNSW Health (2020), and Kugler et al (2022).
Reported benefits include lower rates of mortality, post-operative complications, re-admission, and re-operation.bNSW Health (2020). Higher-volume centres also tend to have shorter stays and lower typical costs.cHo et al (2017) and Yoon et al (2019). For most of the common procedures we examined, except hip and knee replacements, admissions were cheaper in a hospital that did more of that procedure (see Appendix B). A NSW study found that Whipple procedures were 22 per cent more costly at low-volume hospitals than high-volume hospitals, after adjusting for patient characteristics.dL. Li et al (2025).
Both hospital and surgeon volumes matter.ePieper et al (2013), Morche et al (2016), and Saulle et al (2019). Surgeons learn by doing.fMaharaj (2025), and Avdic et al (2019). And hospitals and surgeons with greater volumes are more likely to follow best-practice guidelines.gMesman et al (2015).
Studies of efforts to centralise care generally find positive impacts.hRamsay et al (2025), and Langhorne et al (2020). For example, London stroke patients went home sooner after acute stroke care was consolidated.iMorris et al (2014), and Hunter et al (2013). Centralisation of Whipple procedures in WA led to a reduction in complications and mortality.jYau et al (2022).
9.4 Victoria should amalgamate its local hospital networks
Larger hospital networks can give patients better access to care and provide services more efficiently. Victoria should amalgamate its hospital networks to reap these benefits.
Victoria has more hospital networks than the rest of Australia combined.204AIHW (2025c). Many run just one hospital. The proliferation of small operators can make it harder to spread best practice and coordinate with Primary Health Networks, and hinders continuity of care.205Cameron et al (2024).
It also adds to costs. Networks bid against each other for scarce resources, such as staff.206Prager and Schmitt (2021). Back-office functions, such as payroll, finance, and management, are duplicated.207Cameron et al (2024).
Victoria should amalgamate its local hospital networks. That would mean consolidating management of a few hospitals, with a shared board, CEO, and some executive positions. This goes further than the Victorian Government’s policy of permitting voluntary amalgamations and increasing coordination.208In July 2025, the Victorian Government introduced Local Health Service Networks to promote collaborative care, and, in time, share payroll and IT functions: Victorian Department of Health (2025b). But, with the exception of the voluntary merger of three Bayside networks (Alfred Health (2024)), there has been no fundamental change to hospital governance. It would not mean closing hospitals or restricting access to care. In fact, streamlining management usually increases resources for frontline services (Box 14).
Box 14: Health service mergers can cut costs and improve access to care
In 2021, four Victorian hospital networks merged to form Grampians Health. Experts reported the merger led to better clinical safety and access to care. For example, child dental health services were reintroduced after having been missing in some areas for more than three years.aDuckett et al (2024).
In NSW, the 2005 health network merger reduced waiting times for urgent public patients.bJohar and Savage (2014).
Overseas, hospital mergers cut costs. A systematic review of four decades of research found most studies of hospital mergers reported cost reductions.cGiancotti et al (2017). More recently, see Diaz et al (2025). For example, US hospitals that were acquired by a larger system between 2000 and 2010 had 4-to-7 per cent lower costs than expected.dSchmitt (2017). Hospitals that joined a larger network between 2010 and 2018 also had lower costs. The benefits grew over time and lasted at least five years.eDiaz et al (2025). In another study, 60 per cent of the cost savings came from consolidation of back office functions, such as maintenance, administration, pharmacy, and medical records.fAndreyeva et al (2024).
Acknowledgements
This report was written by Peter Breadon and Elizabeth Baldwin. Wendy Hu, Jane Cheatley, Matthew Putt, Sparsh Tiwari, and Allen Xiao provided extensive research assistance and made substantial contributions to the report. It was edited by Paul Austin.
We would like to thank the many current and former government officials and industry experts, including those at Nous Group, who provided input to this report.
The opinions in this report are those of the authors and do not necessarily represent the views of Grattan Institute’s founding members, affiliates, individual board members, reference group members, or reviewers. The authors are responsible for any errors or omissions.
Grattan Institute is an independent think tank focused on Australian public policy. Our work is independent, practical, and rigorous. We aim to improve policy by engaging with decision makers and the broader community.
We acknowledge and celebrate the First Nations people on whose traditional lands we meet and work, and whose cultures are among the oldest in human history.
For further information on Grattan’s programs, or to join our mailing list, please go to: www.grattan.edu.au. You can donate to support future Grattan reports here: www.grattan.edu.au/donate.