Overview
Housing in Australia’s cities is among the least affordable in the world. For decades, we have not built enough housing where people most want to live. A lack of well-located homes is dividing families and communities, and robs younger Australians of economic opportunity
State and territory planning systems say ‘no’ to new housing by default, and ‘yes’ only by exception. About 80 per cent of residential land within 30km of the centre of Sydney, and 87 per cent in Melbourne, is restricted to housing of three storeys or fewer. And three quarters or more of residential land in Brisbane, Perth and Adelaide is zoned for two storeys or fewer. Approval processes for new housing are too costly, slow, and uncertain. And the governance of land-use planning – who decides what gets built and where – favours those who oppose change.
Unsurprisingly, our cities are among the least dense of their size in the world. Restrictive planning controls add hundreds of thousands of dollars to the cost of new housing in our capital cities. And too many Australians can’t afford a home near where they want to live and work, leading to stagnating populations in many affluent inner-city areas and people pushing people further from their jobs, their families and friends.
We can do better. Allowing more housing in established suburbs would mean cheaper homes. It would boost Australians’ incomes and their quality of life by letting people live closer to high-paying jobs as well as transport, schools, and other amenities. And it would lead to shorter daily commutes and hence lower greenhouse gas emissions.
Thankfully, the politics of planning are shifting. State governments in NSW and Victoria are relaxing planning controls to get more homes built. These reforms are unlocking substantially more housing, much of which can be profitably built today despite higher construction costs.
But all state and territory governments need to go further to build the homes their communities desperately need.
First, three-storey townhouses and apartments should be permitted on all residential land in capital cities. This would unlock capacity for more than 1 million homes in Sydney alone that could be profitably built today. More land around transit hubs should be upzoned for higher-density of at least six storeys. And heritage protections that cover much inner-city land should be reviewed to allow more housing.
Second, planning application processes should be simplified to offer home builders certainty and reduce costs. Developments of up to three storeys that meet clear standards should not need a planning permit. Larger developments that meet pre-set criteria should be assessed via ‘deemed-to-comply’ pathways.
Third, the governance of planning systems should be improved, so that restrictive rules that prevent more housing face greater scrutiny.
The federal government should reward states that allow more townhouses and apartments to be built in our cities, by extending National Competition Policy payments to residential land use. And the Productivity Commission should regularly assess the capacity of state planning systems to meet expected housing demand.
These reforms could lift housing construction by an average of up to 67,000 homes a year, which over a decade could cut rents by 12 per cent and shave more than $100,000 off the cost of the median-priced home. Less restrictive planning could boost Australia’s GDP by up to
$25 billion a year in the long term, and assist the transition to net zero.
Building more homes where people most want to live will make housing cheaper and create wealthier, healthier, and more vibrant cities.
This report and accompanying materials have been updated since publication. We have slightly changed Figures 1.4, 1.5, and 1.6 (and their accompanying text) after we identified an inconsistency in the way dwellings data were reported between the 2001 and 2021 Censuses.
Recommendations
Recommendation 1
Relax state and local government planning controls that prevent density
- Adopt a Low-Rise Housing Standard, which permits three-storey townhouses and apartments on all residential-zoned land in capital cities, with no minimum lot sizes.
- Adopt a Mid-Rise Housing Standard, which permits at least
six-storey developments on all residential-zoned land within
walking distance of transit hubs and key commercial centres. - Identify and upzone other high-demand locations for even higher densities, including land in and around the CBDs of capital cities.
- Review systems of heritage and character controls to allow more housing in high-demand areas.
Recommendation 2
Improve consistency and certainty in approval processes
- Modest-density developments (i.e. up to three storeys) should be able to get certified as ‘complying’ instead of needing a planning permit.
- There should be a ‘deemed-to-comply’ pathway for higher-density developments.
Recommendation 3
Fix planning governance
- Subject changes to planning rules to regulatory impact assessments and existing planning controls to periodic review.
- Set and enforce higher housing targets for local councils, where there is substantial unmet demand for housing.
- The federal government should ask the Productivity Commission to regularly assess the performance of state and territory land-use planning systems, including through regular assessments of commercially feasible capacity for new homes.
Recommendation 4
Sharpen federal incentives to the states
- The federal government should pay the New Homes Bonus in installments rather than at the end of the five-year period.
- The federal government should pay the states, via National Competition Policy, to adopt specific reforms to land-use planning controls, including the standards outlined in recommendations 1 and 2.
1 Australia has too few homes where people most want to live
There are few things as important to people’s lives as safe, secure, affordable housing. But housing in Australia has become increasingly expensive in recent decades. Too many people can’t find a home close to where they want to live and work. Fewer now have a home to call their own, especially younger and poorer Australians, who are spending more of their income on rent. And many Australians struggle to find a home at all.
At the heart of the problem is the fact we just haven’t built enough homes to meet rising demand. Demand for housing has risen sharply as Australia’s population has grown and become older and wealthier. Australians are demanding more housing per person as households become smaller alongside the rise of working-from-home.
Yet since the turn of the century, Australia has failed to build enough new homes to keep pace with population growth. In fact, it has had the second-largest decline in the OECD in the past two decades in the amount of housing per adult.
Australia has a particular shortfall of housing in places where people most want to live: in established suburbs of our major cities, close to jobs, transport, schools, and other amenities. Australian cities, and especially Sydney and Melbourne, are some of the least dense of their size in the world. Many Australians would opt for a townhouse or
apartment in an established suburb if more were available. Instead, the populations across many affluent, inner-city suburbs are falling.
The flow-on effect is high prices and rents, causing people to compromise on where they live – further from family and friends. Expensive housing also weighs on economic growth, because fewer people can live close to good jobs.
1.1 Housing is increasingly expensive and homeownership is falling
The price of homes in Australia has grown much faster than incomes over the past few decades. Prices have risen rapidly in all cities, and most regions. Median prices have increased from about four times median incomes in the early 2000s, to more than eight times today (and around 10 times in Sydney – Figure 1.1).
Figure 1.1: Price-to-income ratios have increased nationwide
Ratio of median dwelling price to median household income
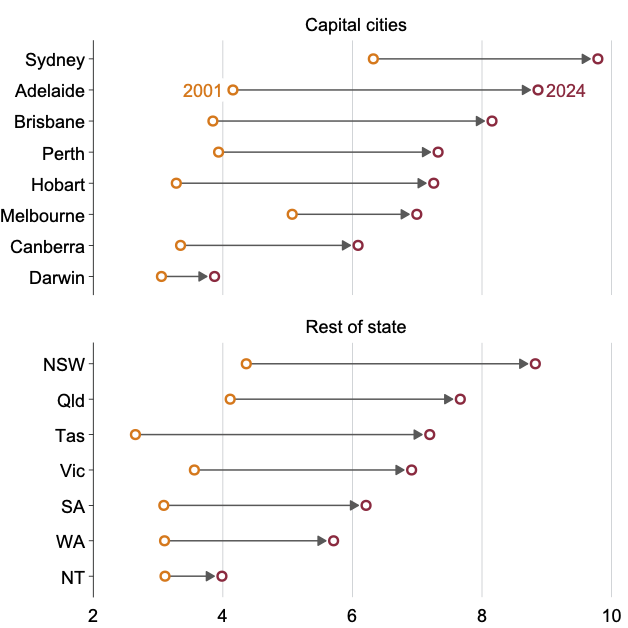
Note: Based on modelled median household income from the ANU Centre for Social Policy Research.
Source: Cotality (2024).
House prices have increased even further since the pandemic, up 55 per cent nationwide since 2020. In Brisbane, Perth, and Adelaide they have risen by more than 90 per cent. Prices have grown more slowly in Sydney and Melbourne, but are still up 45 per cent in Sydney and 21 per cent in Melbourne.1Grattan analysis of PropTrack (2025a). Data to September 2025 counting houses and units.
Homeownership rates are falling fast among low-income earners of all ages. Between 1981 and 2021, homeownership rates among the poorest 40 per cent of 45-54 year-olds fell from 68 per cent to 54 per cent, and among the poorest 40 per cent of 25-34 year-olds it fell from 52 per cent to 31 per cent (Figure 1.2). The overall homeownership rate among 25-34 year-olds fell from more than 62 per cent to 44 per cent.
Figure 1.2: Homeownership is falling particularly fast among low-income earners
Homeownership rates by age and income
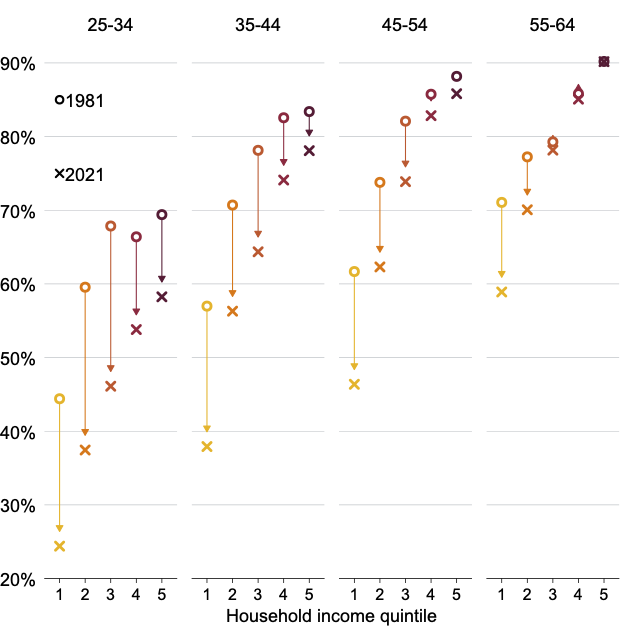
Notes: Private dwellings only. Excludes tenure or income not stated. ‘Other’ tenure is counted as a non-owner. Household incomes are reported in ranges, so sorting into quintiles is an approximate exercise. This means small changes in ownership rates may not be significant. Income not equivalised due to data limitations.
Source: Grattan analysis of ABS (1983) and ABS (2023a).
1.2 High rents are hurting the poor
Of course, not all Australians own their own homes – nearly one in three households rent privately.2The proportion of households renting has steadily increased from about 28 per cent in 1996 to 31 per cent in 2021, excluding dwellings with tenure type not stated: ABS (2021a).
Lower-income households, in particular, are spending more of their income on housing: the poorest 20 per cent of Australians now spend nearly 30 per cent of their income on housing, up from just over 20 per cent in 1995.3ABS (2022a, Table 1).
Rents have accelerated since the pandemic as rental vacancy rates have fallen to record lows. Since 2020, the rents on newly advertised properties have risen by at least 50 per cent in Sydney, Adelaide, Brisbane, and Darwin, and have nearly doubled in Perth. The rents paid by all renters in capital cities – as measured in the Consumer Price Index – have risen 21 per cent since the end of 2019.4Grattan analysis of ABS (2025a) and PropTrack (2025b).
Rents have risen fastest in the states that built the fewest new homes for new residents during and since the pandemic (Figure 1.3).
Figure 1.3: States that built more homes per additional resident had lower rent growth
Growth in asking rents, December 2019 to March 2025
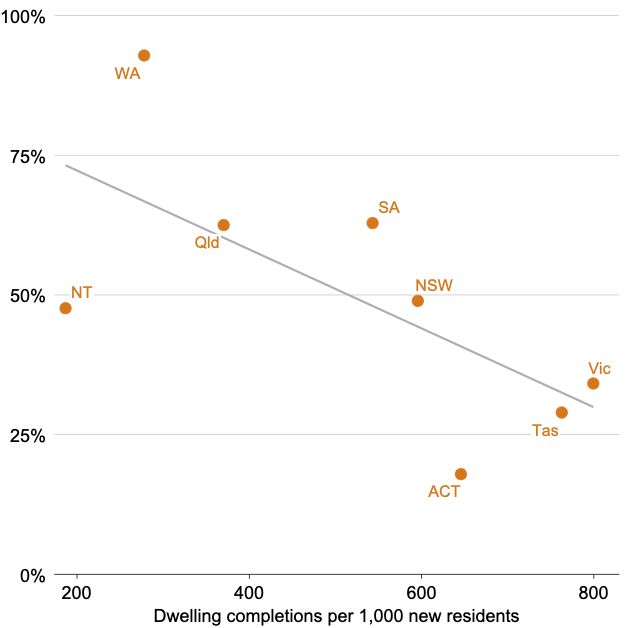
Note: Rents measure is newly advertised properties on realestate.com.au. Source: Grattan analysis of PropTrack (2025b), ABS (2025b), and ABS (2024a).
1.3 Demand for housing is increasing
Demand for housing in Australia has grown strongly in recent decades, with high migration, rising incomes, population ageing, and the increase in working-from-home during and since the pandemic.
1.3.1 Australia’s population is growing strongly, especially due to migration
Australia’s population has grown quickly: from 18.9 million at the turn of the century to 27.6 million by September 2025.5ABS (2025c). And Australia’s cities have grown even faster. Since 2001, the total population of our capital cities has grown by almost 50 per cent – compared to 30 per cent for the rest of Australia.6Grattan analysis of ABS (2025d).
Migration has been the major driver of population growth. Since 2005, annual net overseas migration has averaged 200,000 people per year, up from 100,000 in the decade before.7ABS (2024a). Most of that extra demand for housing has been concentrated in our cities: about 86 per cent of migrants live in capital cities, compared to 66 per cent of all Australians.8Parkinson et al (2023, Figure 45).
Net overseas migration – the net growth in population through immigration to Australia and emigration from Australia – has jumped as migrants arrived in Australia in record numbers after the reopening of the borders following the pandemic, while fewer residents than usual left.9McDonald (2023). Although Australia’s population today is slightly below pre-COVID forecasts.10Australian Government (2020) and ABS (2025c).
1.3.2 Rising incomes, population ageing, and hybrid work have added to housing demand
Beyond Australia’s growing population, demand for housing has also risen as Australia’s population has aged and our incomes have increased. Increases in hybrid and remote work since the pandemic have driven demand further. These factors have contributed to falling average household size, meaning that we need to build even more homes than is required to simply keep pace with population growth.
Increasing life expectancy and declining fertility rates are resulting in an increase in the number of homes needed per person in Australia. This is because as people are less likely to start a family and more likely to live longer, there are more households without children. Unsurprisingly, the share of one-person households increased from about 10 per cent in 1966 to 26 per cent in 2021.11NHSAC (2024, Figure 2.23).
As we get richer, we want bigger homes or to live with fewer people.12Estimates of this relationship suggest housing is ‘income inelastic’ – for each 1 per cent increase in incomes, spending on housing goes up by less than 1 per cent. See Albouy et al (2016) and Finlay and Williams (2025). Although one study of NSW found the relationship to be slightly income elastic: Liu (2018). This means as long as incomes are growing, housing demand will rise faster than population growth. And more recently, the work-from-home revolution has spurred a ‘race for space’, which further increased demand for housing. About 30 per cent of people now work from home more than 5 hours per week, up from about 10 per cent before COVID.13Grattan analysis of Melbourne Institute of Applied Economic and Social Research (2025).
The Reserve Bank estimates that the number of people living in each home in Australia fell from an average of 2.55 in late-2020 to 2.48 by mid-2022, a change which created demand for up to an extra 275,000 homes.14Average household size has since started to rise again, reflecting the rising cost of renting. See Agarwal et al (2023) and Coates (2023).
1.3.3 Demand for housing will continue to rise in coming decades
Australia’s population is expected to continue to grow over coming decades, from 27.8 million in March 2025 to 39.9 million by 2055, largely due to continued strong migration.15ABS (2025c) and ABS (2023b). These projections assume a fixed annual level of net overseas migration, which historically has led to substantial underestimations of actual migration numbers: Sherrell (2021).
The populations of Melbourne and Sydney are expected to rise to 8.5 million and 7.8 million respectively by 2055. Brisbane is projected to grow to a population of 4 million (the size of Melbourne in 2010), Perth to 3 million, and Adelaide to nearly 2 million over the same period.16ABS (2023b).
In practice, housing construction would need to exceed these projections to satisfy extra demand arising from rising incomes and population ageing, let alone to make up for past housing shortfalls. For instance, Australians’ incomes are expected to rise by 50 per cent over the next four decades, increasing housing demand substantially above population growth alone over that period.17Australian Government (2023, p. vii).
1.4 Australia isn’t building enough housing
House prices and rents would not have risen so much if more housing had been built in our major cities where most Australians want to live. But Australia has failed to build enough housing to meet the needs of a growing, ageing, and increasingly wealthy population.
In the second half of the 20th Century, the growth in Australia’s stock of homes consistently outpaced the growth in Australia’s adult population. But the gap in growth rates gradually closed, and since 2001, growth in the housing stock has lagged growth in the adult population (Figure 1.4).
Figure 1.4: Australia’s dwelling stock used to grow much faster than the adult population, but not anymore
Average annual increase
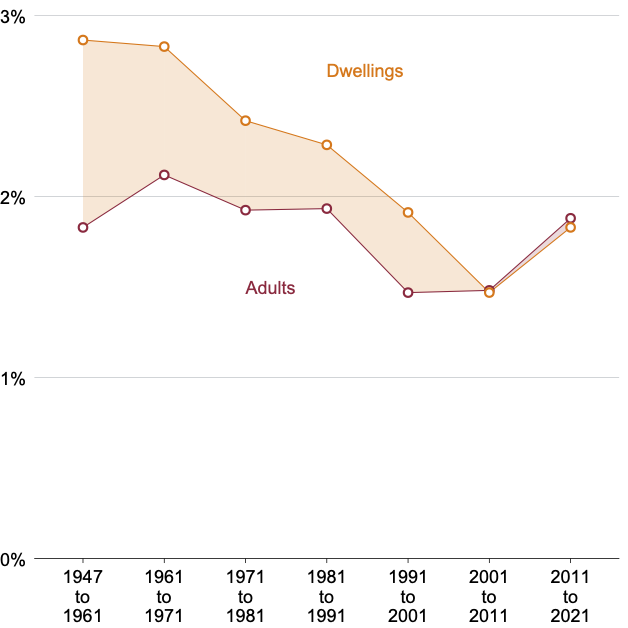
Notes: Dwellings are measured as private, occupied dwellings. Includes visitor-only households. Adult population measured as those people aged 18+. Pre-1971 censuses largely excluded Indigenous Australians.
Source: Grattan analysis of ABS (1948), ABS (1962), ABS (1972), ABS (1982), ABS (1992), ABS (2002), ABS (2012), and ABS (2022b). Data sourced from Community Packs and Time Series Profiles for 1996 to 2021 and general summary products beforehand.
In contrast to Australia, most countries’ housing stock has grown faster than their adult populations in recent decades. Australia is among only a handful of OECD countries where the amount of housing per adult has declined over the past two decades (Figure 1.5).18Mares (2025) notes that Australia’s population is younger than most OECD countries. This means households are more likely to have children and our housing-to-population ratio will naturally be lower. But this is largely addressed by constricting the denominator to adults, as we have done. Mares (ibid) also notes that Australia ranks favorably on the dwellings added as a share of the existing stock. But this is only one side of the equation – what matters is how much supply has increased relative to demand.
Figure 1.5: Australia’s housing per adult has gone backwards
Change in dwellings per 1,000 adults, 2000 to 2020 or closest available
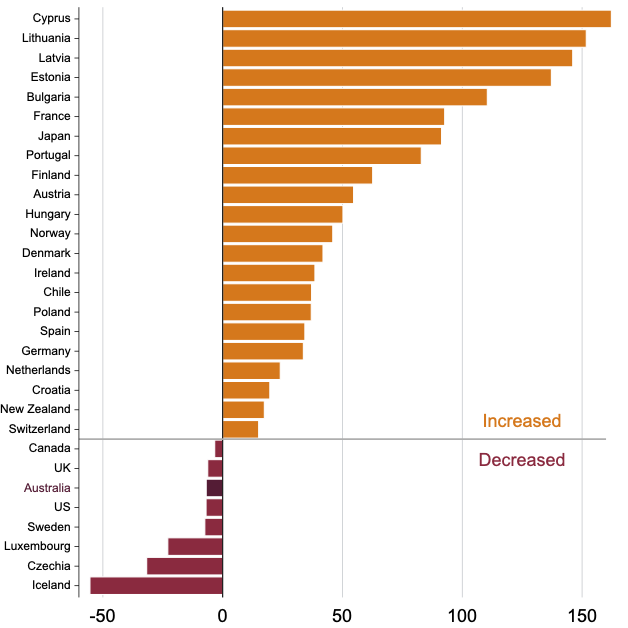
Notes: Australian figures are for total occupied, private dwellings. Excludes visitor-only households. Start and end years vary by country based on OECD data availability.
Periods shown are: Australia (2001–2021); Austria, Denmark, Estonia, Finland, France, Ireland, Lithuania, Luxembourg, Netherlands, Norway, Poland, Portugal, Romania, Sweden, UK, US (2000–2020); Canada, Croatia, Germany, Japan, Spain, Switzerland (2001–2018); Bulgaria, Czech Republic, Hungary, New Zealand (2001–2018); Chile, Latvia (2002–2018); Malta (2005–2018).
Source: Grattan analysis of ABS (2022b), OECD (2024), and UN (2025).
In a recent study of the elasticity (i.e. responsiveness) of the flow of new housing in response to higher prices among 21 countries by the Bank of International Settlements, Australia ranked fifth-last.19Banerjee et al (2024, Graph 2B).
Countries – including Australia – that have added fewer homes relative to population growth have had faster growth in house prices (Figure 1.6).
Figure 1.6: Countries that added more housing per adult had slower price growth
Average annual growth in house prices over the past ~20 years
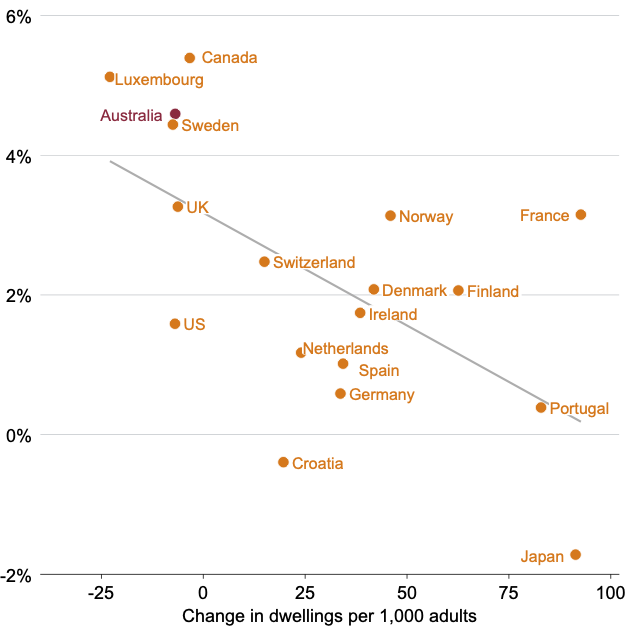
Notes: Dwellings data subject to same notes in Figure 1.5, for countries where price data are available. Price growth period matches the dwellings data period.
Source: Grattan analysis of ABS (2022b), Federal Reserve Bank of Dallas (2025), OECD (2024), and UN (2025).
1.4.1 We especially aren’t building enough homes where people most want to live
Australia has failed to build enough housing in the inner and middle-ring suburbs of our major cities. Most of our major cities have added fewer new homes in suburbs that are 5-to-20km from the CBD (Figure 1.7).20Similarly, fewer than 20 per cent of new dwellings in Sydney between 2016 and 2021 were within 10km of the CBD: NSW Productivity Commission (2023a, p. 27).
Figure 1.7: Most of our major cities have allowed fewer new homes in inner and middle-suburbs
Change in the number of homes, 2006 to 2021
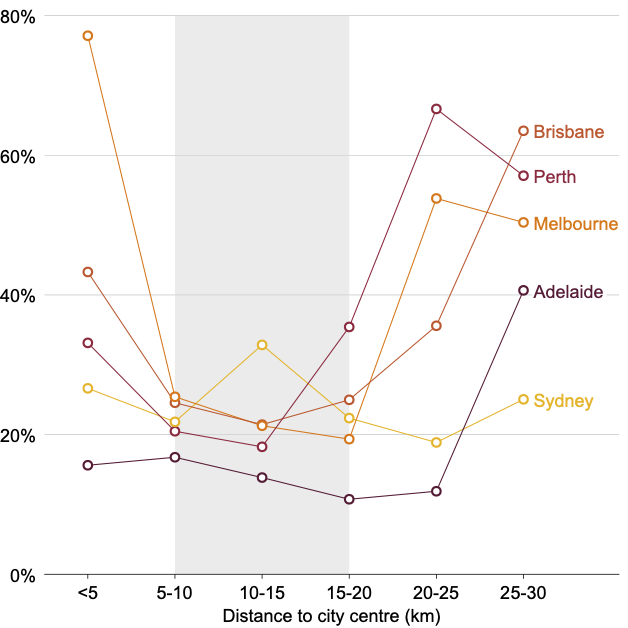
Notes: Uses dwelling counts by Census Collection Districts (2006) and SA1s (2021), which are then mapped to each CBD. Records dwellings occupied on Census night.
Source: Grattan analysis of ABS (2007) and ABS (2022b) (sourced via TableBuilder Pro) and ABS (2021b).
Australia’s major cities are among the least-dense in the developed world
Australia’s major cities are less dense than comparable cities overseas (Figure 1.8). For instance, only 2.5 square kilometres of Melbourne has the same population density as the most dense 100 square kilometres of Paris.21YIMBY Melbourne (2023, p. 4).
Figure 1.8: Australian cities are less dense than comparable cities overseas
Cities of at least 1 million people in developed countries
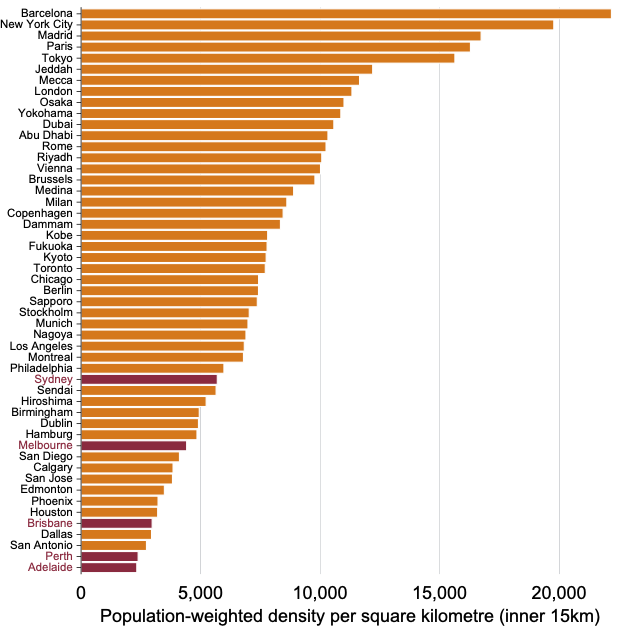
Notes: Population-weighted means each square kilometre is weighted according to how many people live there (this neutralises the impact of mountains, bodies of water, etc). It’s the best measure of how dense a city ‘feels’ for someone there. Data filtered for countries with at least 50 per cent of Australia’s GDP per capita. Outliers Hong Kong (density of 52,915) and Singapore (30,116) removed.
Source: Grattan analysis of Nolan (2024a) and World Bank (2025).
Even modest uplifts in density can mean substantial increases in the number of well-located homes. For example, if the inner 15km of Melbourne were as dense as Los Angeles – not renowned as a particularly dense city – it would have 431,000 extra well-located homes. Or if the inner 15km of Sydney were as dense as Toronto – a city that often matches Australian cities on quality-of-life measures – it would have 250,000 extra well-located homes.22Grattan analysis of Nolan (2024a) and Agarwal et al (2023, Graph 6). Takes the difference in cumulative density per sq km (excluding large bodies of water) for the first 15km and multiplies it by the non-water land sq km of Australian cities, then divides through by average household size. In reality, increased density would correlate with falling average household size, which would further increase our estimates. See also NSW Productivity Commission (2023a, Figure 8) for the relationship between density and quality of life.
Many Australians would choose an apartment or townhouse if more were available
Australia’s housing stock already includes a material amount of apartments and townhouses. Across capital cities today, 21 per cent of homes are apartments and another 14 per cent are townhouses.23Grattan analysis of ABS (2022b). So more than one-in-three households in our major cities are already living in housing denser than detached dwellings.
But this still falls short of what many Australians want. Many people would prefer a townhouse, semi-detached dwelling, or apartment in an inner or middle suburb, rather than a house on the city fringe, if more of those housing options were available in our biggest cities.
Semi-detached dwellings, townhouses, and apartments made up 44 per cent of Sydney’s and 32 per cent of Melbourne’s dwelling stock in 2021, up from about 39 per cent and 27 per cent in 2011.24ABS (ibid). This is still well short of the 59 per cent and 52 per cent that residents say they want.25Daley et al (2018, Table 3.2).
These preferences were reflected again in work by Infrastructure Victoria which found that up to one-in-three Victorian households would trade house and land size to live in an established suburb in a medium-density home, if it was available at a more comparable price.26Infrastructure Victoria (2023a).
But the clearest evidence of unmet demand for denser forms of housing in well-located areas is the prices that Australians are willing to pay to live in them. For instance, newly built units within 5km of the centre of Sydney trade at double the rate (nearly $15,000 per square metre) of those 25km out ($7,000 per square metre).27Grattan analysis of Cotality (2025). Filtered to units built in the past five years.
1.5 The lack of new housing is pushing younger Australians out of our cities
Australia’s cities are our economic engines. The density of cities, clustering workers and firms together, generates increasing economies of scale known as ‘agglomeration effects’. And a larger labour market is a more efficient one. It attracts talented workers and facilitates better – and more productive – matching between them and employers.
Workers in Sydney earn almost 25 per cent more on average than in Adelaide, for example.28NSW Productivity Commission (2024, p. 24). City workers typically earn about $8,000 a year more. A young person who moves from a regional area to a capital city can be up to $15,000 a year better off than those in the same industry who remain in the regions.29Brennan et al (2024, pp. 5–10).
Larger and more dense cities have higher productivity. International surveys suggest that a 10 per cent increase in employment density leads to wages increasing by up to 0.4 per cent.30Ahlfeldt and Pietrostefani (2019). One Australian study found that wages increase by 1.6-to-2.7 per cent if local density doubles.31Meekes (2021). Another found that every doubling of employment density raises wages by 1-to-4 per cent.32Nygaard et al (2021).
But over the past 20 years people younger than 30 have been pushed further from our city centres. From 2001 to 2024 – a period when the population of Sydney grew by 1.5 million – 16 inner-Sydney areas had a decline in their under-30 population.33Analysis at the SA2-level. The 16 in NSW: Eastlakes, Marrickville – South, Rose Bay – Vaucluse – Watsons Bay, Earlwood, Neutral Bay – Kirribilli, Mosman – South, Randwick – North, Maroubra – South, Crows Nest – Waverton, Hunters Hill – Woolwich, Bellevue Hill, Greenwich – Riverview, Mosman – North, Balmain, Croydon Park – Enfield, Haberfield – Summer Hill. There were 3 in Victoria: Carlton North – Princes Hill, Toorak, Ivanhoe East – Eaglemont. ‘Inner’ measured as within 10km of the CBD. Grattan analysis of ABS (2025d) and ABS (2021b). Over the same period, four inner-Sydney areas had a decline in their overall populations: Eastlakes, Marrickville – South, Hunters Hill – Woolwich, Rose Bay – Vaucluse – Watsons Bay.
Rising housing costs are pushing many residents, and especially younger, poorer people, to move further from the centre of our biggest cities, especially Sydney.34NSW Productivity Commission (2024, Figure 3). Between 2016 and 2021, Sydney lost twice as many people aged 30 to 40 as it gained – 35,000 came to Sydney, but 70,000 left.35Scully and Jackson (2024). Domestic out-migration of Sydney has picked up, with people in the 30s the most likely to leave seeking lower housing costs.36Dwyer (2023).
There have always been poorer and wealthier areas within Australia’s cities, but scarce and expensive housing locking young people out mean this geographic inequality is growing. Our cities are no longer the ladders of opportunity they once were.37Moving from disadvantaged to advantaged areas appears to have particularly important impacts on children in the long-run. See Chetty et al (2016), Deutscher (2020), and Kawano et al (2024). Meanwhile, people living in outer suburbs are commuting for longer and have access to fewer jobs. Long commutes make it harder for both parents to work, with women generally the ones who end up working less.38The gender gap in workforce participation in outer suburban areas is typically 3 percentage points larger than in inner areas: Grattan analysis of ABS (2025e).
1.6 Australian governments have set ambitious housing targets, but are currently falling short
The federal and state governments have committed to building 1.2 million well-located homes over five years to 2029-30.39Albanese (2023). But the current pace of housing construction is falling well short of these targets. There were only 188,000 new housing approvals in the year to August 2025.40Grattan analysis of ABS (2025f). The National Housing Supply and Affordability Council expects net new housing supply to total just 938,000 homes over the five years to 2028-29, in the absence of meaningful policy change.41NHSAC (2025, Table 5.1).
The sharp jump in interest rates over 2022-2342For instance, Reserve Bank of Australia research suggests that every 100 basis-point increase in real mortgage interest rates reduces new building approvals by nearly 7 per cent within 12-to-24 months: Tulip and Saunders (2019, Figure 4). and the cost of construction materials43The cost of timber and cement products used in construction has risen by about 40 per cent, and steel products by about 20 per cent, since December 2019. Grattan analysis of ABS (2025g). and labour, have slowed the pace of new construction since the COVID pandemic. In total, the cost of constructing new housing in Australia has risen by 36 per cent since March 2020.44Grattan analysis of ABS (ibid, Table 18). Industry estimates point to an even larger rise in the cost of constructing higher-density dwellings in particular.45CIE (2024), and Charter Keck Kramer (2024).
1.7 This report is about reforming land-use planning to get more housing built in our major cities
This report focuses on how to reform state and local government land-use planning controls to get more housing built, making it cheaper and creating wealthier, healthier cities. Regional areas are not a major focus on the report, although many of the lessons drawn are equally applicable to larger regional centres.46For example, planning controls are much more restrictive in regional centres in Victoria than in Melbourne, and population density in these centres is much lower. See YIMBY Melbourne (2025a) and Ellis (2014).
Chapter 2 shows how overly-restrictive land-use planning controls prevent more housing being built in our capital cities.
Chapter 3 shows how state land-use planning controls should be reformed to permit more homes where people most want to live.
Chapter 4 shows the benefits of relaxing planning controls to build more homes where people most want to live.
Chapter 5 argues that recent reforms to planning controls in NSW and Victoria are a step in the right direction but don’t go far enough.
Chapter 6 identifies how the federal government can encourage states to reform planning controls to help get more housing built.
1.8 What this report is not about
This report identifies restrictive land-use planning regimes as a key driver of the shortage of housing in Australia, and of rising housing costs. The report is not about other policy changes that would also make housing more affordable in Australia.
This report is not about how to arrest the decline in productivity of the housing construction sector,47Productivity in the housing construction sector has fallen by 12 per cent since 1994, whereas productivity across the economy as a whole has increased by 49 per cent: Productivity Commission (2025a). or the shortage of skilled workers needed to build more homes. Past Grattan work has identified opportunities to boost the supply of construction workers through the migration program.48Coates (2025) and Coates and Wiltshire (2024a).
This report is not about boosting greenfield land supply. Grattan has previously recommended removing barriers to more homes on the urban fringe of our major cities, provided that the costs of supporting infrastructure are priced appropriately.49Daley et al (2018).
The report is not about the taxation of housing. Grattan has previously estimated that shifting from stamp duties to a broad-based property tax would improve housing affordability.50Sathanapally et al (2025, p. 56). We’ve also recommended that states tax the uplift in land values from rezonings.51Coates (2022a). The ACT Government has charged 75 per cent for land value uplift for three decades.
This report is also not about the provision of income support or subsidised housing to vulnerable Australians. Grattan Institute has previously recommended increasing the maximum rate of Rent Assistance by 50 per cent for singles and sharers, and 40 per cent for couples, at a cost of $2 billion a year.52Coates et al (2025). And we have called on the federal government to increase funding for social housing, provided that the money is tightly targeted to help people at serious risk of homelessness.53Sathanapally et al (2025, p. 56).
And this report is not about migration policy. Past Grattan work shows that slowing the pace of migration would reduce house prices and rents somewhat.54Coates and Wiltshire (2024b). But it would also leave Australians poorer.55Every permanent skilled visa-holder offers a fiscal dividend to Australian governments of $249,000 over their lifetimes in Australia: Coates and Wiltshire (ibid).
2 Restrictive planning systems prevent more homes being built
Australia’s housing woes are largely caused by a failure of housing policy. Too often, our planning systems prohibit more homes where people want to live and work, making housing scarce and unaffordable.
Land-use planning systems are needed to manage the impacts of land use and development on others, and to coordinate the public realm via the provision of infrastructure and green space. But existing controls extend well beyond these core purposes. There are three problems.
First, planning systems say ‘no’ in general and ‘yes’ only by exception. On about 80 per cent of residential land within 30km of the centre of Sydney, and 87 per cent in Melbourne, only housing of three storeys or fewer is allowed. Three quarters or more of residential land in Brisbane, Perth and Adelaide is zoned for two storeys or fewer. Other prescriptive rules – such as minimum lot sizes, setbacks, and street frontages,
and other protections such as heritage – further limit what can be developed.
Second, approval processes for new housing, where it is allowed, are slow, costly, and uncertain. Wait times for planning decisions can be long: nearly a year on average for developments of 20 or more homes in NSW and Victoria. And planning decisions are often made with reference to subjective criteria, such as ‘neighbourhood character’, which adds further uncertainty, and cost.
Third, the governance of land-use planning – who decides what gets built and where – is biased towards local residents who oppose change. Much authority to set planning controls and assess
applications rests with local councils. Whereas the people who might move to the area – were new housing to be built – don’t get a say.
2.1 Planning systems aim to fulfill a wide range of objectives
State and territory planning systems currently aim to achieve a wide range of objectives under the banner of promoting the economic, environmental, and social welfare of the community. A core aim is to mediate the impacts different land uses and development intensities can have on neighbours and the environment, including pollution, noise, and overshadowing.56Use refers to particular purposes, such as a dwelling, shop, or factory. Development refers to a change in the intensity of a particular use: DTP (2024a, Section 1.5).
Contemporary planning also increasingly incorporates urban design objectives concerned with livability and ‘human scale’ — ensuring streets and neighbourhoods support walking, cycling, safety, and social connection.57Gehl (2010) argues that well-designed public realms are essential to civic life.
Other stated goals include managing population growth, limiting urban sprawl, and protecting biodiversity and heritage. Capturing part of the land-value uplifts associated with new development rights or public infrastructure investments have also been ascribed as goals.58For example, see Productivity Commission (2017) and Spiller et al (2017).
This chapter focuses on state and territory planning regimes as they apply to residential housing in Australian capital cities.59Throughout this report ‘residential land’ means established land where housing is permitted in some form. This includes mixed-use areas but excludes land zoned for greenfields expansion, unless stated otherwise.
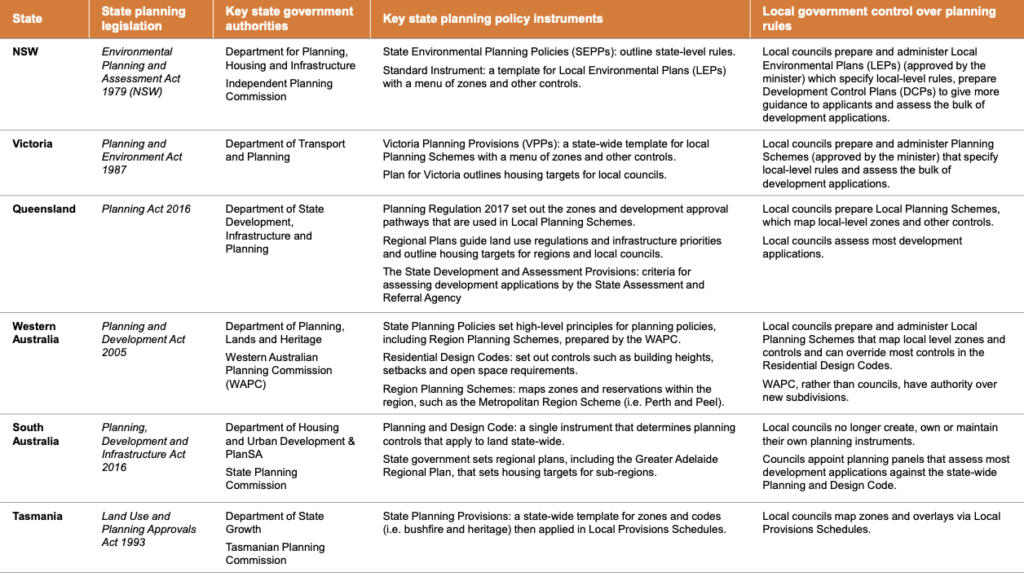
2.1.1 State governments set the framework and the tools, which councils use to set and apply the rules
State governments are responsible for land-use planning systems. They set the overall framework via legislation that empowers local councils to set rules about what can be built where (Figure 2.1). These include zones that can be used to separate different land uses and regulate their intensity, as well as other controls that further restrict development. Councils also process the vast majority of development applications.
Figure 2.1: Most state planning regimes delegate substantial powers to local councils to set planning controls and assess development applications
Notes: The ACT has no local councils, and local councils in the Northern Territory have no planning powers. This list is not exhaustive – it doesn’t capture all state government planning policies, rules, schemes, instruments, and other regulations.
Source: Grattan analysis of state government planning system legislation and governance documents.
2.2 Planning controls forbid more homes on much valuable inner-city land
What ultimately matters for how much housing is built is what ‘built-form’ controls apply to a parcel of land. State and local governments regulate this with a long list of specific controls. These can include:60The controls vary across states. For example, maximum floor-space ratios are common in NSW but not Victoria, and are now being phased out in the ACT.
- Maximum building heights.
- Minimum lot sizes.
- Maximum site coverage ratios.
- Minimum setbacks.
- Minimum lot width.
- Maximum floor-space ratios.
- Restrictions on the types of dwellings permitted (such as dual-occupancies or apartments).
These controls tend to be laid down via the definition of zones in the first instance. But often they sit within or are further tightened by local additions.61For example, in NSW, controls sit directly in local plans. And in Victoria, the baseline controls of each zone can be tightened by a local ‘schedule’ to the zone, or an ‘overlay’ on top. See DTP (2024a, Chapter 1).
This means that calibrating a permissible development on a site is like jumping through slices of Swiss cheese, each with a different set of different sized holes. The result is to make development theoretically allowed but often practically infeasible.
For example, while parts of Ku-ring-gai Council in Sydney permit multi-dwelling housing, they set a maximum site coverage of 40 per cent and a minimum setback from the front boundary of 10 metres.62Ku-ring-gai Council (2022, Sections 6A.3 and 6A.5). This means that for a 10m by 40m parcel of land, the 100 square metres closest to the street is off limits, and only 160 square metres of the remainder is available to build on. After taking into account other controls such as minimum side and rear setbacks, and minimum private open space rules, it quickly becomes difficult to build ‘multi-dwelling’ housing on a site that notionally allows it.
In Victoria, a similar compounding effect can come through the use of zone schedules or overlays. For example, Bayside Council in south-east Melbourne deploys a design and development overlay to control building heights along coastal areas. Regardless of the underlying zone, the overlay dictates that heights in these areas cannot exceed two storeys.63DTP (2025a) and Bayside City Council (2025).
2.2.1 Restrictive zones dominate well-located areas in our major cities
2.2.1 Restrictive zones dominate well-located areas in our major cities
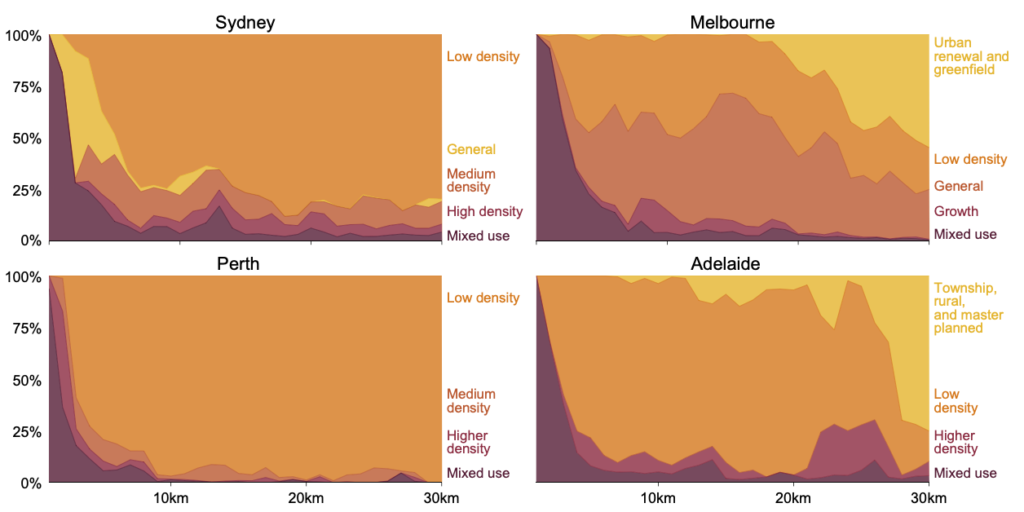
Local inner-city councils in Australia tend to impose restrictive, lower-density zones that limit the opportunities for new development (Figure 2.2). This is consistent with international research showing that more localised decision-making tends to mean more restrictive rules.64Favilukis and Song (2025), Mast (2024), Hankinson and Magazinnik (2023), and Tricaud (2025).
Figure 2.2: Restrictive zones dominate our major cities
Share of residential land by zone type and distance to CBD
Note: See Appendix A for details on how zones are mapped.
Source: Grattan analysis DPHI (2025a), DTP (2025a), PlanSA (2025a), PlanSA (2022), DPLH (2025a), DPLH (2025b), DPLH (2025c), and DPLH (2025d).
About 80 per cent of residential land within 30km of the centre of Sydney is restricted to housing of three storeys or fewer. And much land zoned for higher-density housing is subject to maximum floor-space ratios that further limit development (Box 1). In Melbourne, 87 per cent of residential land is restricted to housing of three storeys or fewer.65Sydney estimate uses reported height limits (less than 10m taken as three storeys or less). Melbourne estimate uses the total of NRZ, GRZ, and LDRZ. Grattan analysis of DPHI (2025a) and DTP (2025a). Melbourne has much more zoned capacity within this envelope than Sydney. Prior to recent reforms, NRZ and GRZ land had net zoned capacity (i.e. the total number of extra homes permissible given prevailing controls) for several million extra homes, compared to just 700,000 extra homes across R1- and R2-zoned land in Sydney. See Appendix B for data and method.
Box 1: A thicket of land-use controls undermines the intent of residential zones in NSW
Planning systems often deploy a bewildering array of tools that limit new housing construction. This ‘thicket’ of rules mean that residential zones in some states bear little relation to the actual housing permitted on land subject to those zones.
In NSW, for example, the state-level template that councils use to devise local plans – the ‘Standard Instrument’ – defines zones without properly specifying what built-form controls, such as building heights, the state government expects will be allowed in the zone.aNSW Government (2006, Direction 7). Rather, council plans separately specify the controls that apply – such as housing types, heights, site coverage, floor-space ratios, and setbacks.
The result is that zones in NSW often do not do what they say on the tin. For example, only about a third of Sydney councils allow flats in R3, the ‘Medium density’ zone, and 11 councils set minimum lot sizes for townhouse projects in the R3 zone.bGrattan analysis of various Local Environmental Plans.
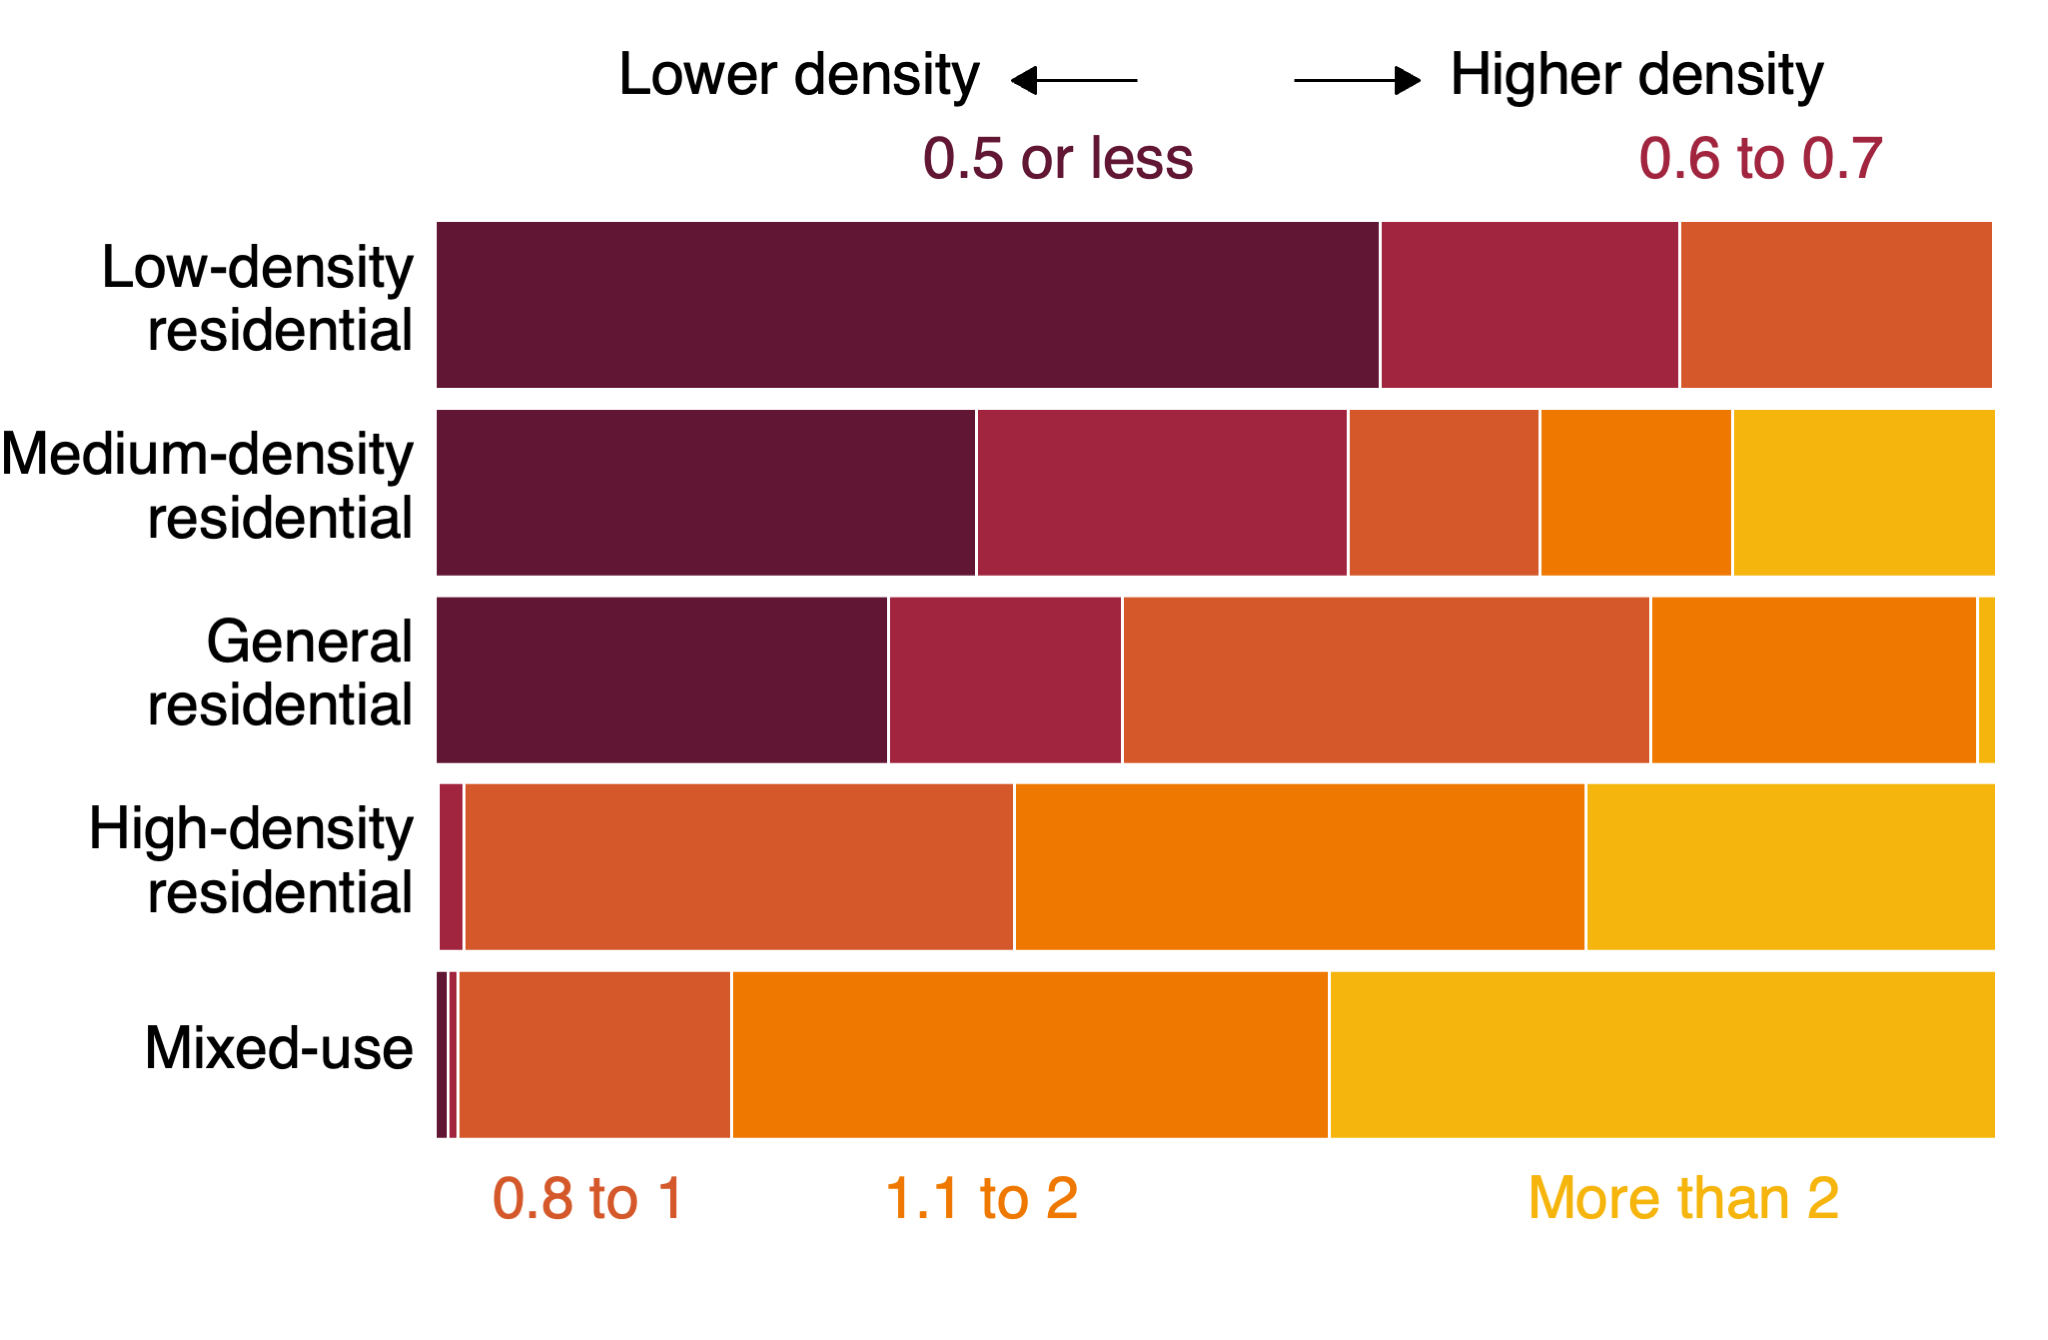
Similarly, maximum floor-space ratios are widely used in NSW in ways that undercut residential zones notionally intended to permit higher-density. For example, zone R4 (‘High-density residential’) has stated objectives to ‘provide for the housing needs of the community within a high-density residential environment’.cNSW Government (2006, p. 23). But nearly three-quarters of land zoned as such in Sydney is subject to a maximum floor-space ratio of less than 2, even after recent reforms to the system (Figure 2.3).dA maximum floor-space ratio of 1, for example, means that the gross floor area of the dwelling (or set of dwellings) cannot exceed the area of the site itself.
Figure 2.3: Even ‘permissive’ zones in NSW are subject to restrictive floor-space ratios
Share of residential lots within Sydney GCCSA by floor-space ratio and zone
Notes: GCCSA = Greater Capital City Statistical Area. Limited to properties within the Sydney GCCSA where zoning generally permits housing. ‘Mixed-use’ combines metropolitan centre and mixed-use commercial zones. Includes mapped controls
in Local Environment Plans, along with controls that apply in Transport Oriented Development and Low- and Mid-Rise Housing Areas. Floor-space ratio controls do not apply to about a quarter of Sydney properties, mostly in low-density zoned areas. Does not include the boost to the permitted floor-space ratio that may be available under the Infill Affordable Housing Bonus or similar policies.
Source: Grattan analysis of DPHI (2025a).
In Queensland, just 10 per cent of Brisbane and 23 per cent of the Gold Coast is zoned medium density or higher,66Queensland Productivity Commission (2025, pp. 161–162). and other estimates suggest 73 per cent of residential land in Brisbane is zoned for low-density (generally two storeys or fewer).67Gallagher et al (2023). Since 2020, provisions that supported multiple dwellings in the low-density residential zone have been removed, a change known as the ‘Townhouse Ban’.68Queensland YIMBY (2022).
And ‘character zoning’, unique to Brisbane, requires the retention of pre-1947 homes, and requires that additional buildings reflect the existing character of the area.69Queensland Productivity Commission (2025, p. 139). Character restrictions apply to nearly 13 per cent of all of Brisbane’s residential-zoned land, and most residential lots in the highly desirable neighbourhoods within 5km of the CBD.70Greater Brisbane (2025). Brisbane also uses a ‘traditional building character overlay’ which is less restrictive but more expansive: Brisbane City Council (2014, Section 8.2.21 and 8.2.22). These character restrictions significantly restrict the construction of townhouses and apartments in Brisbane, even in areas officially designated for increased density.71Gallagher et al (2023).
In Adelaide, restrictive low-density zones, that typically permit only two-storey development, cover 84 per cent of the residential land within 30km of the CBD.72Many of these areas are also subject to the Historic Area and Character Area overlays: PlanSA (2019). While South Australia now applies a single state-wide Planning and Design Code, built-form controls can still vary within zones across locations, often reflecting local controls previously set by councils.
In Perth, low-density controls cover the vast majority of well-located residential land, with only two storeys or fewer generally allowed on 92 per cent of the residential land within 30km of the CBD.73See Appendix A.
And in Canberra, more than two-thirds of the city’s urban land has been locked up in the restrictive ‘RZ1’ zone, which generally allows only one home per block.74Although recent reforms in the ACT will now allow multi-unit housing and subdivisions in RZ1-zoned areas. See Bowes and Coates (2025).
2.2.2 Heritage protections further limit extra housing in well-located areas
Heritage protections further limit how much housing can be built in our inner cities.
While prominent heritage buildings are specifically listed on federal and state heritage registers,75States oversee registers of individually significant heritage sites, but these protections are extended case-by-case, and therefore much more discerningly. the bulk of heritage protections are applied over broad areas by local councils, such as via ‘heritage conservation areas’ in NSW, or ‘heritage overlays’ in Victoria.
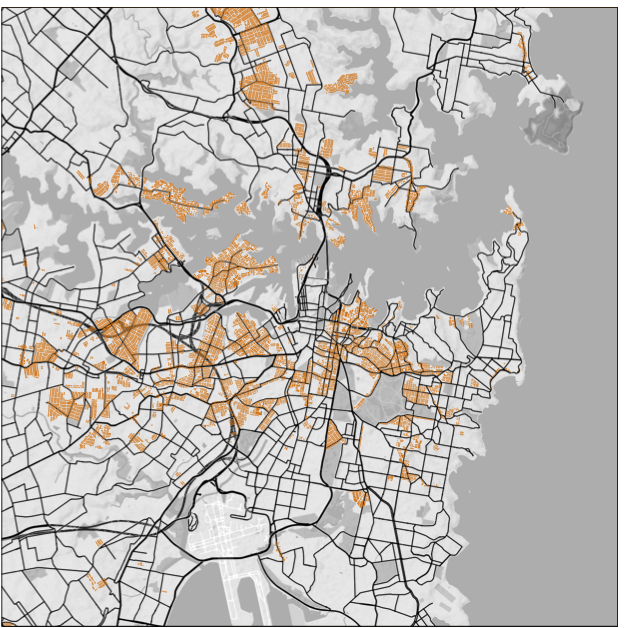
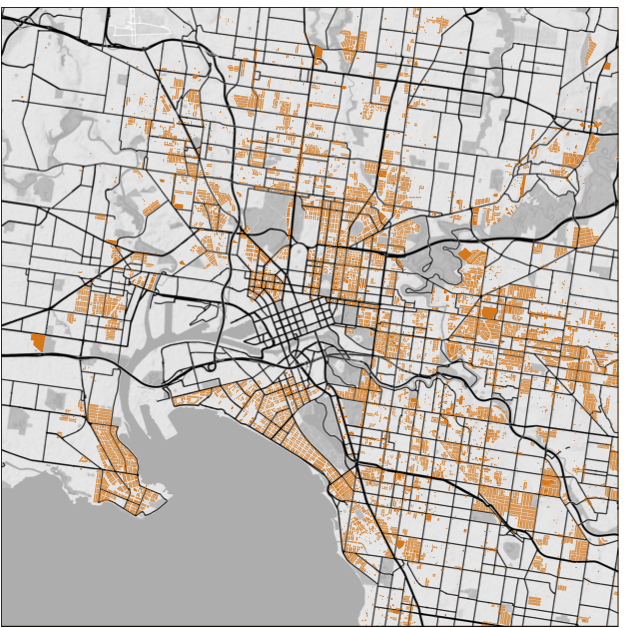
Inner-city councils in Sydney and Melbourne have used these protections liberally. In Sydney, 21 per cent of residential land within 10km of the CBD is a heritage conservation area (Figure 2.4). In Melbourne, 29 per cent of residential land within 10km of the CBD is covered by a heritage overlay (Figure 2.5).
Figure 2.4: Much of Sydney’s well-located land is in heritage conservation areas
Heritage conservation areas on residential-zoned land in inner Sydney
Notes: Highlighted areas exclude CBD land in the Metropolitan Centre zone, and land where zoning generally does not permit housing. Only includes general HCAs.
Sources: Grattan analysis of DPHI (2025a). Map data from Stadia Maps Inc (2025), OpenStreetMap (2025), and Stamen Design (2025).
Figure 2.5: Much of Melbourne’s well-located land is covered by restrictive heritage overlays
Heritage overlays on residential-zoned land in inner Melbourne
Notes: Highlighted areas exclude CBD land in the Capital City and Docklands zones, and land where zoning generally does not permit housing.
Sources: Grattan analysis of DTP (2025a). Map data from Stadia Maps Inc (2025), OpenStreetMap (2025), and Stamen Design (2025).
In Queensland, councils apply heritage overlays as part of Local Planning Schemes, including many sites in inner-city Brisbane.76The Queensland Government is responsible for assessing changes to and development of state heritage places that are identified on the Queensland Heritage Register: Brisbane City Council (2025a). Councils in Western Australia and Tasmania can similarly list specific properties or broad areas for heritage protection. In South Australia, state and local heritage and character area overlays are set within the state-wide Planning Design Code.77See: DPLH (2025e), Tasmanian Department of Justice (2017), and PlanSA (2025b).
Protecting sites that enrich our shared understanding of history is important. But broad-based controls are not well-suited to this objective. They can create exclusive neighbourhoods, meaning any understanding of our heritage and history is not truly shared.
But more importantly, these controls are imposed liberally, with little acknowledgment of the consequences of stymieing the supply of housing in areas where people most want to live.78DTP (2024b, p. 22), Planning Panels Victoria (2024), and Tulip (2025). Research from the UK also found large economic costs from similar protections: Dericks and Koster (2021).
While the level of change permitted on heritage sites can vary greatly, heritage protection often prevents demolition for the purpose of infill development, bars new additions that are visible from the street, and reduces height limits in mixed use areas.79For examples, see City of Melbourne (2023, p. 12), City of Port Phillip (2022, p. 27), and DTP (2025b).
Ultimately this all shows up as fewer homes. In Melbourne, sites with heritage overlays were about 50 per cent less likely to have had significant infill development than those without over the period 2017 to 2022, and mixed-use developments in a heritage overlay area had on average 28 per cent fewer storeys than those elsewhere.80Grattan analysis of DTP (2025a) and Nolan (2024b). Significant infill development defined as projects of 10 dwellings or more. Data are not available for smaller projects, where heritage protection may represent a more binding constraint. Analysis controls for location, lot size, and zone type. Location controls included SA4 area or LGA, and distance from CBD. Studies in the UK found conservation areas had higher house prices and construction costs.81Waights (2018).
2.3 Planning approval processes are complicated, long, and uncertain
Planning application processes for new developments are often slow, onerous, and uncertain. The costs and uncertainty arising from delays and high degrees of discretion for local councils ultimately restricts housing supply and reduces affordability.
2.3.1 Most developments require planning approval
Most new housing requires a planning approval, typically from a local council, an independent planning panel, or a state government. The process generally involves:
- A development application being lodged with the relevant authority: which must typically include site plans and drawings of the proposal, its estimated cost, alongside statements on its compliance with the local plan and its expected impact on the natural and built environment.82For example, see DPHI (2024a, Part 1) and DTP (2024a, Section X). Most proposals to add new homes typically need to engage with community feedback via public ‘notice’ requirements (Section 2.4.2).
- The application being assessed: which may require the application being referred to other agencies, such as fire and water authorities. In some cases, referral authorities retain a right of veto over planning permits.83DTP (2024a, Section 3.3.1) and DPHI (2018). The NSW government has announced plans to create a central ‘Development Coordination Authority’ to better coordinate these processes: Minns (2025) and NSW Government (2025a).
- A decision being made: either by a local council, an independent planning panel, or the Planning Minister, on whether the development can proceed (with or without conditions).84Expert planning panels are used widely in NSW, Western Australia, and South Australia: Productivity Commission (2021, p. 5). See also PlanSA (2025c) for an update on recent SA reforms, and Western Australia Planning Commission (2025) on recent WA reforms.
- The decision being subject to appeal: via administrative tribunals and including, in some states, appeals brought by third parties.
Some developments, such as knock-down rebuilds of single homes, often do not require planning approval in many states, and can proceed directly to applying for a building permit.85Broadly, planning approval pertains to the use of the site and the size of the development, whereas building approval is for the specifics of the structure. For example, most new single dwellings and alterations or extensions to existing single dwellings in many states don’t need a planning permit: HIA (2025).
And several states and territories have created or expanded streamlined pathways for development applications, although few developments typically qualify (Box 2).
State and territory Planning Ministers typically have ‘call in’ powers to decide applications, subject to advice from the relevant planning department or planning commission.86Planning Ministers in all states and territories except Western Australia have the power to decide development applications: Productivity Commission (2011, p. 70). Several state governments have established ‘fast track’ pathways for large projects, with a decision made by the Minister rather than the usual assessment authority.87Productivity Commission (2025a, Table 4.1).
Box 2: States have made greater use of streamlined development tracks, but their scope remains narrow
In NSW, small developments that meet specific standards (e.g. height, lot size, etc.) can proceed without a planning permit, with approval granted by via a Complying Development Certificate (CDC) in as little as 10 days. But the CDC pathway is limited by restrictions in local council planning schemes on new dwelling types (Chapter 4).aThere are CDC standards for multi-dwelling housing types, but the local plan has to permit these types in the first instance. NSW Government (2025b) and DPHI (2023a). Overall, the CDC pathway has yielded 42,126 net new homes (that is, taking into account demolitions to make way for new developments) in Sydney since 2019. This is about 25 per cent of all net new homes approved during that time.bGrattan analysis of DPHI (2025b) and DPHI (2025c). And the NSW government recently announced plans to make it easier to vary a CDC standard and still use the pathway, and also to establish a new ‘Targeted Assessment Pathway’ that sits between a CDC and the full development application process.cSee Minns (2025) and NSW Government (2025a).
In Victoria, VicSmart offers a 10-day development assessment pathway for simple activities (e.g. removing a tree), which are assessed against limited criteria by the council CEO. No public notice is required, and there are no third-party appeals. However, over the past decade, only 1,567 total net new homes approved came via the VicSmart pathway,dAmounting to only 0.3 per cent of all net new dwellings approved. Grattan analysis of DTP (2025c). See notes to Figure 2.6 for more detail on method. although that may rise now that VicSmart will be extended to subdivisions.eAllan (2025a). The Small Lot Housing Code also sets standards for new single homes on small lots (i.e. less than 300 square metres) that can be certified by a building surveyor.fIn August 2025, the Victorian government expanded the code to all residential zones across the state: Victorian Government (2025, Clause 54) and Allan (2025b).
In Queensland, a significant number of development applications – those that are compatible with the planning intentions for an area and that meet clear guidelines regarding controls such as height limits and setbacks – can access a deemed-to-comply pathway, and do not require public consultation.gDSDIP (2025a). For example, in Brisbane, apartments buildings of 5-to-15 storeys can do so.hIncludes apartment buildings of 15 storeys in the high-density residential zone, and 5 storeys in the medium-density residential zone: Brisbane City Council (2025b).
In Western Australia, new single homes that satisfy requirements such as setbacks, site coverage, and building height can access a deemed-to-comply pathway and do not require planning approval.iDPLH (2025a) and DPLH (2025b). New residential and mixed-use projects valued at more than $2 million can now be assessed by a Development Assessment Panel.jWestern Australia Planning Commission (2025).
In South Australia, a streamlined deemed-to-comply pathway is now available for developments that meet clear standards, including detached houses in residential zones and semi-detached and row dwellings in several neighbourhood zones, with no public notification requirements and no third-party appeal rights.kPlanSA (2025d).
2.3.2 Development applications have become more onerous, and expensive
The work required to lodge a development application and comply with planning rules has increased significantly.
For example, a development application to build an apartment building in Sydney in the late-1960s was just 12 pages long. Today, a development application for planning approval for a similar apartment building runs to hundreds of pages and requires extensive environmental, traffic, and often heritage assessments. These are typically prepared by consultants, adding thousands of dollars to the cost of building new homes.88Wilson and Brooks (2025, p. 13).
2.3.3 Criteria for development approvals are often uncertain
Broadly, councils accept or reject proposals based not only on what the specific rules of their local plan say, but also the strategic objectives for a given parcel of land. Councils tend to have a wide berth to lay down restrictive objectives for areas. This uncertainty creates risk for projects, meaning higher returns are needed to compensate. Ultimately this means fewer projects go ahead.89For larger developments, pre-sales are often attempted, ‘subject to permit’.
For example, Boroondara Council in inner-eastern Melbourne has added (on top of those specified in the state-level template) an objective for some of their jurisdiction to maintain the ‘spacious, suburban character of the area’, as well as the area’s ‘leafy’ feel.90City of Boroondara (2025, p. 315). Although the new Townhouse Code helps neutralise restrictive local objectives (Chapter 5).
Similarly, Woollahra Council in inner-eastern Sydney adds that development in its most common zone (R2) should be ‘compatible with the character and amenity of the surrounding neighbourhood’ and ‘of a height and scale that achieves the desired future character of the neighbourhood’.91Woollahra Municipal Council (2014, p. 21).
Many development applications are approved subject to conditions, including variations to the design of the building, or approvals from energy or water infrastructure providers. These can make otherwise profitable developments commercially infeasible.92Productivity Commission (2021, p. 28) and Better Regulation Victoria (2019).
One NSW developer reported that they went through a development approval process with 230 conditions that needed to be addressed before they could receive a construction certificate.93NSW Productivity and Equality Commission (2024, p. 49).
If a planning permit is refused, or granted with conditions the applicant disputes, the applicant can often appeal. In Melbourne, the Victorian Civil and Administrative Tribunal (VCAT) overturns council rejections about 49 per cent of the time. Another 9 per cent of council decisions are varied (e.g. conditions the council tried to put on the development are removed). The initial council decision is upheld only 36 per cent of the time. For those overturned, applicants wait (and accrue cost) for an average of 193 days for a decision.94Grattan analysis of DTP (2025c). Covers the 6 per cent of proposals to build (net) new homes in the Melbourne GCCSA that end up in VCAT due to the applicant appealing against council decisions. Includes only new applications that were finalised between 2015 and 2025 and are directly reported as new residential development.
2.3.4 Planning approvals for more density are often subject to extended delays
In NSW and Victoria, waits for a final outcome on a planning decision can be several hundred days, and increase sharply with the number of homes being proposed (Figure 2.6).
Figure 2.6: Wait times tend to be longer for larger projects
Median residential planning permit processing times, by city and project size
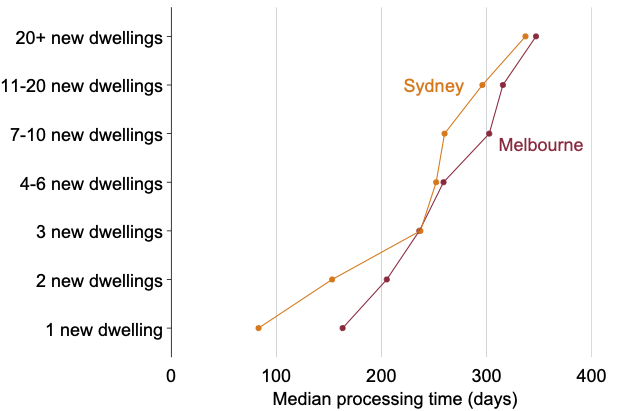
Notes: Data from 2019 to 2025 for Local Government Areas in each GCCSA. Includes only new applications that are finalised, that include a positive expected net dwelling yield, and are directly reported as new residential development. Processing time measured as days between application received and a final outcome (regardless of whether approved or rejected).
Source: Grattan analysis of DTP (2025c) and DPHI (2025c).
Delays add to project financing costs, and increase the mark-up required to make new housing commercially feasible for developers. These delays can cause developers to abandon or postpone projects. And because construction is highly sequential, delays and disruptions can create ‘cascading failures’ which push up costs, such as needing to repeat consultants’ reports or losing access to scarce labour and materials.95Productivity Commission (2025a, p. 4).
The additional holding costs – mostly financing and taxes – from waits can be material. For instance, an extra six months of permit processing time after buying a block of land in Sydney to build townhouses can add about $18,700 per home just from extra holding costs.96Uses the 75th percentile priced Sydney house on a 480 square metre block for land acquisition costs. Assumes a development of four two-storey townhouses. The same estimate for Melbourne is $11,200. Otherwise follows assumptions laid out in Appendix B.
2.3.5 Third-party appeal rights are extensive in some states
In some states, third parties – neighbouring landowners, tenants, or members of the broader community who may be adversely affected by a proposed development – can appeal against planning decisions. Third-party appeal rights can lead to further delays, uncertainty, and costs for development.97Productivity Commission (2021, p. 27).
Historically, the number of appeals (relative to population) has been substantially higher in Victoria and Tasmania than other states.98Productivity Commission (2011, Figure 3.3). However Victoria is implementing a new system that will restrict third-party appeal rights to higher-density apartments and to people directly affected.99Allan (2025c).
2.4 The governance of land-use planning systems is biased against change
Delegating so much responsibility to councils to set and enforce planning rules empowers a narrow cohort of existing residents over the interests of the broader community. Existing community consultation processes also favour older (and wealthier) residents with the time and motivation to participate.
2.4.1 Delegating authority for planning to local councils entrenches the status quo
Australia’s land-use planning regimes are some of the most de-centralised and restrictive in the OECD, with substantial power devolved to local councils to set and enforce the rules.100Cavalleri et al (2019, Figure 7).
It is therefore unsurprising that our systems lean into local voices that oppose change. The people who might live in new housing – were it to be built – often don’t get a say.
Most residents in the established middle suburbs of our capital cities already own their house. Existing residents often prefer their suburb to stay as it is, and are typically concerned that increased density will mean more traffic congestion, more crowding on public transport, more noise, and less ‘street appeal’.101Productivity Commission (2011, Table 2.4).
2.4.2 Community consultation favours (older and wealthier) existing residents
Existing residents of areas are heavily consulted in the setting of land-use planning rules and on applications to build new homes.
Amendments to local planning rules typically have to go through a public consultation phase. Where an amendment might allow more homes to be built, the potential new residents are not yet known. Therefore, these processes can only really ever seek and receive feedback from one side of the equation.102In NSW and Victoria, amending local plans can take up to two years, in part because of the required public consultation. See DPHI (2025d), Victorian Government (2013), and DTP (2024a, Chapter 2). The Victorian government has announced plans to speed up re-zoning amendments stuck with councils: Allan (2025d), and to speed up simpler planning scheme amendments: Allan (2025c).
Once rules are set, our systems then extend a generous hand to existing residents to oppose proposals to build new homes.
For most proposals to add new homes, public exhibition or ‘notice’ must be given to those who might reasonably be affected by the proposal – e.g. owner-occupiers of adjoining land.103DTP (2024a, Chapter 3) and DPHI (2018, p. 25). See also: DSDIP (2025b).
In NSW and Victoria, anyone can object and the decision-maker (the council in most circumstances) must consider the submissions it has received. Although most states do not give objectors appeal rights if (Section 2.3.5). In Queensland, anyone can object to an impact-assessable development application (the highest level of assessment), but there are no formal objection rights to code-assessable development or in ‘priority development areas’.104Objectors can still make comments on code-assessable development applications, but the decision-maker is not obligated to consider them: DSDIP (ibid).
On face value, these processes present as constituents having their voice heard by democratically-elected councilors. But in fact these processes are only superficially democratic, because only a select few older and wealthier homeowners have the time and inclination to engage.
When Ku-ring-gai Council in Sydney consulted residents on proposed up-zoning reforms in 2024, just 4 per cent of respondents were renters and 12 per cent lived in apartments. Whereas the 2021 Census showed 20 per cent of residents in the area were renters and 27 per cent lived in apartments.105Ku-ring-gai Council (2024) and ABS (2022b). And in an opt-in survey by Inner West Council, also in Sydney, older homeowners were substantially over-represented – nearly 40 per cent of the council are renters, but less than 10 per cent of survey respondents were renters.106Inner West Council (2025a, pp. 76–77).
Similarly, an analysis of community consultations in Melbourne found that older residents were over-represented in 14 of the 15 consultations examined, and homeowners were over-represented in all 15.107YIMBY Melbourne (2025b). See also Fang et al (2023) and McNee and Pojani (2021) for international evidence.
International experience suggests that when higher levels of governments take the lead on planning reforms, democratic participation improves.108Demsas (2024). International research also shows that more localised decision-making tends to mean more restrictive rules: Favilukis and Song (2025), Mast (2024), Hankinson and Magazinnik (2023), and Tricaud (2025).
2.4.3 Restrictive rules face little scrutiny
Councils are mostly held accountable by those opposing change, meaning there is little accountability for rules that are overly restrictive.
In many other areas of policy, those proposing to restrict so much economic activity would be required to reckon with the impact. But new land-use planning rules are not subject to any robust regulatory impact assessment process.
And where existing planning controls are subject to periodic review, as occurs in Victoria, these evaluations do not properly assess their impacts. For example, Victorian councils are required to review their planning schemes roughly every four years, but only against the objectives of the scheme itself.109Councils are instructed that ‘The review should assess whether the scheme provisions, such as local planning policies, zones, overlays, and schedules have been effective and efficient in achieving the objectives and strategies of the planning scheme’: DTP (2015, p. 1). Local councils in Queensland are required to review their Local Planning Schemes only every 10 years.110Queensland Government (2021).
2.4.4 State and local housing targets do not always target unmet demand and lack effective enforcement mechanisms
Some state and territory governments have set housing targets for local councils.
The NSW government has set targets for the five years to 2029, with a total state-wide goal of 377,000 new homes. The Victorian government has set targets for councils through to 2051, with a state-wide target of 2.24 million new homes by then.111DTP (2025d) and DPHI (2025e). The Queensland government has set targets for 12 local councils in south-east Queensland through to 2046.112Queensland Government (2023, Figure 3). Although the housing policy platform of the new state government does not include an explicit home building target: Queensland LNP (2024). Other states set targets for regions above the council-level, but expect councils to factor them into their strategic planning. WA, for example: DPLH (2018).
State governments set housing targets for councils in part as a way to overcome the local politics of planning. These targets, in theory, mean that each council then needs to identify how its target will translate into additional housing for each particular area within its jurisdiction, and engage with the local community as to the best way to do that.
Yet councils that hold in-demand land typically have lower targets than they should. In Melbourne, this is apparent when housing targets are measured against estimated profit margins if apartments were broadly permissible – essentially measuring unmet demand.113See YIMBY Melbourne (2024).
And local councils have often ignored housing targets set by state governments (or other bodies, such as the Greater Sydney Commission) because the targets lacked any credible enforcement mechanism. Without the prospect of ‘carrots’, such as incentive payments for meeting housing targets, or ‘sticks’, in the form of penalties for non-compliance, many councils ignore targets, because they know that extra housing would provoke disquiet among some existing local residents.114Daley et al (2018, p. 117). The NSW targets are accompanied by a Statement of Expectations that carries the threat of a council having a planning administrator appointed if these expectations are not met: NSW Government (2024).
2.5 Restrictive planning controls raise the cost of housing and encourage speculation
2.5.1 Restrictive planning rules prevent the more efficient use of land for housing
Where restrictive planning controls prevent developers from building apartments and townhouses, the cost of housing will continue to increase with rising land values in high-demand areas.
In recent decades, the price of land rose faster than the price of buildings. In 2024, land accounted for more than 70 per cent of the value of residential property, up from 50 per cent in 1990.115Grattan analysis of ABS (2024b). Rising land prices explain about 80 per cent of the growth in real house prices in advanced economies in the second half of the 20th century: Knoll et al (2017). And land values have historically risen fastest in inner-city areas.116Kulish et al (2011) and Daley et al (2018, Chapter 2). Although house and land values have risen faster in outer-suburban and regional areas since the pandemic, reflecting the increased prevalence of working from home: Yanotti et al (2024) and Ellis (2022).
Restrictive planning controls mean that those few sites where extra housing is permitted will attract a scarcity premium as developers bid up the cost of that land, raising the cost of housing that can be built on those sites.117New Zealand Productivity Commission (2024, p. 48). The cost of sites for urban infill has risen sharply in recent years, reflecting this scarcity.118The median development site cost in Melbourne has risen from $4.8 million in 2020 to $8.5 million in 2025: Heagney-Bayliss (2025).
2.5.2 These rules make housing much more expensive than it needs to be
The gap between what people would be willing to pay to put apartments on a block of land and the current price of that land for each additional apartment is an effective measure of how much planning controls are restricting housing on a given site.119Nolan (2024c).
To estimate the impact of those controls, we have estimated average excess profits – i.e. profits above the 18 per cent margin usually required to finance development – by comparing the cost of building an infill housing project of up to 12 storeys in Sydney and Melbourne, to the likely sale prices of the new units across both cities.
Among commercially feasible projects – selecting the most profitable infill option for each site – we estimate an average excess profit of up to $490,000 in Woollahra Council in Sydney, and up to $270,000 in the City of Melbourne. Average excess profits are highest in Sydney’s beach-side suburbs, and Melbourne’s inner east, reflecting greater unmet demand for floorspace in these areas (Figure 2.7 and Figure 2.8).120Calculated across the 10 Local Government Areas with the largest average profits. Figures represent profits in excess of the standard 18 per cent developer margins.
Figure 2.7: Unmet demand is strong in Sydney’s east
Average excess profit per commercially feasible home if more density were permitted
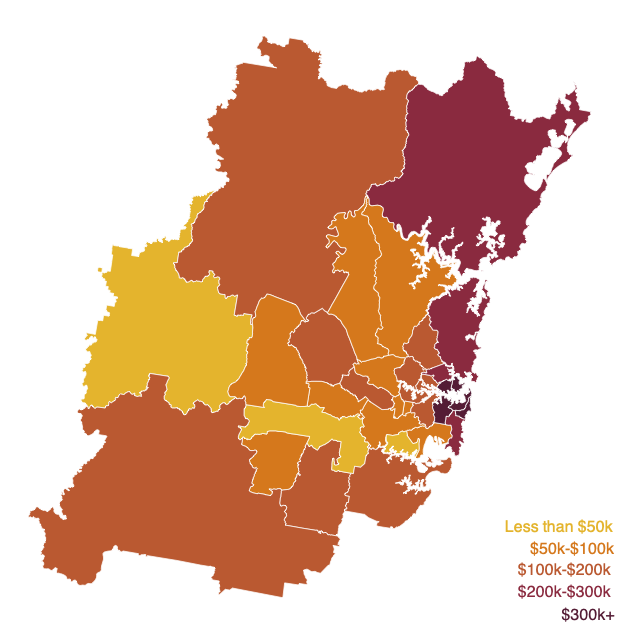
Notes: Figures represent an average of lot-level estimates for profits in excess of standard developer margins on projects up to 12 storeys in Sydney. Estimates are on a site-by-site basis, so the most profitable development on some sites may be less than 12 storeys. See Appendix B for full details on data and methods.
Figure 2.8: Unmet demand is strong in Melbourne’s inner-east
Average excess profit per commercially feasible home if more density were permitted
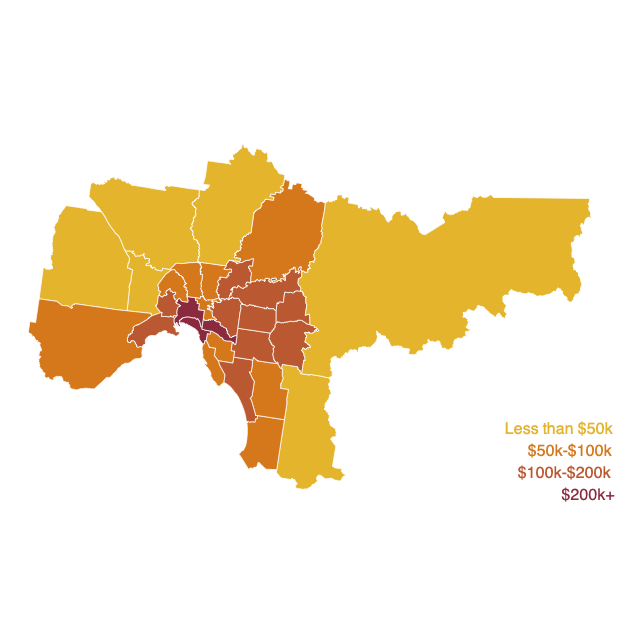
Notes: Mornington Peninsula excluded due to lack of data. Otherwise as per Figure 2.7, but with Melbourne data.
Similarly, work by Reserve Bank researchers in 2018 estimated that planning restrictions added up to 40 per cent to the price of houses in Sydney ($489,000) and Melbourne ($324,000), and about 30 per cent in Brisbane ($159,000) and Perth ($206,000), up sharply from 15 years earlier.121As demand for housing has increased, the zoning effect as a share of the price of housing has increased. See Kendall and Tulip (2018). There are reasons to think of these as upper-bound estimates of the size of the impact of land-use planning rules. For a good discussion of the debate, see Caplan (2022). For the original method, see Glaeser and Gyourko (2002). Subsequent work found that planning restrictions that prevent floorspace following land values have made apartments scarce and expensive.122Jenner and Tulip (2020). And the NSW Productivity Commission estimated that planning restrictions have made Sydney’s apartments 50 per cent more expensive than they should be.123NSW Productivity Commission (2023a, Figure 9). See also Tulip (2023). Research also shows that planning restrictions have substantially added to the price of housing in desirable parts of Melbourne, particularly in the inner-eastern suburbs.124Nolan (2024c) finds that if more six-storey apartment buildings were allowed in Boroondara, the extra homes could be built for $160,000 less than what equivalent apartments currently sell for, after allowing for a hurdle return on capital of 20 per cent.
2.5.3 Restrictive planning rules encourage speculation
Since housing in high-demand areas can be sold at high prices, sites in a neighbourhood where more housing can be profitably built become enormously valuable.125See Kendall and Tulip (2018) for individual examples of large windfall gains from rezonings. Restrictive planning controls therefore encourage speculation by developers, since securing an individual ‘site’ rezoning offers an enormous windfall gain from the uplift in land value.126The value of land where extra housing is permitted vastly exceeds the value of that land if all similar sites permitted extra housing: Kulish et al (2011, Figure 5).
2.5.4 Evaluations of restrictive planning rules regularly find their costs exceed their benefits
Land-use planning rules benefit existing residents by, for example, preserving views or preventing increased congestion. But studies conclude that the costs of restricting building are much larger – for example, inadequate housing, higher housing costs, and lower incomes from foregone agglomeration scale economies.127For example, see Cheshire and Sheppard (2002), Glaeser et al (2005), Turner et al (2014), Gyourko and Molloy (2014), and Rollet (2025).
Cost-benefit analyses of reforms to relax restrictive planning controls in New Zealand found that the benefits substantially outweighed the costs.128PwC (2021) and PwC (2020). Other studies conclude that the costs of ‘under-zoning’, or permitting too little new housing, vastly exceed the costs of zoning for too much housing to meet demand.129The main cost of ‘over-zoning’ is premature investments in infrastructure, whereas the main costs of ‘under-zoning’ are inadequate housing supply, higher housing costs, and foregone agglomeration scale economies that result in lower incomes. See Counsell (2025).
3 How state and territory planning systems should be reformed
State and territory governments should relax land-use planning rules to allow more housing where Australians most want to live.
First, state and territory governments should adopt a Low-Rise Housing Standard, which permits three storeys on all residential land in our capital cities, with no minimum lot sizes. Governments should adopt a Mid-Rise Housing Standard that permits apartments of at least six storeys within walking distance of major transit hubs and key commercial centres. And high-density housing should be permitted in other high-demand locations, including land in and around capital city CBDs. These changes would not dictate where housing must be built: they would simply permit more housing where demand is highest.
Second, planning application processes should be simplified. Developments of up to three storeys that meet clear standards such as setbacks and height limits should no longer need a planning permit. Larger developments should be granted a deemed-to-comply pathway, offering certainty to home-builders.
Third, the governance of planning systems should be fixed. State governments should take greater control of planning controls to upzone for more housing. Major changes to planning controls should be subject to cost-benefit analysis, and existing controls to periodic review. And state governments should regularly assess the capacity of their planning systems, and local government planning schemes, to meet expected housing demand.
3.1 Planning systems should maximise people’s choices by facilitating development
Planning systems should be designed to maximise people’s choices about where they live, work, and do business. The higher the demand for a location, the more housing should be permitted at that location.130See Bertaud (2018) for a detailed explanation of how market forces affect the size and shape of cities.
Planning systems should be focused on mediating between conflicting land uses, and coordinating the provision of infrastructure and public goods that form the public realm. Planning controls that aren’t focused on these fundamentals should be removed.
Forbidding development on the grounds that it will lead to more commuters in a specific area only pushes those people elsewhere – often to locations further out and with less public transport, leading to even more traffic and congestion. Congestion is best managed in our cities using other policies, such as road-user charging, and the effective provision of public transport, which also becomes cheaper at higher densities.131See Terrill (2019) and NSW Productivity Commission (2023b).
3.2 Planning systems need to allow for substantially more housing than is expected to be required in coming years
Most new housing is built by private developers. These developers need to earn a profit for a project to be commercially feasible to build, and they need to show they can make a profit beforehand to secure finance for the project.
Councils and government planning agencies will often argue that they have zoned sufficient land for further development.132See City of Boroondara (2016). Yet much of this zoned capacity is merely theoretical. This is the case if it is commercially infeasible to develop once the cost of demolishing existing dwellings is taken into account, especially where the number of extra homes that can be built is low.133Nolan (2024c). The more homes that can be built, and therefore the higher the potential profit, on a given site, the more likely the development will go ahead.134Rollet (2025, Figure 2).
Further, it may be impractical to service all commercially feasible sites with the necessary infrastructure. And not all sites will be built on: many owners of sites that could profitably accommodate more housing will not want to sell.135NSW Treasury research indicates the average property turns over every 9.7 years: Bandeira et al (2022). Not all developers will choose to develop all commercially viable sites that they own at once, or some may struggle to attract sufficient pre-sales to line up financing for a project, or may be unable to secure a builder. And finally, not all development applications will be approved (Figure 3.1).
Figure 3.1: There needs to be many profitable opportunities to build new housing to ensure a sufficient flow of new homes
The housing development pipeline
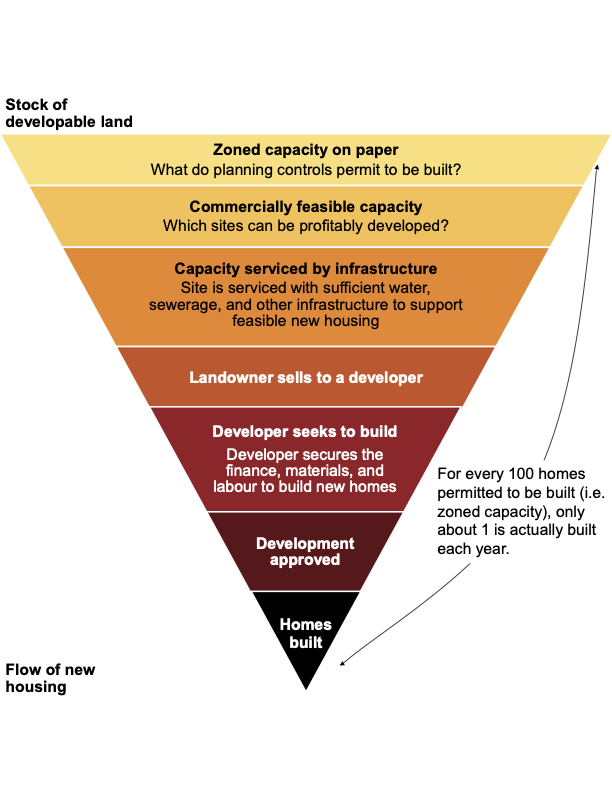
Source: Figure adapted from Mecone (2023, Figure 6). Estimates are Grattan analysis of New Zealand Infrastructure Commission (2022, Table 11), Greenaway-McGrevy (2023), and Monkkonen et al (2024).
A recent survey of zoned capacity in California showed that on average, about 1 per cent of all zoned capacity is built as new housing each year.136Monkkonen et al (2024, Table C3). Similarly, estimates of the increase in housing construction arising from planning reforms in Auckland suggest that only 0.7 per cent of the boost to zoned capacity was built as additional new housing each year.137Grattan analysis of New Zealand Infrastructure Commission (2022, Table 11) and Greenaway-McGrevy (2023). And a New York study found that only about 9 per cent of any increase in permitted floorspace was developed into new housing over 10 years.138Rollet (2025, p. 10).
3.3 Permit three-storey townhouse and apartment developments in all residentially-zoned land in our capital cities
State and territory governments should adopt a Low-Rise Housing Standard that permits townhouse and apartment developments of up to three storeys on all residential-zoned land in capital cities, with no minimum lot sizes. The permissible site coverage should be at least 65 per cent.
This reform would permit substantially more homes in our cities, while imposing only modest costs on neighbours via overshadowing or changes in the streetscape (Figure 3.2).
Figure 3.2: Three-storey townhouses and units can be designed in ways that don’t unduly affect neighbours
Building envelope on a 990 square metre block given height limits, setbacks, and maximum site coverage ratio
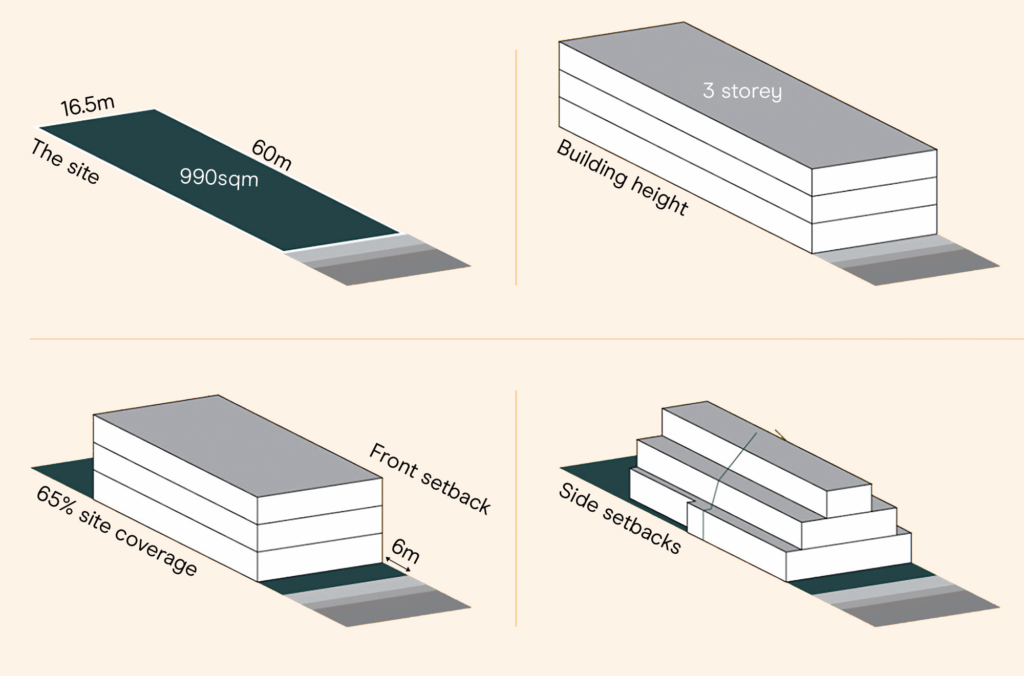
Note: Front, rear, and side setbacks are illustrative only. Source: Adapted from Ratio (2025).
Subdivisions for townhouses are an easy way to boost density and allow more housing on scarce inner-city land without the need for lot amalgamations.139About half of all residential-zoned blocks in Sydney and Melbourne are larger than 600sqm, and nearly two-thirds in Brisbane, Perth and Adelaide. In fact, more than 60 per cent of new homes use less than 400sqm of land, including many on the fringes of our capital cities. Grattan analysis of ABS (2022c).
Victoria’s Townhouse and Low-Rise Code provides a template for reforms in other states and territories. It sets standard built-form controls (height, setbacks, site coverage, etc.). Councils are then unable to knock back proposed developments that meet these standards on the basis of built form (Chapter 5).140Permissible site coverage under the Code is 60 per cent in Neighbourhood Residential and Township Zones, 65 per cent in the General Residential Zone, and higher in other zones: DTP (2025e).
This reform could quickly lead to more housing, as the experience of Auckland shows (Box 3). Townhouses take just under a year to build, on average, compared to just over two years for apartments.141ABS (2025b). Such developments can often be achieved without the need for lot amalgamation or the specialised equipment typically required for bigger projects.
Box 3: Auckland shows how reforming planning controls can quickly lead to more and cheaper housing
In 2016, Auckland – a city of 1.5 million – rezoned about three quarters of its suburban area. Subsequent studies show that the policy boosted the housing stock by upwards of 4 per cent.aGreenaway-McGrevy and Phillips (2023) and Greenaway-McGrevy (2025). Criticisms of these studies are misguided: Murray and Helm (2023) and Donovan and Maltman (2025). Most of this new stock was extra townhouses and small apartment buildings (Figure 3.3). The upzoning also supported a rapid expansion of state-developed social and market-rate housing, which tripled as a share of all dwelling consents.bFrom 3 per cent over the 10 years before the reforms to 10 per cent over the six years after: Greenaway-McGrevy (2024a).
That extra housing reduced rents for two- and three-bedroom dwellings by up to 28 per cent compared to where they would have been without the reform, with the biggest fall in rents among cheaper dwellings.cGreenaway-McGrevy (2023) and Maltman (2023a). Asking rents in Auckland are lower now – after taking account of inflation – than they were in 2016, whereas those across the rest of New Zealand are up by 10-to-15 per cent over the same period.dMaltman (2023b). Over the same period, house prices in Auckland have fallen by 15 per cent in real terms, compared to a 13 per cent increase for New Zealand as a whole: Grattan analysis of Real Estate Institute of New Zealand (2025) and Reserve Bank of New Zealand (2025).
The Auckland experience also confirms that planning systems need to allow for much more zoned capacity for new housing than expected demand over coming decades. Before the reforms, central Auckland had zoned capacity of about 1.5 times the existing population.eNew Zealand Infrastructure Commission (2022, Figure 2). Yet housing was still scarce and expensive, because much of that capacity was in low-demand areas where it wasn’t profitable to build.
Further, the reforms appear to have boosted construction sector productivity, in part by boosting the average size of residential construction firms, and by shifting construction towards higher-productivity regions.fMaltman (2025) estimates that construction sector productivity in Auckland rose by 8 per cent in the decade following the reforms.
Figure 3.3: Auckland had strong growth in townhouse construction after the 2016 reforms
Annual dwelling approvals in Auckland by zone type
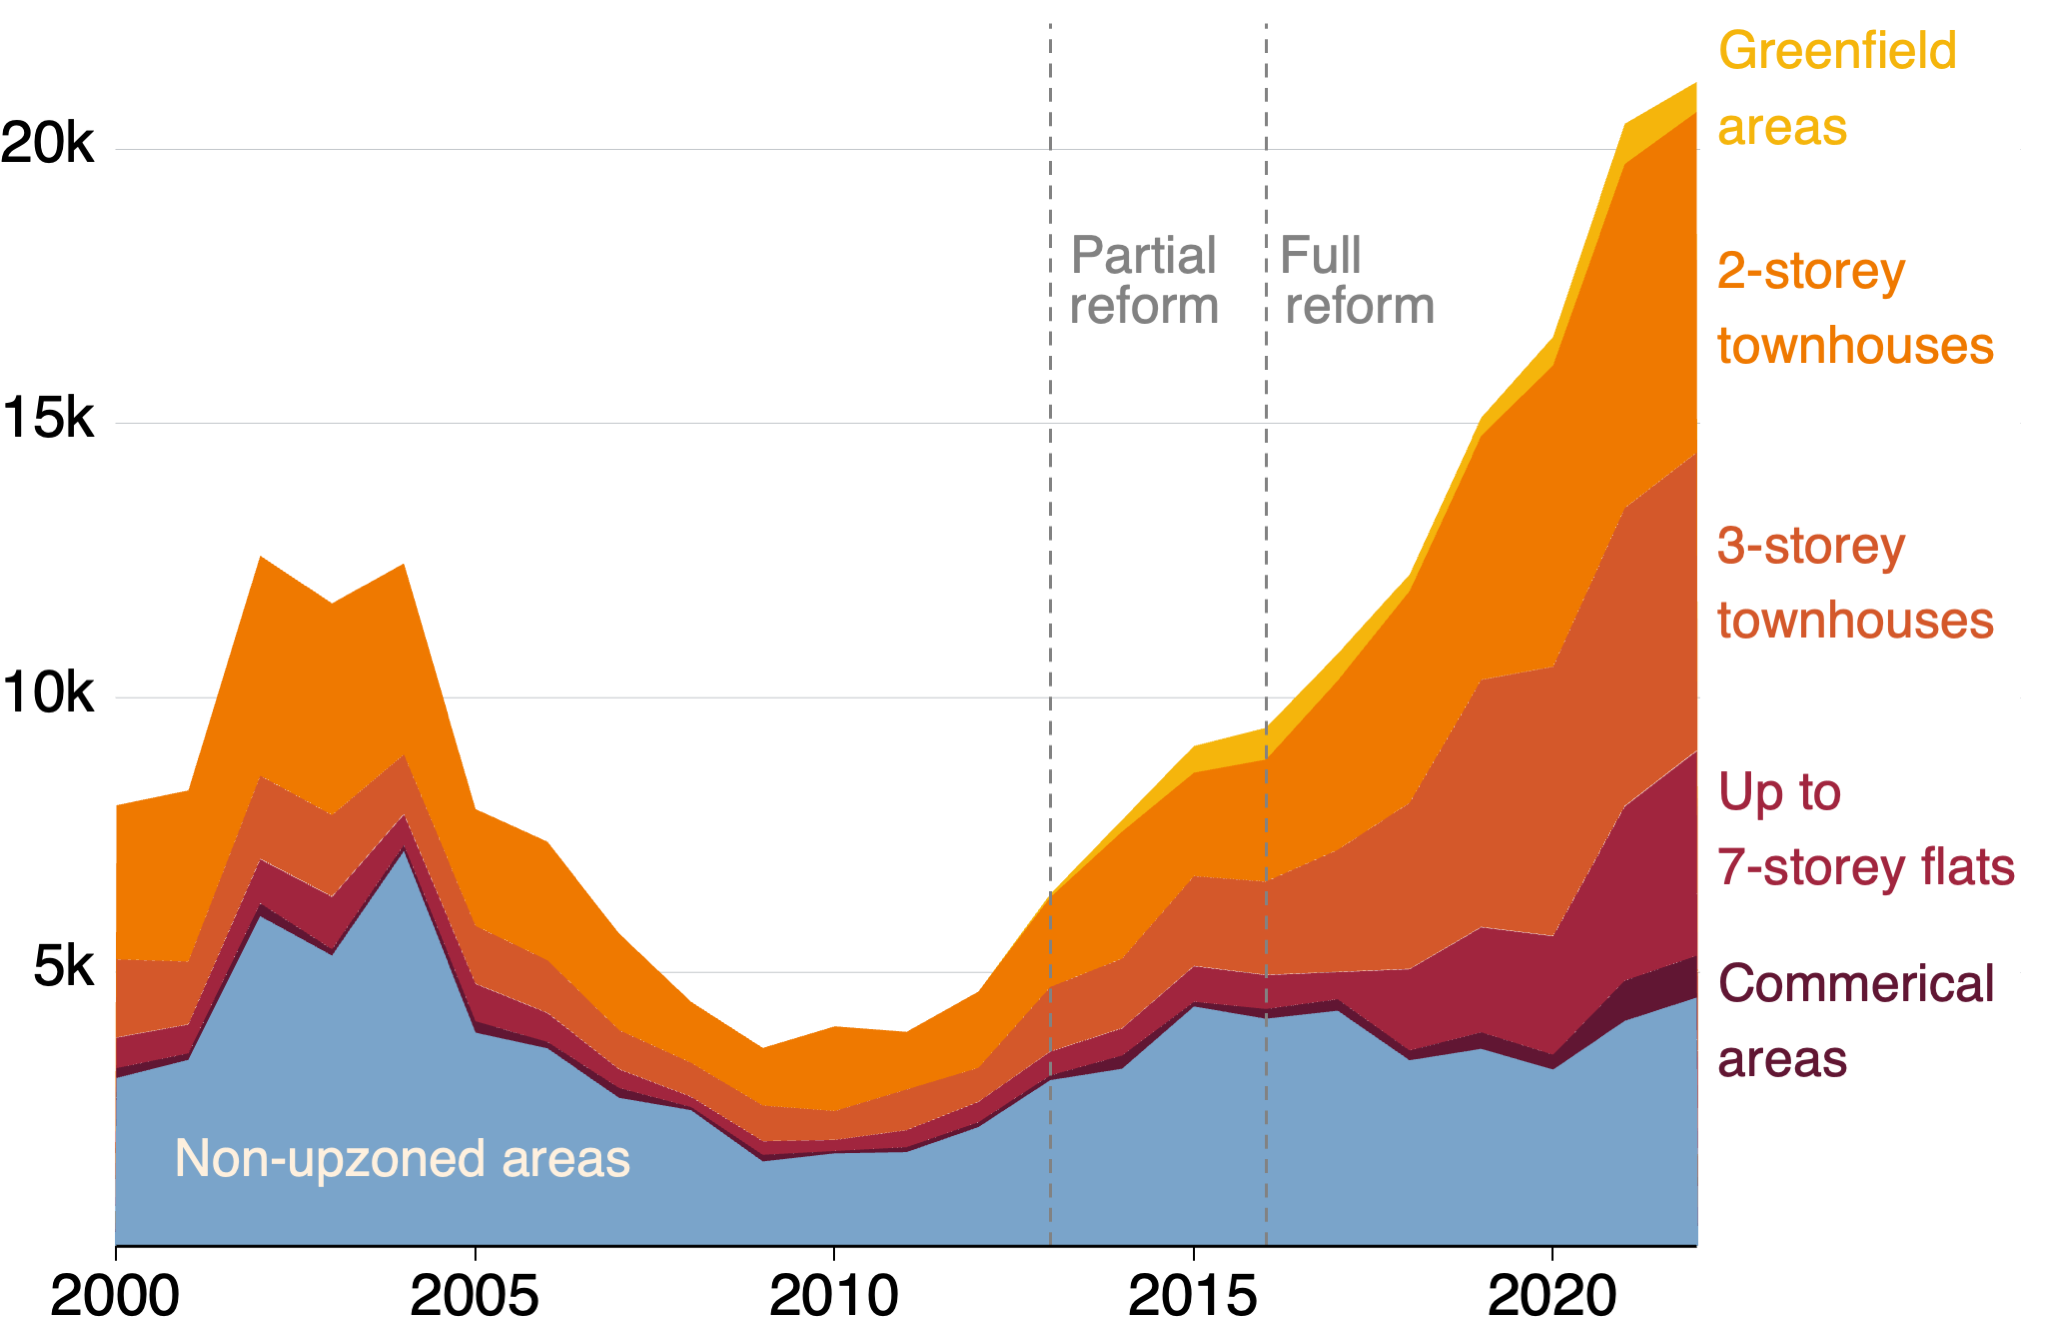
Notes: ‘Partial reform’ refers to the Special Housing Areas and Auckland Housing Accord, launched in September 2013. ‘Full reform’ refers to the final Auckland Unitary Plan, which became operational in November 2016.
Source: Greenaway-McGrevy (2023).
New Zealand’s Medium Density Residential Standards (Box 4) also allowed three-storey developments on all residential-zoned land in major cities. Analyses showed that the benefits – in the form of cheaper and more abundant housing and higher incomes from better access to jobs – were double the costs, such as extra congestion, overshadowing, and loss of views.142See PwC (2021, Table 2).
Similarly, SGS Economics & Planning put the cost of each extra home in a medium-density development at $29,200 due to increased storm water runoff, loss of private open space, and loss of tree canopy.143SGS Economics & Planning (2020, Table 1). Whereas the benefits of extra housing, measured by consumers’ willingness to pay for it, routinely exceeds the cost of constructing those homes by hundreds of thousands of dollars (Section 2.5).
Allowing modest density housing across broad swathes of Australia’s capital cities is unlikely to add materially to infrastructure capacity constraints. In practice, only a small number of sites in any given suburb will be redeveloped each year.144Bandeira et al (2022).
Box 4: New Zealand offers a template for Australian state and territory government reforms to residential land use
In August 2020, the New Zealand government enacted the National Policy Statement on Urban Development, which required at least six-storey developments to be allowed within walking distance of rapid transit stops, commercial hubs, and city centres.aNational Policy Statements are central government directions that councils must comply with. See West and Garlick (2023). And councils are now required to justify ‘character’ protections on a site-by-site basis against the need for more housing.
In December 2021, the government introduced Medium Density Residential Standards (MDRS), which directed councils in New Zealand’s five largest cities to permit dwellings up to three storeys, across all residentially-zoned land.
The National Party government, elected in October 2023, has permitted Auckland and Wellington to opt out of the MDRS – but their own housing plans allow at least as much housing as the MDRS would have.bBrunskill (2025).
Further, councils will now be required to ‘live zone’ for sufficient ‘feasible’ capacity to meet the expected demand over the next 30 years.cBishop (2024). The government is yet to define ‘feasible’ as part of the new reforms. Previously councils were required to zone for three years of demand.
The National Policy Statement on Urban Development also remains in force.
3.4 Upzone for at least six-storey apartments in high-demand locations, including key transit hubs
State and territory governments should adopt a Mid-Rise Housing Standard, which permits developments of at least six storeys in high-demand locations in capital cities, such as:
- Around other high-demand locations, such as other commercial hubs.
- Within at least 2km of the edge of the CBD
- Within at least 400m of key transit hubs, including train, tram, and high-frequency bus stops
Many of the world’s most iconic and livable cities – such as Paris, Vienna, and Copenhagen – provide for medium-density housing of six or more storeys broadly across much of their inner areas. This allows many more people to live where the city is at its best: near transit and cultural hubs, near their jobs, and near their friends, families, and communities.145YIMBY Melbourne (2023, p. 8) and NSW Productivity Commission (2023a, Figure 8). Density creates demand for amenities such as shops, cafes, and restaurants. Being close to amenities also makes communities more walkable.146NSW Productivity Commission (2024) and Ahlfeldt and Pietrostefani (2019).
Allowing higher densities of six or more storeys in high-demand locations also increases the prospect that the extra homes will be profitable to build after accounting for the costs of purchasing and then demolishing any existing buildings on a site.147For example, Rollet (2025) showed that more than 15 per cent of sites in New York City that increased the allowable floor-space ratio by more than two were redeveloped over two decades. This compared to less than 5 per cent of sites that had an increase of less than one. For example, apartment buildings of three-to-five storeys tend to be more expensive to build, per extra home, than apartment buildings of six-to-10 storeys.148For example, Jenner and Tulip (2020, Figure 7) shows that the cost of each dwelling in an apartment building initially falls with each additional storey that is added, because the cost of the land is defrayed across more apartments.
State governments should also permit much higher densities than six storeys in capital city CBDs and other high-demand locations.149The costs of higher buildings in the CBD in particular are likely to be negligible relative to the benefits of additional well-located homes close to jobs and other amenities. See Glaeser et al (2005).
Decisions on the precise locations where higher-density housing is permitted, and the building heights permitted, should be informed by analysis of where that housing is most commercially feasible (Chapter 5). The NSW Transport Oriented Development Program, and the Victorian Activity Centre Program, provide templates for reforms for other states. These programs will permit more housing on land around 45 precincts in NSW (including 37 in Sydney), and 60 centres across Melbourne. But these programs should also be expanded (see Chapter 5).
An assessment of New Zealand’s National Policy Statement on Urban Development, which required councils to allow for apartment buildings of at least six storeys along key transit corridors, found that the benefits of greater density exceeded the costs by a ratio of seven to one in Wellington and five to one in Auckland.150PwC (2020, Table 10) and PwC (2021, p. 18). Similar reforms have been introduced in Washington State in the US, and British Columbia in Canada.151Washington State Department of Commerce (2025) and Oleksiuk (2024).
3.5 Standardise residential zones and remove harmful tools from planning regimes
State governments should define residential zones at the state-level, with more detailed specifications on permissible built form.152For example, the Victorian Government re-wrote its zones in 2013 and now the Victoria state-level template – the Victoria Planning Provisions – defines zones in much more detail: DTP (2013) and Victorian Government (2025, Clause 32.09). In NSW in particular, residential zones bear too little relation to the actual housing permitted on land subject to those zones (Box 1).
Planning systems also often deploy a bewildering array of tools that limit new housing construction. Only a few built-form controls are essential, such as height controls or side setbacks to limit overshadowing.
State and territory governments should phase out harmful and duplicative tools from their planning systems. The most obvious examples are floor-space ratios and restrictions on housing types, such as those used in NSW.
Particular housing types do not by themselves harm neighbours. A large single family home with many bedrooms is likely to have similar impacts on neighbours, via overshadowing, as a set of smaller terrace houses with the same built footprint.
Maximum floor-space ratios do affect the final size and shape of built form, and therefore address problems such as overshadowing. But height limits control this much more directly. Most often, floor-space ratios result in a building being smaller than a more explicit control – such as height – might suggest it can be (Box 1).
3.6 Review heritage controls in land-use planning systems
State and territory governments should review of the application of heritage controls within their planning systems.
There is clear social benefit to protecting some historically significant architecture. But with fast-growing populations, our cities will need to continually evolve, and broad-based heritage protections prevent this. Chiefly, these protections mean far fewer homes where people most want to live and work (Section 2.2.2). And the broad application of heritage protections is increasingly being used by local councils as a way to stymie state government attempts to permit higher-density housing in their neighbourhoods.153Koziol (2023).
These reviews should measure the social and economic costs of foregone development from protections as applied, and their benefits. They should also assess whether the tools (particularly those that liberally protect large areas – such as Heritage Conservation Areas in NSW and Heritage Overlays in Victoria) take sufficient heed of both the costs and benefits of protections.
The ultimate goal of these reviews should be to identify ways to allow for more housing in high-demand areas while sustaining heritage protections where they are in the public interest.
For example, state and territory governments could require local councils new heritage protections to be offset by commercially feasible upzoning elsewhere in the local government area.154New Zealand is considering this approach: New Zealand Department of Housing and Urban Development (2025).
3.7 Improve consistency and certainty in state and local planning approval processes
Planning systems should say ‘yes’, by default, to modest-density developments, without the need for a planning permit. And higher-density developments such as apartment buildings should be granted deemed-to-comply pathways, as much as practicable.
Simplifying and streamlining these processes would accelerate approvals, reduce uncertainty, and make more new housing commercially feasible to build.
3.7.1 Modest density should not need a planning permit
Townhouse and apartment developments of up to three storeys – those that should be permitted on all residential-zoned land in our capital cities (Section 3.3) – should no longer require a planning permit in most instances, just like knock-down rebuild homes in many states already (Section 2.3).
The NSW government’s complying development pathway provides a template for reform for the other states and territories (Box 2).
Developments would still need to meet specified built-form standards for things such as height, setbacks, and site coverage, for example. Such standards enable developers to know ahead of time what built-form will be acceptable on a given site.
Exceptions could remain for developments on sites that are subject to additional protections, such as heritage, bushfire, or flood. And developments would still need to secure a building permit, and therefore meet all building standards.
3.7.2 Medium- and high-density housing should have a deemed-to-comply pathway
There should be deemed-to-comply pathways for apartment developments of four-to-six storeys. Developments that satisfy the deemed-to-comply standards – covering controls such as height, setbacks, and site coverage – should not require public notice and not be subject to third-party appeals.
Developments that meet the standards would still need planning approval, but if a development meets the standards, it should not be denied on the basis of the built form. Victoria is pursuing this approach, and Queensland, and South Australia have adopted it (see Box 2).155Abbott (2025). Developments on sites subject to heritage, bushfire, or flooding overlays would still require a full application for planning approval.
Deemed-to-comply pathways should also be available to higher-density developments, as much as is practicable, as is common in Queensland. Where councils lack the resources to administer more complex high-density standards, state and territory governments should expand state-level assessment regimes to do so.
3.7.3 States and territories should review the extent and cost of post-approval conditions
Post-approval conditions are often needed to ensure compliance and mitigate adverse outcomes for the environment, heritage, and public health and safety.156Productivity Commission (2021, p. 28).
But they add cost and uncertainty. State and territory governments should review the prevalence of conditions applied to development approvals. The aim should be to ensure more consistency and clarity in post-approval conditions applied by local councils.
3.8 Fix planning system governance
Land-use planning restrictions have historically been imposed with too little regard to the costs of preventing more homes being built. These rules should face more scrutiny. Where rules prevent more homes, those imposing the rules should be obligated to show that the benefits of doing so outweigh the costs.
A formal process to better scrutinise land-use rules is needed. Major changes to state and local planning schemes should be subject to regulatory impact assessment, including cost-benefit analysis.157This is consistent with recent Productivity Commission recommendations to ensure regulations face more scrutiny and be geared towards growth, competition, and innovation: Productivity Commission (2025b, p. 3).
3.8.1 Regularly assess the commercially feasible capacity embedded in planning systems
State and territory governments should regularly assess whether planning regimes allow for sufficient zoned and commercially feasible capacity to build more housing state-wide, and also for each local council area.158For an example of such an assessment, see Fairgray (2023).
State, territory, and local governments should also regularly assess whether planning restrictions are preventing commercially feasible opportunities to build more housing. Among the measures state governments should adopt are:159For a more detailed assessment of potential metrics, see Valiente et al (2024).
- Trends in the ratio of urban to rural land prices at the urban fringe of capital cities.
- Comparisons of the price of newly built homes to the cost of constructing those homes, as estimated in Section 2.5.
- Trends in the ratio of house prices to the cost of constructing new dwellings for different housing types and locations.
3.8.2 Set local council housing targets with regard to demand, and enforce them
State governments regularly set new housing targets for local councils. These targets arguably become less important should state governments adopt our recommendations to relax planning controls to permit more housing in high-demand areas, and to streamline development approval processes to reduce council discretion in assessing many development applications.
Nonetheless, councils are likely to retain substantial influence over land-use planning rules, and their application via development approvals. Therefore, these targets should better reflect unmet demand for housing (Section 2.4.4), and should be better enforced. Areas with high demand but restrictive controls should not be given low targets on the grounds that their planning rules prohibit new housing. Instead, local council housing targets should reflect where demand is highest.160YIMBY Melbourne (2024).
State and territory governments need to wield bigger ‘sticks’ to ensure councils meet housing targets. These might include the state government taking over a larger share of development applications if councils fail to back appropriate development, or re-writing local council planning schemes to permit more housing.
State and territory governments should also offer ‘carrots’, such as bonus payments for councils that meet or exceed housing targets. Bonuses would need to be large enough to outweigh the political costs to councils of pro-development decisions.161Daley et al (2018, p. 117).
For example, the NSW government has committed $200 million in financial incentives for councils that meet the new expectations for development applications, planning proposals, and strategic planning. The government will also publish council league tables of average wait times for development approvals, as part of its Faster Assessments program.162If a council consistently underperforms, the Minister for Local Government has the authority to issue a Performance Improvement Order. See Scully (2024).
4 The benefits of building more homes where people want to live
Relaxing land-use planning controls would make housing cheaper and give Australians more choices, while creating wealthier, healthier, and more vibrant Australian cities.
A planning system that allows more homes where demand is high will lead to more and cheaper homes. Our reforms would lower house prices and rents by 12 per cent over a decade, and more than 20 per cent over two decades.
Planning reforms would support a more productive construction sector, in part via an increase in the size of construction-sector firms and greater competition among firms that build medium-density housing.
Scarce and expensive housing acts as a handbrake on economic mobility and productivity. Relaxing land-use planning controls as we recommend could boost Australia’s GDP by up to $25 billion a year (in today’s dollars), or 1 per cent, in the long term. These benefits arise largely from allowing more people to live in high-wage locations and improve their earning potential.
And building more housing in established suburbs is also cheaper for taxpayers. Servicing a new home in an established suburb with infrastructure can be up to $75,000 cheaper than servicing the same home on the urban fringe.
4.1 A planning system that allows more homes means cheaper homes
A planning system that allows more homes where demand is high will lead to more and cheaper homes. More housing choices and lower housing costs would free up Australians to spend more of their incomes on other things.
If our proposed reforms had the same impact on new housing construction as similar reforms in New Zealand are expected to have (Box 4), they would lift housing construction in Australia by an average of more than 67,000 homes each year over the next decade.
This boost to annual housing construction would be the equivalent of adding about an extra 0.6 per cent of the existing housing stock each year,163Grattan analysis of ABS (2025h), StatsNZ (2025), PwC (2020), and PwC (2021). This ratio would fall over time as the baseline stock grows. which would reduce house prices and rents by an extra 1.5 per cent each year.164Uses the midpoint of existing estimates for the price elasticity of the demand for housing in Australia such that each 1 per cent increase in housing corresponds with a 2.5 per cent decrease in prices and rents, all else being equal. See Daley et al (2018, p. 111), Tulip and Saunders (2019, p. 28), and NSW Productivity Commission (2023a, p. 16).
Such a boost to housing construction would result in house prices and rents being up to 7 per cent lower than otherwise after five years, and 12 per cent lower after a decade. The typical renting household could be up to $1,800 a year better off, and more than $100,000 could be shaved off the cost of a median-priced home.165Grattan analysis of ABS (2024b, Table 42), ABS (2025a, Table 9), ABS (2024a, Table 1), ABS (2025b, Table 37), ABS (2025h, Table 1), ABS (2022b), Cotality (2025), NHSAC (2025, Table O.1 and Chart 5.1), StatsNZ (2025), PwC (2020), and PwC (2021). Dwelling stock grows in line with NHSAC projections and rents grow at 2.5 per cent. Reforms add an extra 67,000 homes each year from 2026-27 (0.6 per cent of the existing stock, as per the NZ uplift). This wedge impacts rents at a rate of 2.5 per cent for each 1 per cent of additional housing, as per the previous footnote.
And the benefits of these reforms would continue to build in the long term. For instance, should the uplift in housing construction continue over two decades, these reforms could deliver an extra 1.3 million homes, reducing house prices and rents over 20 per cent.
These estimates are not merely theoretical. In 2016, about three-quarters of the residential land in Auckland, New Zealand, was up-zoned. Researchers have found it led to an increase in housing supply of at least 4 per cent in five years, and a decline in rents of 14-to-35 per cent for two- and three-bedroom dwellings.
And the upzoning in Auckland supported a rapid expansion of state-developed social and market-rate housing, which tripled as a share of all dwelling consents, from 3 per cent over the 10 years before the reform, to 10 per cent over the six years after (Box 3).
A large body of evidence shows that when planning controls are relaxed, the result is more and cheaper housing (Figure 4.1).
Figure 4.1: There is lots of evidence that relaxing planning controls will lead to more and cheaper housing
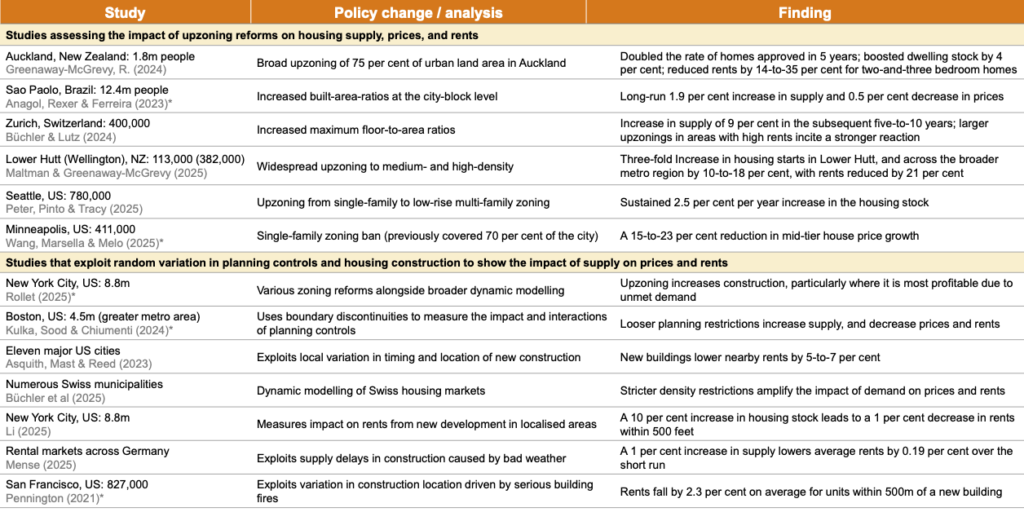
Note: * indicates the paper is still in working paper status as at publication of this report.
Sources: Anagol et al (2024), Asquith et al (2023), Büchler and Lutz (2024), Büchler et al (2025), Greenaway-McGrevy (2024b), Kulka et al (2024), Li (2021), Maltman and Greenaway-McGrevy (2025), Mense (2025), Pennington (2021), Peter et al (2025), Rollet (2025), and Wang et al (2025). Population data sourced from GeoNames (2025). See also Tulip (2024, Section 2) for a summary of the literature.
Relaxing planning controls will boost housing construction despite recent increases to construction costs and slowing apartment price growth, which have weighed on the commercial feasibility of new housing projects since the pandemic.166Charter Keck Kramer (2025). Our analysis of recent planning reforms in NSW and Victoria (Chapter 5), and the further reforms recommended in this report (see Section 5.7), shows that a substantial proportion of new housing capacity unlocked in Sydney and Melbourne is commercially feasible to build today. This is particularly the case for townhouses in both cities, and apartments in the eastern and northern suburbs of Sydney.
Relaxing planning controls means that housing supply can accelerate at the same time that house price growth slows or even if house prices fall. By substantially increasing the number of sites where new housing is allowed, planning reform would reduce the cost of land for development by reducing the scarcity premium built into land values today.167While upzoning has an ambiguous effect on the absolute level of land prices per square metre, since increasing permissible development on a site can make it more valuable, upzoning unambiguously reduces the cost of land per extra dwelling or per unit of floor area constructed. See Greenaway-McGrevy (2025, p. 6) and Section 2.5. Since developers would pay less for the land they need for each new home they build, they could sell homes for less and still make a commercial return.168In fact the cost of acquiring land for each new apartment should fall in anticipation of lower sales prices for new homes in the long term. See Greenaway-McGrevy (ibid). This effect would be dampened if competition among suppliers were low. But housing construction remains a highly-fragmented industry – across NSW, Victoria and Queensland, no individual developer controls more than 2.1 per cent of development sites: Productivity Commission (2025a, p. 26).
Despite producing a substantial increase in housing construction in high-demand areas, the urban landscape would change only gradually. For example, if Melbourne were to absorb 20 per cent of the extra 1.3 million homes we anticipate nationwide over the next two decades on land within 15km of the CBD, population density in that area would still be lower than that of Los Angeles today (Section 1.4.1).
4.1.1 More housing makes homes cheaper, especially for low-income earners
Boosting housing supply would especially help low-income earners. Irrespective of its cost, each additional dwelling adds to total supply, which ultimately improves affordability for all. People who move into the newly-built dwellings vacate their existing homes, creating ‘moving chains’ that free up homes for lower-income households.
US research shows that new market-rate construction quickly benefits low-income earners.169Mast (2023). One study suggests that new high-end construction can improve affordability throughout the housing market more than building cheaper housing targeted at lower-income earners.170Abramson and Landvoigt (2025). Similarly, analysis in Germany found that new supply frees up units in all market segments.171Mense (2025).
A recent study in Finland traced the moving chains triggered by new units being built within 3km of Helsinki’s CBD. While these new, well-located units are typically taken up by people in the top half of incomes, the moving chain quickly reaches middle- and low-income households, who get to upgrade to better-quality and better-located housing.172Bratu et al (2023).
Australian evidence shows that when housing supply is inadequate, higher-income earners can displace people on lower incomes.173Hansen and Rambaldi (2022). See also Nygaard et al (2022). Reducing the cost of housing overall would also reduce the cost of social housing, since it would reduce the gap between the market cost of housing and what low-income earners can afford to pay.174This ‘subsidy gap’ is now estimated at $24,000 a year: Coates et al (2025, p. 53). Building more homes overall means that a given social housing funding envelope can house more vulnerable Australians.
4.1.2 Newer homes are of higher quality than those they replace
Newly built homes in established suburbs are also typically much higher quality than the homes they replace. For example, just 15 per cent of newly-built houses, and 22 per cent of apartments, have an energy efficiency rating of less than 6 stars, compared to more than 90 per cent of established houses that have been assessed via the Nationwide House Energy Rating Scheme.175June 2021 to August 2025. CSIRO (2025).
And the Australian Housing Conditions Dataset survey showed that recently-built homes were more likely to have been rated as being in ‘excellent’ condition than older homes.176For example, half of all homes built after 2010 were deemed to be in ‘good’ condition, and 35 per cent were deemed to be in ‘excellent’ condition, whereas homes built before 1990 were mostly reported to be in ‘average’ condition.
In fact, poorer-quality homes are the most likely to be demolished to make way for new townhouses and apartments, since those sites are typically the cheapest to purchase in a given area, and therefore the most commercially feasible to redevelop for new housing.
4.2 Relaxing planning controls would lift productivity in the housing construction sector
Relaxing planning rules would lift flagging productivity in Australia’s construction sector.
One recent study estimates that zoning reforms in Auckland (see Box 3) boosted construction sector productivity by 8 per cent, in part via an increase in average construction sector firm size and greater competition among construction sector firms.177Maltman (2025).
US research suggests that land-use regulations have slowed construction productivity by restricting construction firm size.178D’Amico et al (2024).
The Productivity Commission and the Committee for Economic Development of Australia (CEDA) have both identified differences in planning rules across councils as a constraint on the capacity of builders to standardise designs and processes, and firms’ capacity to expand into different council areas.179Productivity Commission (2025a) and Wilson and Brooks (2025).
And offering developers a broader range of potential sites for housing development is also likely to boost construction productivity, since developers are less likely to be constrained to more difficult sites, such as those with poor soil conditions or site access, where the costs of construction are higher.
Australia’s housing construction workforce can expand
Some have raised concerns about the availability of construction workers to build more housing in the short term should planning controls be relaxed.180Bleby (2025). But the potential for the construction industry to expand, especially in the long term, should not be understated.
Over the past 10 years, the number of people employed in construction in Australia grew by 30 per cent to reach 1.3 million – almost one-in-10 workers. The overall labour force grew by 22 per cent over that period.181Grattan analysis of ABS (2025i, Table 4) data. And past Grattan Institute work has identified opportunities to boost the supply of construction workers via reforms to Australia’s skilled migration program.182Coates and Wiltshire (2024a).
4.2.1 Streamlining development approvals would make more housing commercially feasible to build
Streamlining planning approval processes, by no longer requiring planning permits for modest density, and expanding deemed-to-comply pathways to high-density housing, would make housing cheaper to build.
At present, for a typical townhouse development in Sydney of three-to-four new homes, the median wait time for a permit is 154 days. Whereas for the same project type via the Complying Development Certificate pathway, waits are typically only 39 days. This difference – 115 days – can save up to $11,700 per dwelling, mostly via lower financing costs as the project moves along more quickly.183Grattan analysis of DPHI (2025c) and DPHI (2025b). 2019 to 2025 data. Cost savings estimate follows assumptions used in Section 2.3.4.
Making housing cheaper to build would make more projects commercially feasible for a given level of construction costs and end sale prices. More predictable wait times and outcomes can also lower developers’ target profit margins, because projects become less risky.
Better Regulation Victoria concluded that reducing unnecessary development delays could deliver between $400 million and $600 million per year in benefits, or 2 per cent of the value of construction in Victoria.184Better Regulation Victoria (2019).
4.3 Allowing more housing where people want to live would boost Australians’ incomes
Cities are economic engines, but our planning systems have constrained access to them. This drags on productivity and lowers living standards.185See NSW Productivity Commission (2024, Section 2) for a comprehensive summary of the literature on this topic.
Relaxing land-use planning controls – and thereby letting more people live and work where they want – could boost Australians’ incomes by up to $25 billion a year (in today’s dollars), or 1 per cent of GDP in the long term:
- An increase in workers’ wages coming from letting more people live in high-wage locations and improve their earning potential could boost Australians’ incomes by up to $20 billion a year by 2050.186NSW Productivity Commission (2024, Appendix A) use the Glaeser and Gyourko (2018) simplified model of spatial labour misallocation caused by artificial housing scarcity to estimate a GDP impact of 1.5 per cent. The intuition of the model is that if housing costs are lower, more people will move to more productive employment opportunities, including newly-arrived migrants. We assume that our reforms could solve half of this spatial misallocation by 2050. We then use ABS (2024b) to derive an estimate in nominal GDP terms.
- A lift in productivity per worker, from higher agglomeration scale economies arising from greater density, could boost Australians’ incomes by up to $5 billion a year by 2050.187Follows the supply uplift estimate outlined in Section 4.1 and adopts the estimate of Ahlfeldt and Pietrostefani (2019) that a 10 per cent increase in employment density could cause wages to increase by up to 0.2 per cent due to increased spillovers. We expect population density in Australian cities to increase by 9 per cent by 2050 due to our reforms.
And this ignores the substantial welfare gains that many Australians would enjoy from accessing housing that better suits their needs.
4.4 More density would mean lower carbon emissions
Meeting Australia’s emissions-reduction goals would become easier if our cities became denser.
One study found that a 1 per cent increase in population density is associated with a 0.22-to-0.55 per cent decrease in emissions per person.188Castells-Quintana et al (2021). Another found that doubling population density could result in emissions being at least 42 per cent lower.189Gudipudi et al (2016). See also Ribeiro et al (2019), Lwasa et al (2022), and Glaeser and Kahn (2008). These estimates suggest that relaxing planning controls could reduce per capita greenhouse gas emissions by 2-to-5 per cent on today’s levels by 2050, beyond what would otherwise occur.190Grattan analysis of Castells-Quintana et al (2021). We expect population density in Australian cities to increase by 9 per cent by 2050 due to our reforms.
Greater density lowers emissions primarily because more compact cities mean shorter trips for residents, making it easier for people to switch from car use to low- or no-emissions modes of transport.191Deuskar (2021, Figure 6), Ahlfeldt and Pietrostefani (2019), and Ritchie (2019). One US study found that doubling the density of an urban area reduced vehicle use by half.192S. Lee and B. Lee (2020). This is particularly important given transport is Australia’s third-largest and fastest-growing source of emissions.193Rau et al (2024).
Allowing more people to live where they want can also lower household energy use, because it allows more people to live in cooler areas (such as Sydney’s east rather than west).194NSW Productivity Commission (2024, Section 2.4). And although the materials used to build denser forms of housing tend to embody more emissions, these emissions will almost certainly be outweighed by the emissions saved by having people living and working closer together.195NSW Productivity Commission (ibid, Section 2.7).
4.4.1 More density can lead to better quality of life
Urban density can enhance neighbourhood amenity and strengthen social fabric.196Putnam (2000, Chapter 12) argues that urban sprawl drives social segregation, reducing opportunities for individuals to make connections across social groups.
Several cities with similar populations as Australia’s capital cities but higher population densities – such as Vancouver, Toronto, and Vienna – tend to score highly on international quality-of-life measures, with Vienna typically outranking all major Australian cities and Vancouver and Toronto outperforming Brisbane and Perth.197NSW Productivity Commission (2023a, Figure 8).
There is no reason we cannot have more homes where people want to live, and protect green spaces and key heritage sites.198See NSW Productivity Commission (2024, Sections 2.2 and 2.3) for a summary of the literature. For instance, adding extra homes in the northern and eastern suburbs of Sydney would ensure that more residents could enjoy the abundant open spaces and other amenities in those suburbs.199NSW Productivity Commission (2023b, Figure 15). And allowing more people to live in established areas reduces pressure for land release at the urban fringe. This means fewer people living in areas at risk of floods and bushfires, lowering insurance premiums for homeowners, and reduced disaster mitigation and relief costs for governments.
Building more homes close to the centres of our major cities will add much less to congestion in our cities than if those new residents were pushed to the outer suburbs. Congestion costs per extra resident are up to seven times lower in areas closest to the city centre of Sydney.200For example, congestion costs for each extra resident (in terms of time lost) are lowest in the Sydney CBD, at around $10,000 per dwelling, compared to upwards of $60,000 for each extra resident in the outer western and northern suburbs of Sydney: NSW Productivity Commission (ibid, Figure 5). Similarly, train overcrowding is highest in the western and south-western suburbs of Sydney, and lowest in the northern and eastern suburbs.201NSW Productivity Commission (ibid, Figure 11).
Increased density can also encourage everyday interactions, and foster greater understanding between individuals from different backgrounds.202Civelli et al (2022). Development that integrates housing with shops and shared spaces provides more opportunities for casual encounters, helping residents build stronger local connections.203Sonta and Jiang (2023).
4.4.2 More density would reduce inequality
Allowing more homes where people want to live would reduce inequality by reducing housing costs for renters and first-home buyers. Empirical evidence overwhelmingly shows that in gentrifying areas where new construction takes place, rents remain lower than in equivalent gentrifying areas where new construction is blocked.204Pennington (2021). Building more apartments means households with different levels of income can enjoy the benefits of the same location. For example, more than 90 per cent of recently announced activity centres in Victoria (Chapter 5) are within the top 50 per cent of advantaged areas.205Based on the ABS index of relative socio-economic disadvantage. This analysis excludes the first 10 activity centres announced by the Victorian government. Epa (2025).
While townhouses and apartments in affluent areas are not necessarily cheap to buy or rent – since they are newly built – they are typically much cheaper than the existing freestanding homes that they replace, particularly in inner suburbs (Figure 4.2).
Figure 4.2: New units are cheaper than old detached houses in the same area
Median prices
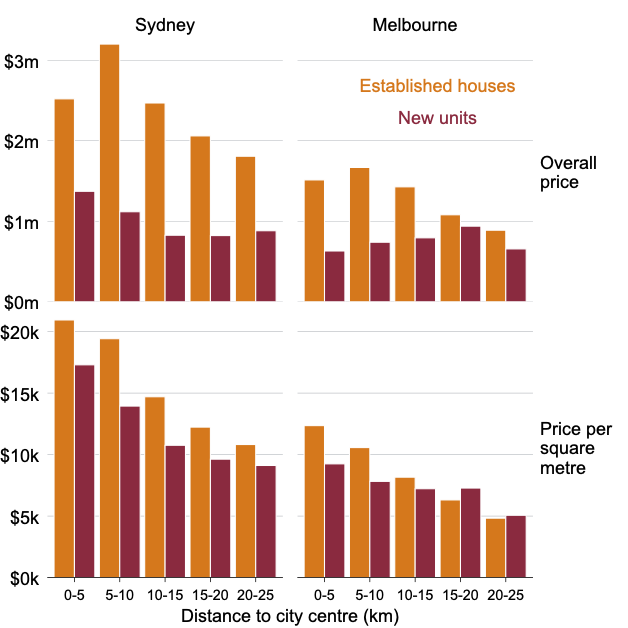
Notes: ‘New’ defined as properties built within the past five years. Units include townhouses and apartments.
Source: Grattan analysis of Cotality (2025) and ABS (2021b).
4.5 More density makes infrastructure cheaper for government
Building more homes in established areas will also lead to budget savings for state governments.
Outer suburban developments in Sydney cost $75,000 more per new home than the infill equivalent.206NSW Productivity Commission (2023a). In Victoria, infrastructure for each new home in a more dispersed city costs about $59,000 more than in a compact city.207Infrastructure Victoria (2023b, Figure 8).
Permitting more housing across large areas of our capital cities may place additional pressure on councils, state planning departments, and infrastructure authorities to service those homes with infrastructure. But the costs of permitting too little new housing in state and territory planning systems vastly exceed the costs of zoning for too much housing to meet demand.208Counsell (2025).
4.6 Allowing more density has public support
Opinion polling in NSW and Victoria shows support for recent planning reforms in those states.
For example, 57 per cent of Victorians back changes that would pave the way for more townhouses, and 42 per cent support the state government’s plan to permit higher-density housing near train and tram stations, compared to 37 per cent opposed and 21 per cent undecided.209Smethurst (2024). And opinion polls suggest the NSW reforms are popular, with 43 per cent of voters in support, and just 26 per cent opposed.210Smith (2024).
A national housing deliberation among 100 randomly-selected Australians, conducted by Amplify in February 2025, found that 94 per cent supported upzoning around train stations as a key measure to solve the housing crisis.211Amplify (2025a). Similarly, opinion polling in the lead-up to the federal government’s August 2025 Economic Reform Roundtable showed that increasing housing supply was the key public priority to lift productivity.212Amplify (2025b).
5 Recent reforms in NSW and Victoria don’t go far enough
The NSW and Victorian governments are making significant reforms to their planning systems to permit more housing. The NSW government’s Low- and Mid-Rise Housing policies and the Victorian government’s Townhouse and Low-Rise Code will permit more townhouses and low-rise apartments. NSW’s Transport Oriented Development Program and Victoria’s Activity Centre Program permit more mid- and high-density apartments around transport hubs. And both states have established new state-level approval pathways for major residential developments.
These reforms will boost zoned capacity by about 930,000 homes in Sydney (equivalent to 40 per cent of all existing homes) and about 1.6 million homes in Melbourne (70 per cent of existing homes). But both states’ reforms fall short of Auckland, which lifted zoned capacity by the equivalent of 100 per cent of all existing homes. And historically, no more than 1 per cent of extra zoned capacity is built as new housing each year, with only capacity that is commercially feasible – i.e. both permissible and profitable to develop – actually being built.
In both cities, we estimate that only around a third of capacity unlocked by recent reforms is commercially feasible. In Sydney, this is enhanced by the addition of an Infill Affordable Housing Bonus, which unlocks commercially feasible capacity for 150,000 additional homes. In Melbourne, where new units are more affordable, most of the additional commercially feasible capacity is due to the 420,000 homes unlocked by the Townhouse Code. In both cities, feasibility for low-to-mid-rise apartments remains challenging given rising construction costs.
Both state governments should go further. For example, allowing three-storey townhouses and units across all residential land in Sydney, as we recommend (and as is largely already permitted in Melbourne), would add capacity for more than 1 million commercially feasible new homes.
5.1 Assessing commercially feasible capacity is key to measuring the impact of planning reforms
State and local government housing capacity assessments have historically used zoned capacity to demonstrate that there is sufficient capacity to meet current and future housing demand.213E.g. see SGS Economics & Planning (2022). Yet much theoretical capacity for more housing is often unprofitable to build, especially for urban infill where any existing buildings on a site must be demolished.214Nolan (2024c).
In this chapter, we use the Grattan Model of Australian Planning Systems (GMAPS) to estimate the capacity of the NSW and Victorian planning systems to deliver infill housing in Sydney and Melbourne (Appendix B). It estimates the impact of planning changes on both:
- Zoned capacity: a measure of how many homes could be accommodated in an area if all sites were developed to their maximum extent possible given existing built-form controls.
- Commercially feasible capacity: a measure of how many homes could be profitably developed given the built-form controls in planning regimes, current land acquisition and construction costs, and home sale prices.
Both of these measures are important to policymakers, because they help to assess the quantity and location of new housing that can be built by the private market. But measuring the share of zoned capacity that is commercially feasible to build, as already required of councils in New Zealand, offers a better measure of whether planning systems can support enough housing to meet current and future demand.215See Fairgray (2023) for an example of assessing commercially feasible capacity for more housing in Auckland.
Studies of previous planning reforms suggest that no more than 1 per cent of extra zoned capacity is likely to translate into a boost to the flow of new housing construction in a given year.216See Section 3.2. But this rate varies greatly depending upon the intensity of the upzoning relative to existing property values and prevailing sale prices for new homes. For instance, one recent study of residential development in New York City over the past two decades showed that almost no sites that were unprofitable to redevelop after an upzoning were subsequently redeveloped.217Rollet (2025, Figure D.2).
The GMAPS assessments of commercially feasible capacity on a site-by-site basis thus provide a clearer indication of the likely rate of uptake of new housing capacity.218GMAPS provides a snapshot of what homes could be profitably built today. It does not estimate the interactions between capacity, supply, and market conditions over time. The greater the share of capacity that is feasible, the higher the likelihood that this capacity will be developed.
Much depends on the future trajectory of housing construction costs and home sale prices. For example, the number of commercially feasible homes unlocked in Melbourne by recent planning reforms doubles from 530,000 to 1.1 million should construction costs fall by 20 per cent, and rises from 490,000 to 780,000 homes in Sydney (Figure 5.5). And as more commercially feasible homes are built and housing becomes less scarce, this subsequently impacts land acquisition costs and expected sales prices, which then alters the commercial feasibility of the remaining opportunities.
Figure 5.1: Victoria’s Townhouse Code is the most ambitious of the reforms being made in Victoria and NSW
Estimated uplift from planning reforms
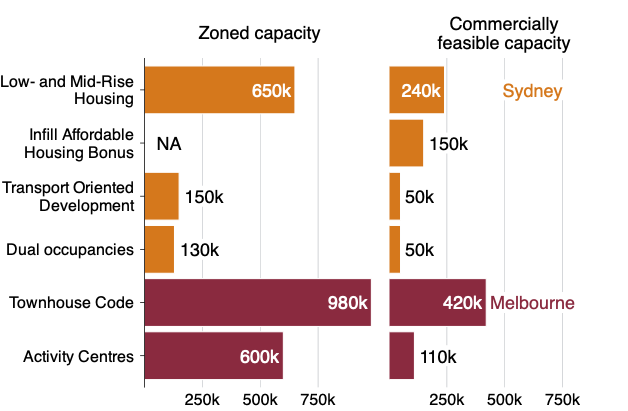
Note: Uplift from the Infill Affordable Housing Bonus not estimated on a zoned capacity basis, because the policy applies only to projects which include more than 10 per cent affordable housing. Uplift from Activity Centres includes both walkable catchments and higher-density cores. Uplift from the Transport Oriented Development policy includes active accelerated precincts. Does not include uplift from State Significant Rezonings in NSW or Priority Precincts in Victoria. Estimates are for GCCSAs, and assume site amalgamations in upzoned residential areas.
Source: See Appendix B for details on data and methodology.
5.2 Victoria’s Townhouse Code should lead to much more housing in Melbourne’s established suburbs
The Victorian government’s Townhouse and Low-Rise Code (i.e. the Victorian Townhouse Code) aims to increase what is permissible to build in low-density zones, and should make planning approvals more certain. It covers two-storey developments on land in the neighbourhood residential zone, and three storeys on land in the general residential zone and residential growth zone (among others) (Figure 5.2). The code sets standards – height, setbacks, site coverage, etc. – that are deemed-to-comply for two- and three-storey developments.219Broadly, two storeys maps to land zoned as Neighbourhood Residential (NRZ) and three to General Residential (GRZ). There are just over 500,000 NRZ sites in the Melbourne GCCSA and just over 1 million GRZ sites. Proposed developments that satisfy the code still require planning approval, but cannot be rejected by councils on the basis of built-form.
Figure 5.2: The NSW and Victorian governments are trying to make it easier to build homes in Sydney and Melbourne
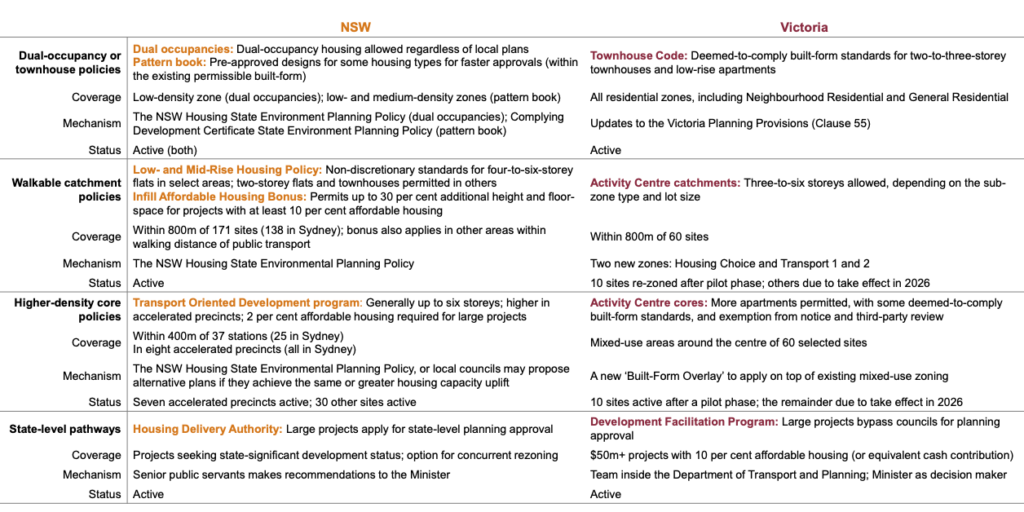
Notes: The Activity Centre cores had already been designated as ACs; what’s new is the higher densities and the catchments. The Transport Oriented Development accelerated precincts tend to have a higher height limits, as do some of the proposed alternative plans from councils. The Development Facilitation Program is older than most of the other reforms list (it started in 2020). There are other avenues to use the DFP (e.g. significant economic development and ‘Great Design’). The HDA is in addition to existing avenues for projects to receive state-significant status, including social and affordable housing, build-to-rent housing, seniors housing, and the TOD accelerated precincts: NSW Government (2025c).
Source: Grattan analysis of various Victorian and NSW planning documents.
We estimate the Townhouse Code has boosted zoned capacity in Melbourne by 980,000 homes, of which 420,000 are commercially feasible to build today (Figure 5.1).220This boost in zoned capacity of 980,000 homes is spread across 700,000 sites. Many sites are not profitable to develop since the reforms allow only a modest increase in what is permitted to be built on the site. These extra potential homes are mostly in Melbourne’s middle suburbs (Figure B.5 and Figure B.6), with those that are commercially feasible spread across 90,000 sites. Given residential properties in our capital cities typically turn over every 10 years, that implies that up to 9,000 sites that could be profitably redeveloped could hit the market each year.221Grattan analysis of Bandeira et al (2022). Larger and more expensive homes tend to turn over less frequently.
Figure 5.3: The boost to commercially feasible housing is largest in beachside councils in Sydney
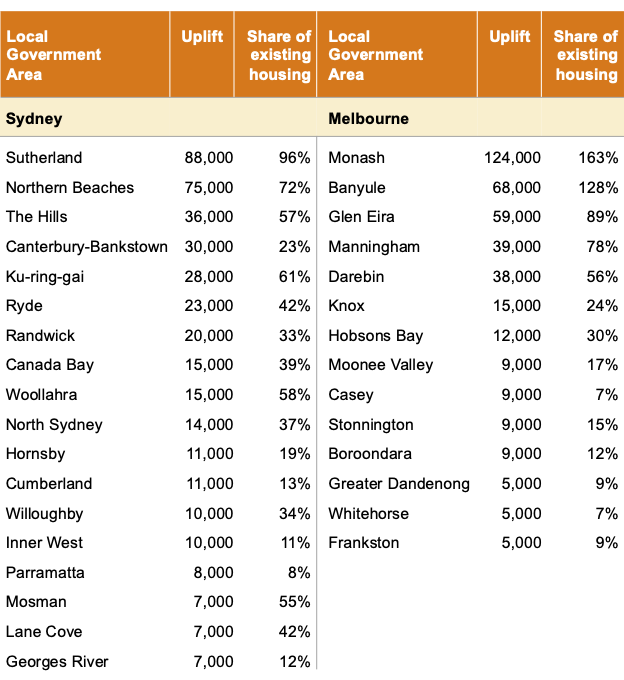
Note: See Appendix B for details on GMAPS methodology. Source: Grattan analysis of ABS (2022b) and GMAPS output.
5.3 The NSW government’s dual occupancy policy modestly increases what housing can be built in Sydney
The NSW government’s new dual occupancy policy allows two dwellings on a single lot and permits dual occupancies in most residential zones state-wide, with a standard minimum lot size of 450 square metres and 12 metres of street frontage in Low- and Mid-rise Housing areas.222With some exceptions – high aircraft noise areas, and bushfire- or flood-prone land, for example. See NSW Government (2025c, Clause 164).
Outside of these areas, eligibility for dual occupancy development is limited by minimum lot size controls included in Local Environmental Plans. While these vary, they can reach as high as 1,015 square metres in the Ku-ring-gai council area.223Minimum lot size requirements for R2 dual occupancies outside of LMRH areas were only finalised on 31 October 2025, and hence are not incorporated into the below analysis. See DPHI (2025f).
We estimate the dual occupancy policy will increase zoned capacity in Sydney by 130,000 homes, of which 50,000 are commercially feasible to build today. The NSW dual occupancy program is less impactful than Victoria’s Townhouse Code principally because it only allows for two homes on each lot (Figure 5.1). The floor-space ratios permitted in Low- and Mid-Rise Housing areas are also much lower than those implied for the Victorian Townhouse Code (Figure 5.4).224See NSW Government (2025c, s168).
Figure 5.4: Victoria’s planning reforms permit higher density than NSW’s
Maximum floor-space ratios (FSRs)
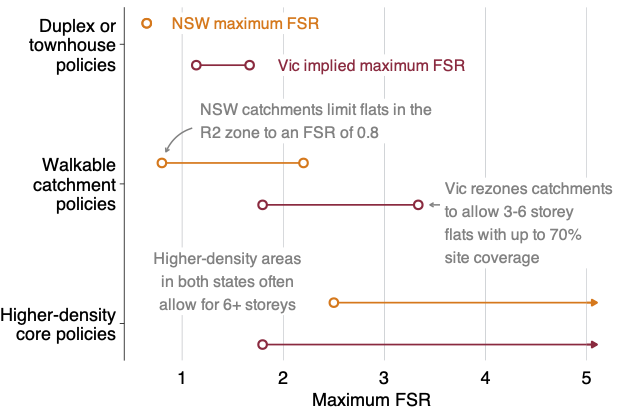
Notes: NSW floor-space ratio controls are as outlined in State Environmental Planning Policy legislation. Victoria does not directly regulate floor-space ratios in residential-zoned areas, so the figures for Victoria are implied maximums based on prevailing site coverage and height controls, assuming 95 per cent conversion from site coverage to internal floor area. In addition, floor area is reduced by 10 per cent to account for areas not counted toward floor-space ratios in NSW, and reduced by a further 15 per cent above three storeys to account for upper-level set-backs. Actual maximum floor-space ratios may vary from site to site depending on a range of other planning controls.
Source: Grattan analysis of various NSW and Victorian planning policies.
5.4 Both states lift zoned capacity for housing around transit hubs, but little can be profitably built in Melbourne
The NSW and Victorian governments are upzoning land around key transit hubs and some other high-demand locations – increasing the height of what can be built in these areas.
Figure 5.5: Lower construction costs would increase the impact of planning reforms
Uplift in commercially feasible capacity from recent planning reforms
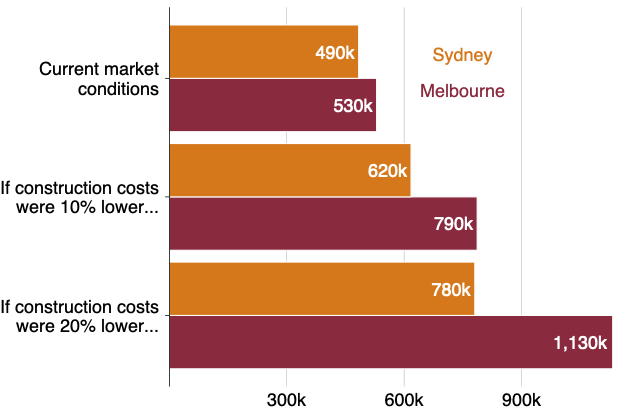
Note: Cost scenarios estimated by reducing costs associated with construction by the specified amount, while holding constant other development costs such as land acquisition and financing.
Source: See Appendix B for details on methodology.
5.4.1 The Victorian Activity Centre Program will lift zoned capacity, but few new homes are commercially feasible
The Victorian government’s Activity Centre Program permits more higher-density apartments around key transport hubs. The government has announced all 60 precincts under the Activity Centre Program, but only the first 10 are active,225Broadmeadows, Camberwell Junction, Chadstone, Epping, Frankston, Moorabbin, Niddrie (Keilor Road), North Essendon, Preston (High Street), and Ringwood. See DTP (2025f). with the government now consulting on the next 25 draft maps.226DTP (2025g). All 60 precincts are expected to take effect by the end of 2026 (Figure 5.2).
In the ‘core’ of each centre, high density will be permitted, with the exact maximum heights varying site-by-site.227For example, by 8-to-16 storeys in the draft plan for Hawthorn: DTP (ibid). In the remainder of each activity centre – the walkable catchment areas – more modest density will be permitted via two new zones: the Housing Choice and Transport Zone 1 (HCTZ1), which typically permits four-to-six storeys, and the Housing Choice and Transport Zone 2 (HCTZ2), which permits three-to-four storeys).
We estimate the Activity Centre Program, once fully implemented, could boost zoned capacity in Melbourne by 600,000 homes. But only 110,000 of these extra homes would be commercially feasible to build today (Figure 5.1). This reflects, in large part, the lower prices for apartments in Melbourne compared to other states, and the sharp rise in apartment construction costs nationwide.228Charter Keck Kramer (2025). For example, should apartment construction costs fall by 10 per cent relative to apartment sales prices, a further 100,000 of those homes within Activity Centre catchments would become commercially feasible to build.
The Activity Centre Program is also hampered by the requirement for sites to be ‘large’ to make full use of the increase in permissibility. Only about 5 per cent of sites to be rezoned to the Housing Choice and Transport Zones meet these requirements.229The ‘large lot’ requirement is 1000sqm with a frontage of at least 20m.
While adjacent homeowners can coordinate to sell sites for amalgamation, this is a slow, uncertain, and potentially expensive process. We estimate that of the 110,000-home uplift in commercially feasible capacity brought about by the Activity Centre program, 70,000 would require amalgamation (see Figure B.2). Removing lot size and frontage requirements – and thus reducing the number of amalgamations required for development – would increase the speed at which this capacity is taken up.
Additional capacity could be brought forward by increasing height limits across the outer areas of the Activity Centre catchments – those zoned HCTZ2 – to six storeys. We estimate that this reform would increase the zoned capacity in Activity Centres by 100,000 dwellings.
5.4.2 The NSW government’s programs for higher density are positive steps, but are hampered by other controls
The NSW government is permitting medium- and higher-density units and apartments in many high-demand locations via the Transport Orientated Development (TOD) Program and the Low- and Mid-Rise Housing Policy. These reforms are further progressed than Victoria’s. New planning controls already apply to 37 of 45 precincts under the TOD Program, and the Low- and Mid-Rise Housing Policy is already live across NSW (Figure 5.2).
The NSW government has allowed affected councils to produce a plan that provides equal or greater zoned capacity than the standard TOD controls. The impacts of these plans are mixed. While some councils – such as Inner West – have endorsed more ambitious plans, other plans could result in less well-located areas being zoned for higher densities.230See Inner West Council (2025b), but also Sydney YIMBY (2024).
The TOD heights are generous, at 22 metres for apartments and 24 metres (roughly six storeys) for mixed-used developments.231There is also a minimum lot width of 21 metres and active street frontage requirements. But the maximum floor-space ratio of 2.5 is low, and has been reduced from 3 since the policy’s announcement, reducing the number of new homes these sites can accommodate.232The government argued this was necessary for the floor-space ratio to be consistent with the other controls: DPHI (2025g, p. 7).
Where a TOD site is in a heritage conservation area, proposals will continue to be assessed by councils to ensure they are ‘appropriate for the context’.233DPHI (2024b, p. 10). This will further limit the impact of the TOD policy. We estimate that the TOD program has boosted zoned capacity by about 150,000 homes and commercially feasible capacity by about 50,000 homes across Sydney (Figure 5.1).234Only counts sites in the Sydney GCCSA. Includes finalised Accelerated TOD precincts.
The Low- and Mid-Rise Housing Policy is hampered by restrictive zones and maximum floor-space ratios
The Low- and Mid-Rise Housing Policy relaxes planning controls within 800 meters walking distance of 171 sites in NSW (including 138 in Sydney), allowing up to six-storey apartment developments within the first 400 metres, and up to four-storeys in other areas (Figure 5.2). In total, it covers 9 per cent of residential land in Sydney.235Grattan analysis of DPHI (2025a) and Propcode (2025). Measured as residential land in the GCCSA, excluding that zoned for greenfield expansion.
The policy creates a set of ‘non-discretionary’ standards – i.e. if the standard is met, that aspect of a proposal cannot be used as grounds for councils to refuse the development application. There are different sets of standards – heights, floor-space ratios, lot size and width, car parking, etc – for different housing types (e.g. dual occupancy, multi-dwelling, and apartments).236‘Multi-dwelling housing’ refers to three or more dwellings on a lot, other than an apartment building. There are different standards for different types of multi-dwelling (e.g. terraces, which involves three or more dwellings on a site which is then subdivided). The apartments standards are further broken down by ‘residential flat buildings’, and ‘shop-top’ housing (apartments in a mixed-use development), and then LMR inner (within 400 metres) and LMR outer (400 to 800 metres) areas. There are no lot size or width standards for apartments in zones R3 or R4.
We estimate that the Low- and Mid-Rise Housing Policy will boost zoned capacity in Sydney by 650,000 homes, of which 240,000 are commercially feasible to build (Figure 5.1). Typically, either three-storey townhouses or taller apartment buildings are most feasible to build in these locations (Figure 5.7).
But several design choices interact to limit the policy’s impact (Figure 5.6).
Figure 5.6: NSW’s Low- and Mid-Rise Housing Policy could be extended in a number of ways
Uplift in commercially feasible capacity for new housing
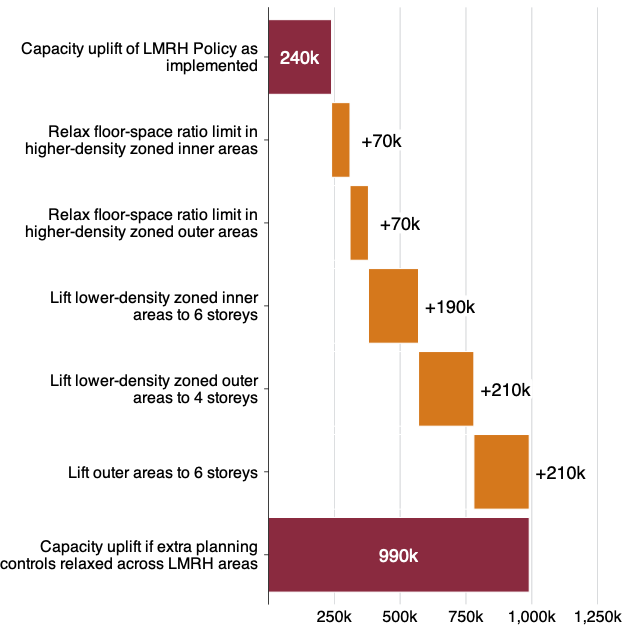
Notes: Only includes areas within the Sydney GCCSA. Capacity uplift excludes uplift from the Infill Affordable Housing Bonus in LMRH areas.
Source: Grattan analysis. See Appendix B for details on methodology.
First, restrictive maximum floor-space ratios of 1.5-to-2.2 apply to areas that have otherwise been rezoned to allow four, five, or six storeys, restricting the number of new homes that can be accommodated,237NSW Government (2025c, Chapter 6). These controls were reduced from 2-to-3 floor-space ratios that were initially proposed for the policy DPHI (2023b, p. 26). and reducing the number of sites that are commercially feasible to redevelop.238Only 20,000 sites in Sydney covered by the policy are commercially feasible to develop, out of a total of 90,000 sites. If these floor-space ratios were removed, and built-form was instead regulated through reasonable setbacks and site coverage ratios, we estimate an uplift in commercially feasible capacity of up to 140,000 homes.239Assumes site coverages of up to 55 per cent in R1 and R2 areas, and up to 65 per cent in R3 and R4 areas. For further modelling assumptions see Appendix B.
Second, the reform makes only minimal changes to areas where councils have previously applied the lower-density R1 and R2 zones. In these zones, which make up about 77 per cent of LMRH areas, new apartments are limited to just two storeys, with a maximum floor-space ratio of 0.8 (Figure 5.4). If apartments in these areas were subject to the same four- or six-storey height limits that apply to higher-density zones, we estimate that commercially feasible capacity would rise by up to 400,000 dwellings.
And if the NSW government applied a six-storey height limit to ‘outer’ areas, between 400 and 800 metres from local centres, it would lift the number of commercially feasible homes by a further 210,000 dwellings. A key issue these changes would overcome is that four-storey apartments in particular face material feasibility challenges (Box 5).
Lastly, the NSW government could further improve take-up of the policy by expanding access to the Complying Development Code approval pathway,240Currently dual occupancies enabled by the policy can only access the Complying Development Code pathway if the council’s plan allows them. and better mapping LMRH areas.241Areas covered by the Low- and Mid-Rise Housing Policy are not fully mapped by the relevant State Environment Planning Policy. Applicants are required to demonstrate that their proposal falls within the walkable area themselves: NSW Government (2025c, p. 170).
Updated affordable housing bonuses could also deliver more homes
In December 2023, the NSW government introduced new affordable housing bonuses for developments close to public transport. Proposals can receive up to 30 per cent bonus height or floor-space ratio if at least 10 per cent of the gross floor area is dedicated to affordable housing (committed for at least 15 years).242NSW Government (ibid, Chapter 2).
The scheme should boost the commercial feasibility of some projects, where the benefits of extra floorspace outweigh the costs of providing affordable housing. We estimate it has increased the stock of commercially feasible capacity in Sydney by 150,000 homes, spread across the Transport Orientated Development Program areas, Low and Mid-Rise Housing areas, and other ‘accessible areas’ (Figure 5.1).243This estimate is sensitive to the assumed costs of providing affordable housing, which vary substantially depending on location. We modelled ‘accessible areas’ near train and light rail stations (but not near bus stops) as per NSW Government (ibid, p. 101), but those near bus stops are not included.
The State Significant Rezoning Policy will also help
In September 2024, the NSW government established the State Significant Rezoning Policy. It enables both state-led and state-assessed rezoning proposals. The former involves the Department identifying sites suitable for upzoning, and managing the process end to end, while the latter are prepared by a proponent.244DPHI (2024c).
To July 2025, the policy had progressed 24 sites with zoned capacity for 43,000 homes, with several further sites under investigation.245Gibson (2025).
5.5 State-level approval pathways will help deliver more well-located housing
NSW and Victoria have both set up state-level approval pathways for large projects. These pathways can bypass local councils.
Victoria’s Development Facilitation Program offers a pathway for large projects to be granted approval by the Planning Minister.246The Minister can also waive or vary controls that might otherwise stop a proposal, and the Minister’s decisions cannot be appealed at VCAT. It was initially set up for major non-residential projects and then expanded in 2023 with the release of the Housing Statement to streamline significant residential development. Three types of developments are eligible, but the most important is projects costing at least $50 million that meet affordable housing requirements.247Selling 10 per cent at a discount to an affordable housing provider, gifting 3 per cent, or making a 3 per cent contribution to the Social Housing Growth Fund. The threshold is $15 million in regional Victoria. See Victorian Government (2025, Clauses 53.22, 53.23, and 53.25). Projects must also secure endorsement from Invest Victoria that they have the capacity to secure financing.
Since the program was expanded to residential projects, it has approved 50 significant developments constituting more than 6,900 dwellings. Wait times have averaged 133 days – far less than comparable-sized projects going through standard council processes (Figure 2.6).248A further 5,700 potential new homes have been facilitated via planning scheme amendments: DTP data provided to us on request.
In NSW, the Housing Delivery Authority was set up in early 2025. It is a group of senior public servants that evaluates applications and makes recommendations to the Minister as to whether they should be declared state-significant developments (SSDs).249The criteria relate to project size and expected dwelling yield, likelihood of quick and uncomplicated commencement, and contribution to the affordable housing stock. See DPHI (2024d).
To September 2025, after eight months of operation, 261 projects had received SSD status. These projects constitute 91,100 potential new dwellings.250DPHI (2025h). About 81 per cent of applications have taken up the option to pitch for a concurrent rezoning.251If a proposal exceeds applicable development standards by more than 20 per cent, it can be lodged along with a rezoning proposal. See DPHI (2024d). Of the new homes in the pipeline, 86 per cent stem from these applications. Of the total potential new homes in Sydney given SSD status via the Housing Delivery Authority, 54 per cent are within 15km of the Sydney CBD.252Applications to August 2025. Excludes applications further than 50km from the Sydney CBD or applications that specify multiple sites across different suburbs: Grattan analysis of NSW government data provided to us on request.
This suggests the Housing Delivery Authority offers a potential circuit breaker to the thicket of restrictions and council opposition that stop new homes in well-located areas in Sydney.
But it remains to be seen how well receiving SSD status translates to final approvals, and ultimately new homes built. And in the longer term, the authority is not a substitute for broader reforms to increase the permissibility for new housing on well-located land across Sydney. In particular, it cannot facilitate the kind of low-rise density now permitted across much of Melbourne by the Victoria’s Townhouse and Low-Rise Code.
Box 5: Townhouses and taller apartment buildings are more commercially feasible to build in LMRH areas than mid-rise apartments
While neighbours and urban planners often prefer low- and mid-rise apartments for urban infill, the commercial realities of building new homes often demand higher densities to make projects commercially feasible, especially following sharp increases in construction costs since the pandemic (Chapter 1).
If all housing types were permitted in all Low- and Mid-Rise Housing areas in Sydney, typically either three-storey townhouses or apartment buildings of six or more storeys would currently be most feasible to build (Figure 5.7). Whereas comparatively few four- or five-storey apartment buildings could be profitably built in these areas.
While construction costs typically rise with each extra floor added to an apartment building, taller apartment buildings are often more commercially feasible to build because the costs of acquiring a site can be defrayed across more homes.aFor example, Jenner and Tulip (2020, Figure 7) show that the cost of each dwelling in an apartment building initially falls with each additional storey that is added, as the cost of the land is defrayed across more apartments. Whereas apartment buildings of four or five storeys often do not contain enough homes to cover land costs or largely-fixed construction costs such as lifts or basement car-parking.
Similarly, townhouses are often cheaper to build than small apartment buildings, especially because a garage is cheaper than a basement car-park.bFor instance, we estimate that an apartment in a four-storey building in Sydney costs $770,000 to build (excluding land acquisition costs and developer margins), compared to $680,000 for a three-storey townhouse, even when the latter is 1.5 times larger. But whereas three-storey townhouses would be profitable to build on more than 43 per cent of LMRH sites if allowed everywhere, two-storey townhouses would be profitable on just 21 per cent of sites (Figure 5.7). This reflects the high fixed costs from acquiring sites, including demolishing any existing home. Those costs can be justified only if more floor area can replace the existing home.
Figure 5.7: Mid-rise flats would be profitable on only a small share of Low- and Mid-Rise Housing sites
Share of LMRH sites where development is commercially feasible, by project height
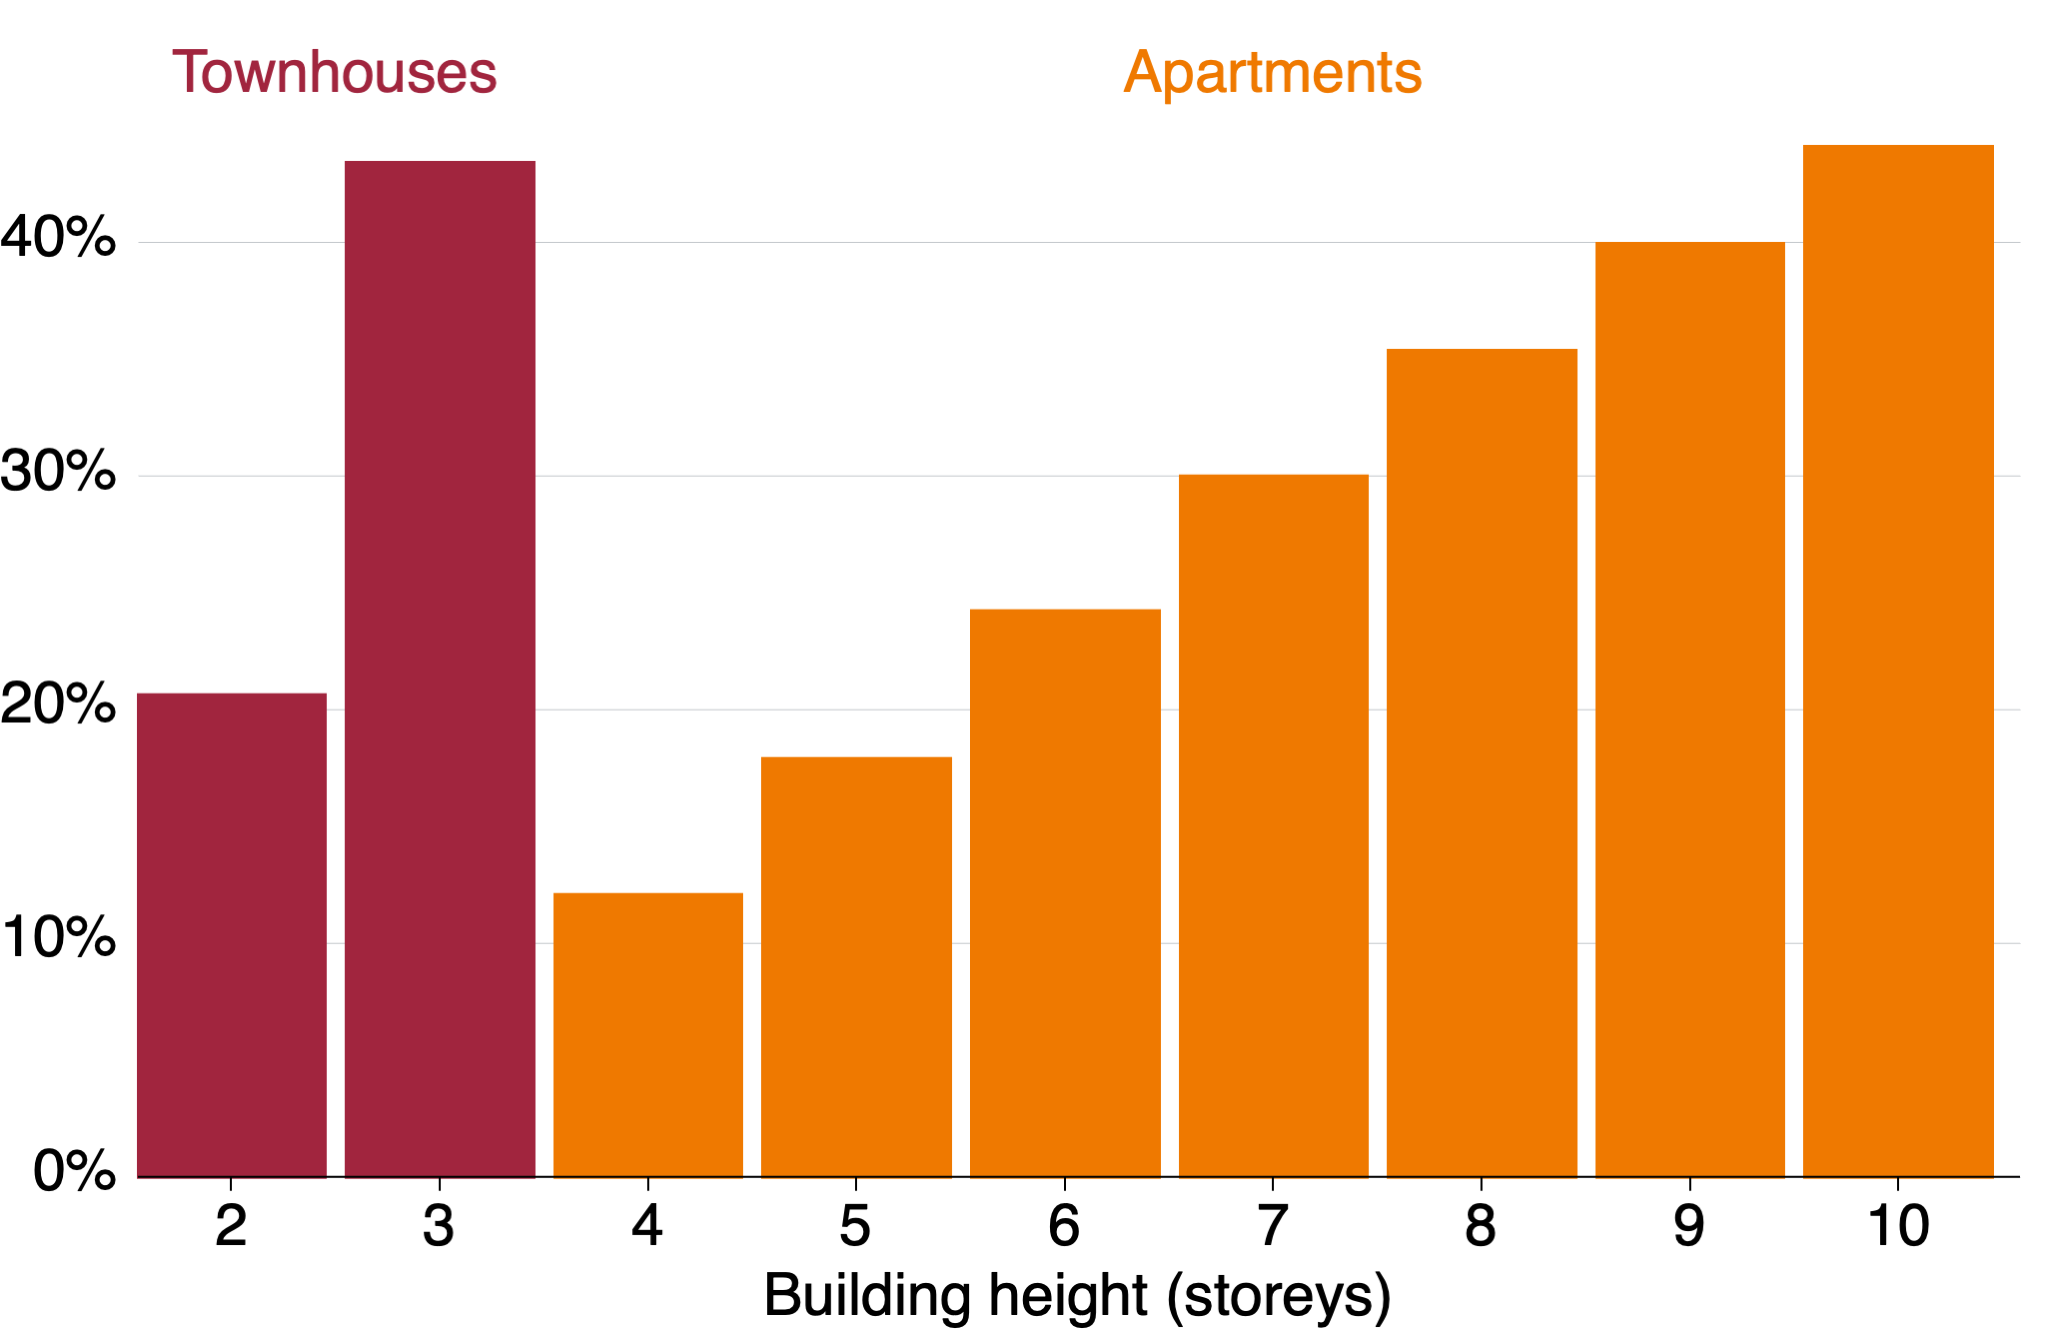
Notes: Estimates show share of projects that would be commercially feasible if development at the specified intensity was permitted on each site, in the absence of other LMRH planning controls. Assumes site coverage of 50 per cent, with additional set-backs above three storeys.
Source: Grattan analysis. See Appendix B for details on methodology and data.
5.6 NSW and Victoria should go further to allow more housing in Sydney and Melbourne
These recent reforms in NSW and Victoria are positive steps to getting more housing built in well-located areas of our major cities.
We estimate these reforms boost zoned capacity by 1.6 million homes in Melbourne (equivalent to 70 per cent of all existing homes) and 930,000 homes in Sydney (40 per cent of existing homes). And this doesn’t include the full impact of additional reforms such as the Housing Development Authority in NSW and the Development Facilitation Program in Victoria.253A sizeable portion of prospective new homes designed as state-significant developments by the NSW Housing Delivery Authority are likely to be in areas that have already been upzoned via the Low- and Mid-Rise Housing Policy or the Transport Oriented Development Program, or have already benefited from a density uplift via the updated in-fill affordable housing bonuses.
Experience from New Zealand and the US shows that only a small proportion – probably less than 1 per cent – of any additional zoned capacity is likely to be taken up in any one year.254See Section 3.2. This suggests these reforms could increase housing supply by between 11,000 and 16,000 extra homes each year in Melbourne, and by between 7,000 and 9,000 extra homes each year in Sydney.
But in practice, homes that are not commercially feasible to build will not get built. Only one third of the extra zoned capacity in either city is commercially feasible to build today, so the flow of extra new housing each year arising from these reforms will also depend on market conditions, and especially the outlook for construction costs and home prices.
The reforms of both state governments are smaller than those recently introduced in New Zealand. Auckland’s planning laws in 2016 unlocked zoned capacity equivalent to the 100 per cent of the existing housing stock.255New Zealand Infrastructure Commission (2022, Table 11). In the context of Sydney and Melbourne, this would be equivalent to a zoned capacity increase of more than 2 million homes.256Grattan analysis of ABS (2022b).
More broadly, neither state government has done enough to ensure planning controls are not an unreasonable constraint on the housing choices of residents. There remain many areas where higher-density housing is both in demand and commercially feasible to supply, but remains illegal to build (see Section 2.5).
NSW and Victoria – and the other states and the territories – should go further to allow more housing where people most want to live (see Figure 5.9).
5.7 Further relaxing planning controls would unlock substantially more housing, particularly in Sydney
We estimate that if the NSW government allowed three-storey townhouses and flats across all residential-zoned land, more than 1 million extra homes would become commercially feasible to build (Figure 5.8).
Figure 5.8: Allowing three-storey townhouses across Sydney would substantially add to commercially feasible capacity
Estimated commercially feasible capacity in lower-density zoned areas
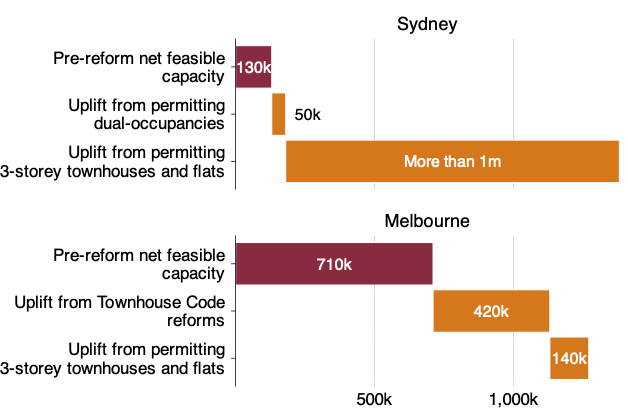
Note: Lower-density zoned areas include the R1 and R2 zones in Sydney, and the NRZ and GRZ zones in Melbourne.
Source: Grattan analysis. See Appendix A for full details.
This reflects the immense unmet demand for more housing in Sydney’s established suburbs, the low permissibility base Sydney is coming from (Section 2.2.1), and the large number of sites that could accommodate extra density. There are 760,000 sites in Sydney that are larger than 500 square meters and zoned R1-R3, including 270,000 sites within 20km of the CBD.257Grattan analysis of DPHI (2025a).
The same reform in Melbourne would have a more modest impact. This largely reflects the fact that the Victorian government’s Townhouse Code already unlocks a lot of these benefits, and three storeys are already allowed on a material share of Melbourne’s residential land via the General Residential Zone (Figure 2.2).
5.7.1 Existing programs that upzone near transport should be improved and expanded
NSW and Victoria should build on existing programs that allow for more housing near public transport, by ensuring that they permit at least six storeys across walkable catchment areas. In the case of NSW’s Low- and Mid-Rise Housing Policy, such a change would create commercially feasible capacity for an additional 750,000 dwellings (see Figure 5.6).
Both states should also extend these programs to additional well-located public transport stops. Even under existing planning controls, every additional Low- and Mid-Rise Housing area could be expected to add zoned capacity for about 4,700 new homes, and each new Activity Centre could be expected to add capacity for about 10,000 new homes.258Calculated based upon the average zoned capacity uplift across 138 Low- and Mid-Rise Housing areas and 60 Activity Centres.
5.7.2 Allowing higher-density housing in high-demand areas would make more homes commercially feasible to build
There is also substantial opportunity for NSW and Victoria to further upzone in high-demand areas.
For instance, upzoning the 20 suburbs in each of Sydney and Melbourne with the highest prevailing apartment prices to at least 12 storeys would unlock zoned capacity for more than 950,000 new homes in each city.259Estimates are based on identifying about 30,000 residentially-zoned lots in the 20 SA2s in each of Sydney and Melbourne with the highest new-build apartment prices, which are currently zoned for less than 12 storeys, and which could permit higher-density given prevailing heritage and lot-size constraints. For full details of methodology and data, see Appendix B. This would include capacity for thousands of additional homes in suburbs such as Vaucluse, Bondi Beach, and Mosman in Sydney, and South Melbourne, Hampton, and Abbotsford in Melbourne.
More than three quarters of this additional capacity is currently commercially feasible in Sydney, while only about 10 per cent is currently feasible in Melbourne. However, this would rise to about 50 per cent in Melbourne if construction costs were to fall by 10 per cent.
Figure 5.9: NSW and Victoria need to go further to allow more housing in Sydney and Melbourne
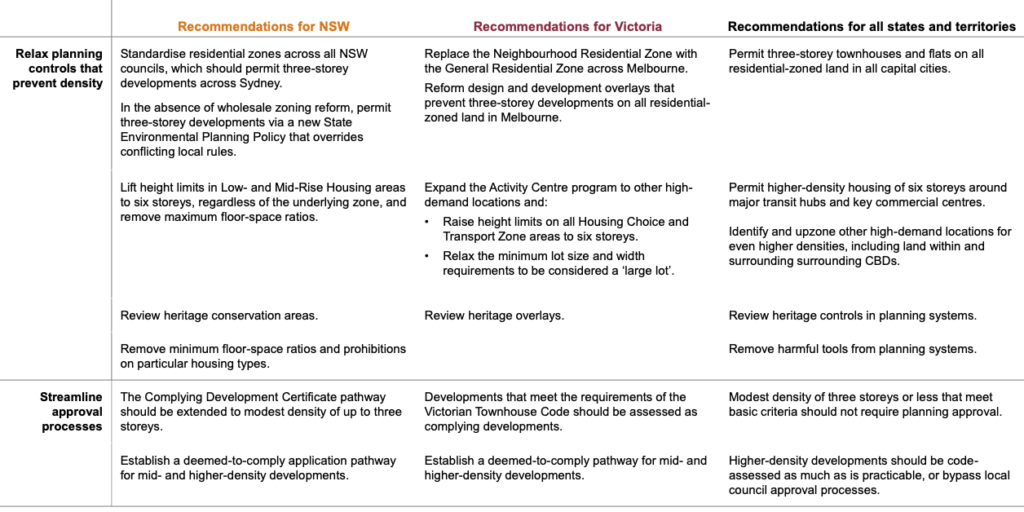
Note: Recommendations for all states and territories as outlined in Chapter 3. Source: Grattan analysis.
6 What the federal government should do
The federal government should sharpen the incentives for state governments to allow more housing to be built in good locations. Coordinating action by the states is worthwhile because increased housing supply in one state spills over into lower housing prices in other states. And land-use planning policies are among the biggest policy levers to boost economic growth.
The federal and state governments have committed to building 1.2 million homes over five years, backed by $3.5 billion in federal incentives for states to actually deliver the extra homes. But these incentives aren’t working. Sharp jumps in interest rates and the cost of construction have weighed on housing construction, leaving the states well short of qualifying for the payments, even if they make substantial reforms to get more housing built. This shows the limits in tying financial incentives for state governments to the flow of new housing built each year.
The National Competition Policy should be extended to residential land-use reform. The federal government should reward state governments that adopt specific reforms to land-use planning controls, including the Low-Rise and Mid-Rise Housing Standards outlined in Chapter 3. Paying state governments for specific, ambitious, and verifiable reforms is the best way the federal government can spur the states into action.
The federal government should ask the Productivity Commission to regularly assess the performance of state planning systems, including whether planning systems facilitate sufficient commercially feasible capacity to meet expected future demand. This should inform federal government actions to accelerate housing construction, and the design of further federal incentives to push state governments to do the same.
6.1 The federal government should push the states to relax land-use planning controls
Federal government intervention to push the states to relax land-use planning controls is justified on several grounds.260For simplicity, in this chapter we use ‘state’ to mean ‘state and territory’.
First, reforming land-use planning controls is among the the biggest policy levers to boost economic growth while also improving housing affordability. As shown in Chapter 2, state planning regimes increase the costs of housing by making it scarce, and they reduce the incomes of Australians, because they mean fewer Australians can live near high-paying jobs. In Chapter 4, we estimated that reforming land-use planning controls in the way we propose could boost Australia’s GDP by up to $25 billion a year (in today’s dollars) by 2050.
Second, the federal government would collect most of the extra tax revenue from the larger economy that would result from making housing more abundant.261The federal government collects three in every five tax dollars in Australia, excluding the GST which is redistributed to the states: Coates (2022b). The $25 billion annual boost to Australia’s GDP from reforming land-use planning reforms could translate to up to an extra $5 billion a year in tax revenue for the federal government, of which roughly $1 billion could flow back to the states via the GST,262Based on federal government receipts of 23.5 per cent of GDP: Australian Government (2025, Tables 3.1 and 4.5). as well as a reduction in payments for Commonwealth Rent Assistance.
Third, coordinating action by the states is worthwhile because increased housing supply in one state spills over into lower housing prices in other states. Australia’s housing markets are interconnected. If, for example, only the Victorian government substantially boosts housing supply, any improvement in affordability will be dispersed across Australia as residents of other states (and newly-arrived migrants) move to Victoria, attracted by lower house prices relative to other states.263For example, Productivity Commission modelling estimates that a 10 per cent differential in house prices between two regions increases migration between them by 1.8 per cent: Productivity Commission (2014, Table E.6). The federal government can help solve this coordination problem.264Daley et al (2018, p. 129).
Finally, the federal government will inevitably be held accountable for the collective success (or failure) of state governments to reform planning controls, since the federal government is largely held responsible by the public for housing affordability.
6.2 The New Homes Bonus is not working
The federal government is offering state governments $3.5 billion in incentives, including $15,000 per home via the New Homes Bonus, to build 1.2 million homes over five years.265Under the New Homes Bonus, states are to be paid $15,000 for each home built in each state above their share of the first 1 million over the five years, up to a maximum of $3 billion for 200,000 extra homes: Albanese (2023).
An ambitious target is important in focusing attention on the problem of our national housing shortfall, and building momentum for change.266Past Grattan Institute work showed that if the 1.2 million home target was sustained for a full decade, rents could fall by 8 per cent, saving renters $32 billion over those 10 years: Sathanapally et al (2025, p. 54). But the post-COVID downturn in housing construction, caused by a sharp jump in interest rates and the cost of construction materials and labour, mean the target is unlikely to be met. There were only 188,000 new housing approvals in the year to August 2025.267Grattan analysis of ABS (2025f). The National Housing Supply and Affordability Council expects net new housing supply to total just 938,000 homes over the five years to 2028-29. Only Victoria is on track to exceed the baseline and receive any payments.268NHSAC (2025, Table 5.1).
This points to the limits of paying paying state governments for an outcome – the rate of new housing construction each year – which they do not fully control. The preceding chapters show that relaxing state land-use planning controls would lead to substantially more new housing being built each year on average (Section 4.1). But housing construction is highly cyclical.
For example, changes in interest rates materially affect the flow of new housing,269For example, every 1 per cent rise in real interest rates lowers housing approvals the following year by 7 per cent. as do construction and labour costs, which are driven in part by global and national economic conditions. Over a decade or more, these cyclical factors would wash out. But an incentive scheme covering such a long period is inconsistent with the length of parliamentary terms.
Yet the New Homes Bonus could be made more potent by bringing it forward to be paid in installments, subject to progress towards meeting a recalibrated baseline, rather than it being paid at the end of the five-year period.270The baseline housing targets for states at which the New Homes Bonus becomes payable could be adjusted to better align them with cyclical housing conditions. Any discrepancies between annual pre-payments made to states, and states’ final performance over the five-year period, could be reconciled via the annual GST distribution from the federal government to the states. See: Sathanapally et al (2025, p. 54).
But more importantly, the federal government should focus on rewarding state governments for specific reforms that are expected to lift housing construction over time and which are entirely within their control.
6.3 The federal government should reward specific reforms that relax residential land-use controls
The federal government should reward state governments that enact specific, ambitious, and verifiable reforms that relax residential land-use planning controls to allow more housing to be built.
Specifically, the federal government should reward states that adopt the Low-Rise and Mid-Rise Housing Standards we recommend in Chapter 3. These reforms would tackle two problems outlined in Chapter 2: that existing planning controls are too restrictive; and that development approval processes are costly, slow, and uncertain.
There’s plenty of precedent for the federal government helping to pay for specific, verifiable economic reforms. Under the National Competition Policy, the Commonwealth paid the states almost $6 billion over 10 years in exchange for much-needed regulatory and competition reform. The Productivity Commission later concluded this reform boosted Australians’ incomes by 2.5 per cent.271Productivity Commission (2005). A core principle of the policy is that it’s better to pay for specific changes to law or regulation that offer an economic payoff, rather than simply rewarding states that boosted GDP per capita year-to-year. This approach takes inspiration from New Zealand’s federal government, which led a widespread relaxation of land-use planning controls across NZ’s largest cities (Box 4).
These payments should be made to the states by extending the National Competition Policy to cover reforms to residential land-use planning rules.272Alternatively, payments could be made via a separate Federal Financial Agreement on housing between federal and state governments. The National Competition Council should monitor whether states have enacted these reforms.
State governments could be offered a menu of options that reflect different levels of ambition towards meeting the new Standards, with lower payments offered for less ambitious reforms. For example, states that adopt a variation of the Low-Rise Housing Standard that permits only two-storey developments (rather than three) in all residential zones could be paid a lower amount than states that adopt that standard in full. Similarly, states could be offered the opportunity to adopt a less ambitious version of the Mid-Rise Housing Standard that requires only four storeys around transit hubs, rather than six storeys.
And state governments that have already made meaningful reforms to relax planning controls to allow more housing, such as the NSW and Victorian governments, should be rewarded with a top-up payment in recognition of those reforms, subject to agreeing to further reforms outlined in Chapter 5.273South Australia has recently undertaken reforms to centralise and digitise its planning system, and streamline approval pathways, although the focus of these reforms was administrative efficiency not an increase in the level of housing permitted (Figure 2.1).
The payments could be set based on the boost to GDP, and federal government tax revenues, that is expected from the reforms. Alternatively, payments could be benchmarked to the increase in commercially feasible capacity for new housing.274State governments have more control over commercially feasible capacity for housing than they do the flow of new housing built each year. The precise quantum offered to each state for adopting specific standards should be informed by more detailed analysis by government.
Given that most states appear unlikely to qualify for the full $3 billion on offer via the New Homes Bonus within the five-year window of the Housing Accord, payments for planning reforms under the National Competition Policy could be funded by reallocating $1.5 billion from the New Homes Bonus to National Competition Policy.
The federal government could, in time, offer incentive payments to state governments that reform car-parking requirements, apartment design controls, and heritage policies in ways that makes more housing commercially feasible to build.
6.4 The Productivity Commission should regularly evaluate the performance of state land-use planning regimes
Federal government action to boost housing supply is hampered by a lack of research and analytical capacity on the barriers to building more homes. The federally-funded Australian Housing and Urban Research Institute (AHURI) has historically focused on the provision of social and affordable housing, rather than barriers to more market housing.275For example, in a keyword search of 268 AHURI research papers published between May 2011 and April 2025, ‘social housing’ appeared 44 times, ‘homelessness’ 28 times, and ‘affordable housing’ 24 times, but ‘housing supply’ appeared just seven times and ‘planning’ just six.
The Productivity Commission should publish annual statements assessing the permissiveness of state planning regimes.276The Productivity Commission already publishes annual Trade and Assistance reviews. Those assessments should track whether planning controls add to the cost of homes (as shown in Section 2.5).277Nolan (2024c). See also Valiente et al (2024) for a discussion of potential indicators to evaluate restrictions on urban land supply. And the Productivity Commission should assess whether state planning regimes allow for sufficient commercially feasible capacity to meet 30 years of expected demand for housing.278See Box 4 for details of how similar requirements are being applied in New Zealand. For an example of such an assessment of feasible capacity, see Fairgray (2023).
The Productivity Commission should also regularly advise the federal government on other policy reforms that would boost commercially feasible housing capacity, including:
- Further changes to land-use planning controls.
- Relaxing minimum car-parking requirements.
- Relaxing apartment design controls, such as minimum apartment sizes.
- The use of heritage protections on well-located land.
- The nature and level of state and federal taxes, including stamp duty, and infrastructure contributions.
The Productivity Commission’s assessments of the increase in commercially feasible capacity arising from states’ reforms could be used to ‘price’ what the federal government is willing to pay to encourage state governments to enact these reforms.
Acknowledgements
This report was written by Brendan Coates, Joey Moloney, and Matthew Bowes. Ashleigh Chang, Ethan Gilbert, Sanghya Mahendran, and Jonathan O’Brien provided research assistance and made substantial contributions. The report was edited by Paul Austin.
We would like to thank Ann-Maree Carruthers, Esther Cheong, John Daley, Sam D’Amico, Ben Hendricks, Matthew Maltman, Phil Manners, Dan McKenna, Lewis Moore, Siân Morgan, Matthew Pignata, Marcus Spiller, Will Sullivan, Peter Tulip, and Jacob Vince for their helpful comments. We would also like to acknowledge Urbis staff for facilitating a helpful workshop, and the generous support of Cotality in providing data that underpins the Grattan Model of Australian Planning Systems (GMAPS) used in this report.
The opinions in this report are those of the authors and do not necessarily represent the views of Grattan’s founding members, affiliates, individual board members, reference group members, or reviewers. The authors are responsible for any errors or omissions.
Grattan Institute is an independent think tank focused on Australian public policy. Our work is independent, practical, and rigorous. We aim to improve policy by engaging with decision makers and the broader community. We acknowledge and celebrate the First Nations people on whose traditional lands we meet and work, and whose cultures are among the oldest in human history.
For further information on Grattan’s programs, or to join our mailing list, please go to: www.grattan.edu.au. You can donate to support future Grattan reports here: www.grattan.edu.au/donate.
This report may be cited as: Coates, B., Moloney, J., and Bowes, M. (2025). More homes, better cities: Letting more people live where they want. Grattan Institute. ISBN:
978-1-7641250-1-7
All material published or otherwise created by Grattan Institute is licensed under a Creative Commons Attribution-NonCommercial-ShareAlike 3.0 Unported License. Cover photo: ‘Imperium’ – KUD.